


1 Introduction
Assumptions on how risk aversion changes in wealth are common in decision theory. They are an important condition for many theoretical results in fields such as development studies (Ogaki & Zhang, Reference Ogaki and Zhang2001), insurance demand (Mossin, Reference Mossin1968), asset pricing (Basso & Pianca, Reference Basso and Pianca1997), or taxation (Hellwig, Reference Hellwig2007). Such assumptions are common when using structural forms of utility functions in empirical calibrations of decision models (e.g., Handel, Reference Handel2013; Lockwood, Reference Lockwood2018) or in elicitations of risk preferences from choices (e.g., Cohen & Einav, Reference Cohen and Einav2007; Holt & Laury, Reference Holt and Laury2002).
This paper uses a new approach to gain empirical insights into the change of risk aversion in wealth. In a mobile game, players collect in-game currency, which they can spend on new game content. At the end of each successful round, players make a lottery choice which allows us to infer bounds on their risk aversion. Tracking the players’ decisions at different in-game wealth levels enables us to determine the effect of wealth on risk aversion. Although players cannot win real money, the in-game currency can be spent on game content so that our setting is salient in the sense of Smith (Reference Smith1982). The use of a mobile game with an in-game currency which derives value from in-game purchases lets us analyze a closed economic system. Because there is no external market for the in-game currency, the relevant wealth for players’ decisions can be measured in isolation, providing us with a novel setting for analyzing the impact of wealth on risk preferences.
We find evidence for both decreasing absolute risk aversion (DARA) and decreasing relative risk aversion (DRRA). Our findings are robust to various econometric specifications, alternative definitions of wealth, and potential boredom by the subjects. We further identify a set of decisions made following a simple “always safe” heuristic and a tendency of players to believe in the “hot hand fallacy”. Our results on absolute risk aversion concur with the economic intuition originally presented by Arrow (Reference Arrow1971) and the majority of other studies on the topic (e.g., Chiappori & Paiella, Reference Chiappori and Paiella2011; Guiso & Paiella, Reference Guiso and Paiella2008; Levy, Reference Levy1994). Our findings on relative risk aversion are in line with the results of Paravisini et al., (Reference Paravisini, Rappoport and Ravina2017).
Our study is complementary to previous analyses of the issue. How risk aversion changes in wealth has been analyzed by cross-sectional survey studies (e.g., Cicchetti & Dubin, Reference Cicchetti and Dubin1994; Guiso & Paiella, Reference Guiso and Paiella2008; Halek & Eisenhauer, Reference Halek and Eisenhauer2001), panel analyses (e.g., Brunnermeier & Nagel, Reference Brunnermeier and Nagel2008; Paravisini et al., Reference Paravisini, Rappoport and Ravina2017), and laboratory experiments (e.g., Levy, Reference Levy1994). However, each of these methods has some challenges. Survey studies often cannot establish causality in their analyses because just as wealth can influence risk aversion, the predominance of positive risk premiums on asset markets allows risk aversion to influence (average) wealth. Using panel data can, potentially, disentangle the endogeneity problem, but suffers from inertia in the financial choices made by individuals (Brunnermeier & Nagel, Reference Brunnermeier and Nagel2008). Even when only active decisions are analyzed and inertia can thus be excluded, it is not always possible to accurately measure the wealth of the analyzed individuals. Using general wealth fluctuations for the entire population is an alternative. These, however, are usually associated with changes in economic climate, which is known to affect risk preferences (Guiso et al., Reference Guiso, Sapienza and Zingales2018). Evidence from laboratory experiments could potentially remedy some of the issues faced by studies of naturally occurring data. However, since stakes in the laboratory are often small, it is unclear whether revealed preferences approaches in this environment actually estimate utility curvature in the canonical sense or whether they reflect some other form of risk preference motive (Bleichrodt et al., Reference Bleichrodt, Doctor, Gao, Li, Meeker and Wakker2019; Rabin, Reference Rabin2000). Even if utility curvature was measured, it is unclear whether the utility function over the small stakes of the laboratory is representative for the one applied to wealth outside of the laboratory. Hypothetical scenario choices can feature more substantial stakes. This methodology, however, has its own underlying problems, such as measurement errors (Bound et al., Reference Bound, Brown, Mathiowetz, Heckman and Leamer2001) and distortions due to the lack of salience and incentive compatibility (Dohmen et al., Reference Dohmen, Falk, Huffman, Sunde, Schupp and Wagner2011; Holt & Laury, Reference Holt and Laury2002; Smith, Reference Smith1982).
Our results are complementary to the previous literature because our study is able to exclude many previous caveats, although it may have a lower external validity than studies of real monetary flows. In the analyzed game, players cannot increase their level of in-game wealth by making cash payments and in-game wealth cannot be converted to outside wealth. As a consequence, in-game wealth and personal wealth outside of the game are independent of each other, such that observing the players’ in-game wealth is sufficient to fully observe the wealth relevant to their choices. Further, letting the players make decisions in a simulated environment allows us to make observations financially unaffected by the current economic climate. Our setting also does not allow for inertia to determine the players’ choices. In naturally occurring data, this problem often arises, because households adjust their financial choices only very slowly following changes in wealth (Brunnermeier & Nagel, Reference Brunnermeier and Nagel2008). In our setting, players are required to make active choices before the game continues, ruling out inertia as a possible choice mechanism. Lastly, because we consider a simulated environment, we are not limited regarding the size of the lottery stakes and can use outcomes which are significant shares of the players’ wealth.
We draw implications for theoretical models, empirical calibrations, and economic applications. Since the results of theoretical models often depend on how risk aversion changes in wealth, our findings can be used to make behaviorally valid assumptions. For empirical calibrations of decision models, utility functions with constant absolute risk aversion or constant relative risk aversion are the predominant parametric assumptions. Our results reject these types of utility functions, at least for our sample and our study setting. We suggest the expo-power function by Saha (Reference Saha1993) as an alternative parametric form.
2 Setting and experimental design
We collect observations from the decisions players made in the mobile game “Crashy Cakes” published for Android smartphones. The game is a modified version of the classic arcade game Missile Command in which the players’ avatar defends a base against attacking enemies by throwing pieces of cake at them. As the game continues, the waves of enemies become increasingly faster, more numerous, and harder to defeat such that the difficulty is continuously increasing. When not firing cakes, the players need to create new ammunition in one of two ovens placed in the lower corners of the screen. By removing enemy units, the players earn both in-game currency and potential rewards in the form of special ammunition or other forms of temporary upgrades. We show a typical game situation in panel (a) of Fig. 1.
In-game currency can be spent on additional game content in the shop (panel (b) of Fig. 1). Content bought in the shop is cosmetic. Players can purchase alternative avatars, also called “skins”. These are categorized into regular and special with the latter having additional visual effects. Additionally, in-game currency can be spent at the beginning of each new round. In this case, certain temporary upgrades are available to the player at the start of the round. Content prices range from 250 to 4,000 units of in-game currency.

Fig. 1 Situations encountered in the game (English version)
There are four ways in which players are able to earn in-game currency: (1) through actions in the game as described above, (2) through being granted bonus gifts at increasing intervals in the game progression, (3) through watching a 30 s advertisement video at certain points in the game to gain either in-game currency or temporary game upgrades directly, and (4) through a bonus lottery after a successful game round. Notably, players are not able to purchase in-game currency with real money, such that the game represents a closed economic system. This precludes any considerations of choice bracketing (Read et al., Reference Read, Loewenstein and Rabin1999), because outside wealth is irrelevant to in-game wealth.
At the end of each round, if players have collected 10 points in the round (equivalent to surviving approximately 45s or longer), they are presented with a bonus lottery decision. In this decision, players can choose between a lottery with a 50% chance of a high outcome and a 50% chance of a low outcome or a certain payment between these two outcomes. An example of such a lottery decision is shown in panel (c) of Fig. 1. The risky option is depicted as a rotating coin, labeled as “risky”, with a red and a green side. The safe option is depicted as a treasure chest with the label “safe”. Which of these choice alternatives is displayed on the left was randomized for every decision. Below each picture, the game lists the probabilities of the potential outcomes. The game also displays the current level of wealth above the two choice alternatives, and, below the two choice alternatives, it shows the potential wealth levels that would result from each potential lottery outcome.
The exact payoffs in the decision depend on the treatment that the player is in. Upon installation of the game, players are randomly assigned to the Absolute Treatment or the Relative Treatment. If players are in the former treatment, the lottery always features a high payoff of 150 and a low payoff of 10. The safe payment is a randomly chosen amount between 60 and 90 in increments of 2 such that in total, 16 different lotteries are possible. In the Relative Treatment, the lotteries are dependent on the current in-game wealth of the player. The lottery payoffs are 15% and 1% of the current wealth, while the safe payments vary between 6% and 9% of the current wealth in increments of 20 basis points.Footnote 1 The lotteries are thus set up to be equal when wealth is equal to 1000 units. Indifference in the absolute lotteries implies a coefficient of absolute risk aversion from −0.0041 (if the safe payment was 90) to 0.0086 (if the safe payment was 60). Indifference in the relative lotteries implies a coefficient of relative risk aversion from −4.49 (if the safe amount was 9% of wealth) to 9.24 (if the safe payment was 6% of wealth). We chose to use safe payments as the less risky option instead of less risky lotteries (as is, for example, the case in Holt & Laury, Reference Holt and Laury2002) for two reasons. First, it simplifies the decision situation such that the choices are easy to understand for players. Second, it allows us to calculate risk aversion coefficients which imply indifference relationships in each lottery without any parametric assumption on the utility function. In Online Appendix A, we use this feature of our lotteries for an analysis which regresses on the players’ risk aversion coefficients directly. One could argue that such lottery decisions measure a preference for certainty instead of utility curvature. However, recent research on comparable lotteries shows no difference in behavior when certain payments are the safe option in multiple price lists rather than less risky lotteries (Jaspersen et al., Reference Jaspersen, Ragin and Sydnor2022).
3 Data
3.1 Procedure and sample
The game was published on May 11
 2020. On May 29
 , the YouTube influencer “Paluten” included a 30s promotional clip for the game in one of his YouTube videos. At the time of the upload, Paluten had approximately 3.7 million followers with the majority of the demographic being young, male Germans. By the end of the data collection period, the video which included the promotional clip was viewed 573,000 times. As specified in the pre-analysis plan, the data collection period ended 60 days after the upload of the promotional video on July 28
 2020. Figure 2 shows the daily game downloads from Google’s Play Store during this observation period. It is evident that the promotion video had a large impact on the number of downloads. The small increases in downloads at later points in time coincide with other promotional events or the publications of other games by the publisher.

Fig. 2 Game downloads from Google’s Play Store in the 60 days after the promotion video was made available on YouTube
In total, the game was downloaded 10,396 times. Upon first start of the game, players were asked whether they were 16 or older. If they indicated to be younger, they were immediately dropped from the sample and their data was not considered further in this study. Players who indicated that they were old enough were then able to make a decision whether or not they wanted to make their in-game choices available for scientific analysis. 54% of players indicated that they were old enough and gave permission for the use of their data. Additionally, players had, at all times, the option to withdraw their agreement for use of their data. In this case no further data was recorded. However, the data transmitted so far was still used in the analysis. During the observation period, 247 players withdrew their agreement at some point in time.
Game mechanics, data protection guidelines and technical restrictions led to further reductions on the sample. Table 1 details the entire sample selection process. Roughly 1000 players downloaded the game and indicated consent, but never finished a game round and roughly half of those players which finished a round never reached the lottery decision. Two players had to be removed from the sample because their data was corrupted. After a game run ended, there was a break of 0.5s after which the lottery was animated for 0.25s. During this time, a lottery choice could be made, even though the possible outcomes of the choice options were not visible because the mobile phone had to render the graphical interface. We deleted all 442 lottery choices made in this time interval. In compliance with EU standards on the general data protection regulation (GDPR), lottery choice data of the consenting players was transferred to the game developer and then immediately anonymized through a scripted algorithm. In the process of anonymization, a few players had to be removed from the sample if they had unique identifying demographic characteristics. We also remove decisions by players who had more than 6000 units of in-game currency at the time of the decision. This leaves out 1.45% of the decisions (70 decisions in the Absolute and 216 decisions in the Relative Treatment) and was not specified in the pre-analysis plan.Footnote 2 The restriction is sensible for two reasons. First, including these decisions, especially those with very high in-game wealth skews the results of the estimators in the analysis such that they do not represent the majority of decisions which are made at lower wealth levels. Second, and more importantly, an in-game wealth of 6000 or higher implies that players did not use the in-game wealth for purchases in the shop (all of which are available for 4000 units or less) and might thus not have seen the wealth as a salient reward in the sense of Smith (Reference Smith1982). Conclusions of the analysis are robust to this exclusion as is described in Sect. 5. Our final sample consists of 19,400 lottery decisions of 2216 consenting players aged 16 or older.
Table 1 Sample selection process

|
Step |
Description |
Individuals |
Lottery decisions |
|---|---|---|---|
|
0 |
All individuals and observations in observation period |
10,396 |
– |
|
1 |
Remove individuals younger than 16 or with negative consent |
5545 |
20,790 |
|
2 |
Remove individuals without finished game runs |
4496 |
20,790 |
|
3 |
Remove individuals without lottery decisions |
2265 |
20,790 |
|
4 |
Remove individuals and lottery decisions with corrupt game information |
2263 |
20,717 |
|
5 |
Remove decisions made in less than 0.75 s |
2263 |
20,348 |
|
6 |
Remove individuals with unique or missing demographic attributes |
2216 |
19,686 |
|
7 |
Remove lottery decisions with wealth levels above 6000 |
2216 |
19,400 |
|
Full sample |
2216 |
19,400 |
The table describes the steps of the sample selection process and displays the number of individuals and lottery decisions kept after each data cleaning step. The number of lottery decisions does not change in steps 2 and 3 because these steps remove players without lottery decisions from the sample
We next consider the number of runs played in the game in panel (a) of Fig. 3. The figure shows the time series for all players that downloaded the game, all players that gave consent to use their data in the analysis of this study and all players which were included in the final sample. Game runs look similar to download times, but players seem to be active for more than one day in the game, on average. We can also see very little difference in the distribution of game runs between the three displayed groups, indicating no selection bias in the activity of the players. The distribution of the lottery decisions used in the analysis over time is displayed in panel (b) of Fig. 3. The figure shows the same shape as that of the game runs and indicates that the majority of the decisions in the sample is made in the first two weeks of the observation period.

Fig. 3 Finished game runs and the number of lottery decisions by players in the 60 days after the promotion video was made available on YouTube
3.2 Descriptive statistics
At first start of the game, we randomly assigned the 2216 players to the Absolute Treatment (1144) and Relative Treatment (1072). Players were also asked for their age and their gender (male/female/non-binary). In the process of making the data anonymous, the game developer summarized the players’ age in bins of 10 years and their geographic location, determined through their IP address, as German or non-German. Table 2 shows the resulting descriptive statistics of our sample. Players were predominantly male and between the ages 16 and 25. The table also reports the p-value of a balance test between the two treatment groups. We can see that balancing in the treatment assignment was successful with only a single category of the Age variable, containing very few players, being statistically different between the groups.
Players finished an average of 15 game rounds and, on average, made 9 lottery decisions in the observation period. These numbers were not statistically significantly different between the two treatments. Differences in the lottery decisions are thus due to the differences in the lotteries and not due to differences in player experience. Calculated on the individual level, players achieved enough points in the game to be rewarded with a lottery decision in 53.56% (median 53.33%) of the cases. This shows that reaching the lottery choice is not a trivial accomplishment. It can thus be reasoned that the players saw the lottery as a reward for their skill rather than as a windfall payment. We can further see that players spent their earned in-game currency in the shop. This lets us conclude that the shop’s content was attractive to the players and thus that the in-game currency constitutes a salient reward in the sense of Smith (Reference Smith1982).
Table 2 Descriptive statistics of the treatment groups and the overall sample

|
Absolute Treatment |
Relative Treatment |
P-value difference |
Overall |
|
|---|---|---|---|---|
|
Panel A: User Demographics |
||||
|
Unique users |
1144 |
1072 |
2216 |
|
|
Not German |
138 (12.1%) |
143 (13.3%) |
0.402 |
281 (12.7%) |
|
Age |
||||
|
16–25 |
1068 (93.4%) |
989 (92.3%) |
0.358 |
2057 (92.8%) |
|
26–35 |
55 (4.8%) |
45 (4.2%) |
0.556 |
100 (4.5%) |
|
36–45 |
8 (0.7%) |
19 (1.8%) |
0.035** |
27 (1.2%) |
|
> 45 |
13 (1.1%) |
19 (1.8%) |
0.282 |
32 (1.4%) |
|
Sex |
||||
|
Male |
1016 (88.8%) |
955 (89.1%) |
0.89 |
1971 (88.9%) |
|
Female |
111 (9.7%) |
99 (9.2%) |
0.762 |
210 (9.5%) |
|
Non-Binary |
17 (1.5%) |
18 (1.7%) |
0.846 |
35 (1.6%) |
|
Panel B: Gameplay Information |
||||
|
Game runs |
||||
|
Mean (SD) |
15.0 (14.5) |
15.2 (15.3) |
0.761 |
15.1 (14.9) |
|
Median [Min, Max] |
10 (1, 122) |
10 (1, 126) |
10 (1, 126) |
|
|
Lottery choices |
||||
|
Mean (SD) |
8.9 (11.1) |
8.6 (10.6) |
0.544 |
8.8 (10.9) |
|
Median [Min, Max] |
5 (1, 89) |
5 (1, 98) |
5 (1, 98) |
|
|
Spending |
||||
|
Mean (SD) |
2296.0 (3822.0) |
1953.2 (3841.4) |
0*** |
2132.9 (3835.0) |
|
Median [Min, Max] |
1000 (0, 39,500) |
500 (0, 52,000) |
1000 (0, 52,000) |
|
|
Wealth |
||||
|
Mean (SD) |
880.5 (952.0) |
809.4 (919.4) |
0*** |
846.7 (937.3) |
|
Median [Min, Max] |
520 (100, 5992) |
464 (100, 5963) |
491 (100, 5992) |
|
|
Decision time |
||||
|
Mean (SD) |
6.9 (7.4) |
7.2 (7.4) |
0.001*** |
7.0 (7.4) |
|
Median [Min, Max] |
4.6 (0.8, 60.0) |
5.0 (0.9, 60.0) |
4.8 (0.8, 60.0) |
|
|
Safe choices |
||||
|
Mean (SD) |
0.434 (0.496) |
0.408 (0.492) |
0*** |
0.422 (0.494) |
|
Median [Min, Max] |
0.0 (0.0, 1.0) |
0.0 (0.0, 1.0) |
0.0 (0.0, 1.0) |
|
|
Decision at threshold |
1134 (11.2%) |
581 (6.3%) |
0*** |
1715 (8.8%) |
The table shows the descriptive statistics of the players and the individual lottery decisions. The first column shows the data of the Absolute Treatment, the second column those of the Relative Treatment. The last column combines both samples. Spending refers to the amount of money spent in the in-game shop. Decisions at Threshold are those for which the current wealth plus the high outcome of the risky decision allowed the purchase of the next more expensive item in the shop, while the current wealth plus the safe outcome of the lottery did not
Average wealth at the time of the lottery decision was 847 with a standard deviation of 937. 8.8% of decisions were made at a threshold, such that the current wealth plus the high outcome of the risky decision allowed the purchase of the next more expensive item in the shop, while the current wealth plus the safe outcome of the lottery did not. Players took an average of 7.0s for the lottery decision.Footnote 3 They decided for the safe option 42.2% of the time. Given that the displayed lottery was determined randomly from a set of 16 options and that only 31.21% of the lotteries featured a safe payment higher than the expectation of the risky option, this makes players risk averse, on average. However, as we will see in Sect. 4 below, players started with risk averse choices at lower wealth levels and became increasingly risk neutral or risk seeking at higher levels of wealth. Wealth and decision behavior in the lotteries differ between the treatment groups. This is to be expected, however, because the treatments can lead to substantially different lotteries faced by the players.
In contrast to most laboratory experiments on decisions, we were unable to fix the number of lotteries each player faces. Instead, how many lotteries a player faced depends on their skill in the game and the total amount of runs which they decide to play. As is illustrated in Table 2, the median number of lotteries faced by each player is lower than the mean, indicating a skewed distribution. This is verified by the graphical illustration of this variable’s distribution in panel (a) of Fig. 4. Panel (b) of the same figure shows the number of unique lotteries faced by players. Again, we can see a skewed distribution. It is also worth noting that slightly more than 400 players only faced one lottery decision. These players will not influence our results regarding the influence of wealth on risk preferences if we use a panel estimation, as is done in our preferred estimation of Sect. 4.

Fig. 4 Histograms illustrating the distributions of the players regarding the total number of lotteries faced (panel (a)) and the number of unique lotteries faced (panel (b))
Table 2 indicates that players did spend their in-game currency and thus that it did have value to the players. One question is whether this value declined over time, because, for example, the novelty value of in-game shop purchases wore off. To analyze this issue, we display players’ purchasing behavior over time in Fig. 5. There seems to be no detectable trend over time in the share of players who make purchases between two lottery decisions. This shows that the in-game currency was valued by players over their entire time in the game.Footnote 4 Thus, even though we did not have traditional monetary incentives, our lotteries can still be seen as incentive compatible.
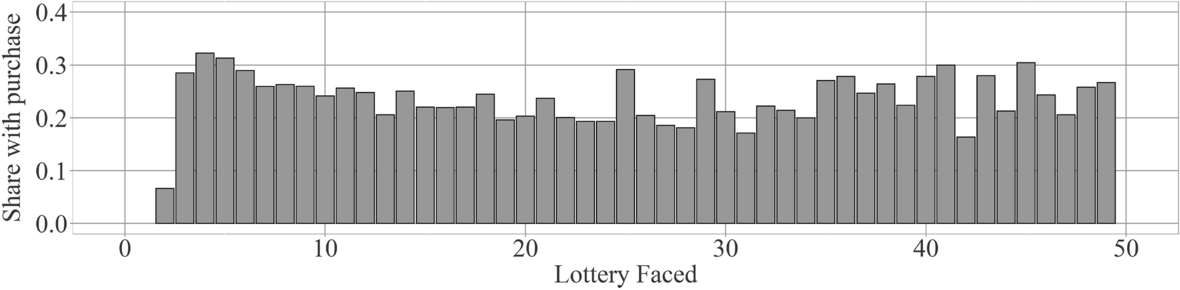
Fig. 5 Histogram shows the share of players who purchased something from the in-game store between two lottery decisions over the players’ game experience. Each column represents the share of purchases made before the
 lottery decision. Note that the figure is cut off after 50 lotteries, even though some players played more lotteries than that. However, because the number of players gets small after 50 lotteries (only 26 players made more than 50 lottery decisions), relative shares per round become less meaningful
4 Results
We start by analyzing the players’ lottery choices graphically and focus first on the overall decision strategies employed.Footnote 5 While the average decision time was over 7 s, there was a subset of decisions made much faster. Such behavior is an indication of heuristic decision-making as heuristics can be applied more quickly than substantive processing of a decision situation (Forgas, Reference Forgas1995). To identify whether choice behavior differed for shorter decision times, we plot the share of safe choices for different levels of decision time in 0.5s increments in panel (a) of Fig. 6. Strikingly, all choices with a decision time of less than 2.5s were made for the safe option. This share of choices decreases to 96.8% for 2.5 to 3s and to 70.2% for 3 to 3.5s. Choices with a decision time above 3.5s show an average of 28.7% safe choices. It thus seems like a subgroup of decisions were made according to an always safe heuristic. This is in line with previous results on decisions under time pressure which show that quick decisions lead to more risk aversion in the domain of gains (Kirchler et al., Reference Kirchler, Andersson, Bonn, Johannesson, Sørensen, Stefan, Tinghög and Västfjäll2017). We control for this behavior in the subsequent analyses by either excluding those decisions with a decision time of less than 3.5s in univariate analyses, or by including a dummy for heuristic processing in multivariate analyses.
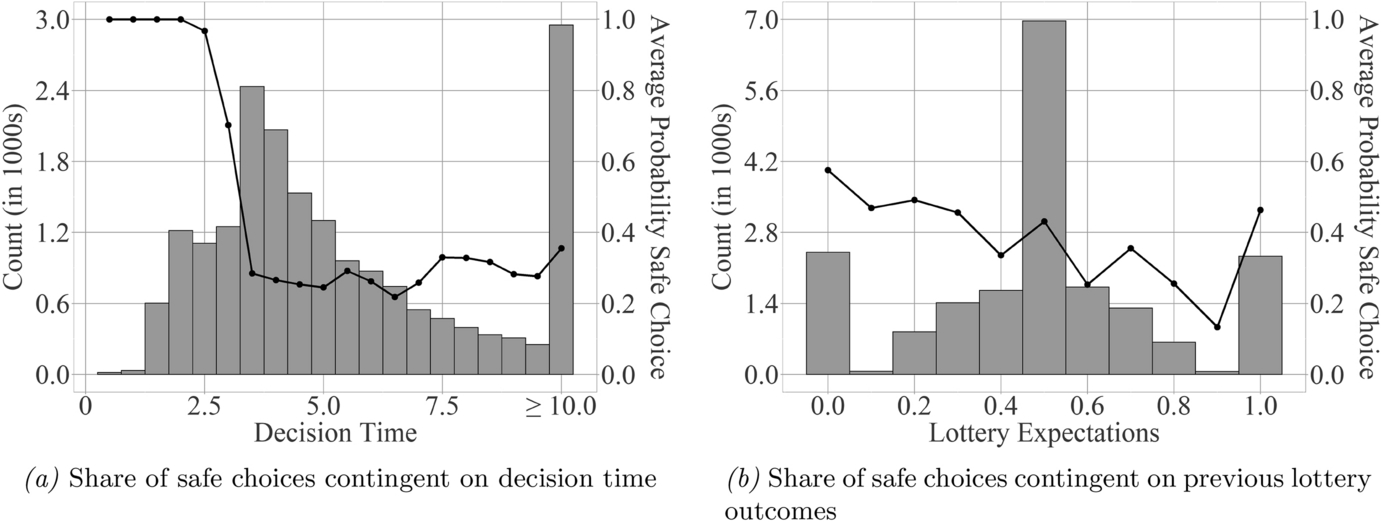
Fig. 6 Graphical analysis of safe choices contingent on decision time and previous lottery results. The bars in panel (a) show the distribution of the decision time for the analyzed lottery decisions with the frequency (in 1000s) indicated on the left y-axis. The bars in panel (b) show the distribution of the lottery expectations for the analyzed lottery decisions with the frequency (in 1000s) indicated on the left y-axis. Lottery expectations are measured as the share of positive outcomes from the risky lottery option observed by the player before their current decision. In both panels, the line plot shows the average probability of a safe choice for each 0.5s decision time bin with the scale indicated on the right y-axis. Both panels consider the full sample of 19,400 lottery decisions by 2216 players as indicated in Table 1
A second heuristic strategy which could potentially play a role in the lottery decisions is the hot hand fallacy (Gilovich et al., Reference Gilovich, Vallone and Tversky1985). It describes that players might extrapolate the probability of a positive lottery outcome from previous draws of the lottery. Such behavior would be fallacious because the individual draws from the lottery are stochastically independent. Nevertheless, players do react to the expectations they built from previous lottery outcomes as can be seen in panel (b) of Fig. 6. The propensity to choose the safe lottery decreases in the average outcome of previous lottery choices. However, the influence observed here is much weaker than that of decision time such that the hot hand fallacy seems to be a weaker determinant of subjects’ behavior. While it is thus necessary to control for the endogenously formed expectations in any multivariate analysis, we ignore it in univariate analyses.
The two panels of Fig. 7 show the share of safe choices contingent on the level of wealth for the Absolute Treatment and Relative Treatment, respectively. Both panels exclude decisions made in less than 3.5s.Footnote 6 This restriction is made to concentrate on subjects who do not decide according to the always safe heuristic. In both treatments, the wealth distribution is right-skewed, with the modal value between 250 and 500 currency units. However, we also see a sizable number of decisions at higher wealth levels. The share of safe choices in the lotteries is decreasing in wealth. When fitting a simple linear regression weighted with the number of observations in each wealth category, we see a downward sloping trend as can be seen in both diagrams.Footnote 7 Descriptively, our results thus imply decreasing absolute risk aversion and decreasing relative risk aversion. From the graphs, we can see that this effect is particularly strong at lower wealth levels. Results thus get stronger when we implement lower limits than 6000 on wealth (see Online Appendix B for details).

Fig. 7 Graphical analysis of safe choices contingent on wealth. Panels each show a treatment group and consider only players with a decision time greater than 3.5s. In both panels, wealth is measured as the current level of in-game currency and is categorized in bins of 250. Bars show the number of observations in each wealth bin. Dots represent the share of safe choices made by players with current wealth corresponding to the bin. The fitted lines represent univariate linear regressions of the displayed values weighted by the number of observations in each wealth category. The shaded areas indicate 95%-confidence intervals
The univariate result reported in Fig. 7 is subject to limitations. The first is that the analysis does not control for the effects of the choice environment or for player demographics, which could be correlated with both wealth and risk aversion. We address this issue by using a multivariate analysis. The empirical test is a regression model of whether individual i chooses the safe option at decision h as a function of wealth:

The second limitation is that wealth at decision h is potentially endogenous to choices in the game, an argument which is similar to the one laid out in Calvet and Sodini (Reference Calvet and Sodini2014) and Calvet et al. (Reference Calvet, Campbell and Sodini2009). We address this by the same tactic that Calvet and Sodini (Reference Calvet and Sodini2014) use in their analysis with individual fixed effects and instrument for the wealth at decision h with the wealth at decision
 . Because we know players had not made a lottery choice before the first, we set the instrument for
 to 0.Footnote 8
Equation (1) is a linear model of the probability to choose a safe option which includes fixed effects for the individual lotteries (denoted by
 ). The model includes individual-invariant control variables
 regarding gender, age and nationality. Due to the largely young and male sample of players, we summarize female and non-binary players into a single category and players with age greater than 25 into a single category.Footnote 9
 describes a vector of four control variables for the
 decision of player i. These control variables are an indicator function of whether the decision time was smaller than 3.5s, an indicator for the safe choice of the decision being displayed on the right, a threshold indicator, and a measure of expectations by the player. The threshold indicator was set to one if in the given decision the high outcome of the risky lottery would result in a final wealth level above the next more expensive item in the shop, while the payoff of the safe option would not. Subjects’ expectations were measured as in panel (b) of Fig. 6, that is, they are the average probability of success when choosing the risky option in all prior lottery decisions. The standard errors
 are heteroscedasticity-robust and clustered on the level of the player.
Columns (1) and (3) of Table 3 show that players display both decreasing absolute risk aversion and decreasing relative risk aversion. The effects are statistically significant at the 1% level and have an economically relevant magnitude. A one standard deviation increase in wealth decreases the probability of choosing the safe option by 3.24 percentage points in the Absolute Treatment and by 4.13 percentage points in the Relative Treatment. These analyses can be seen as the multivariate equivalent to the analyses reported in Fig. 7 showing that the results reported there are robust to the inclusion of control variables. Columns (2) and (4) of Table 3 report whether absolute or relative risk aversion change differently in wealth for any of the demographic groups. We find the differentiation between the different demographic groups decreases the overall coefficient in both treatments and makes the effect of wealth become less significant in both treatments. There also seems to be a stronger tendency towards DRRA for female and non-binary players than for male players. These results, however, are idiosyncratic to the population level linear probability model and do not hold once only within player changes in wealth are analyzed. The instrument is strong in all four reported estimations. The table shows its F-statistic on the first stage of the estimation. All statistics are fairly high, exceeding the critical threshold of 100 in every case.
Table 3 Results of the population two-stage least squares level linear probability model

|
Dependent variable: safe choice |
||||
|---|---|---|---|---|
|
Absolute Treatment |
Relative Treatment |
|||
|
(1) |
(2) |
(3) |
(4) |
|
|
Wealth (in 1000s) |
−0.034*** |
−0.024** |
−0.045*** |
−0.028** |
|
(0.010) |
(0.011) |
(0.010) |
(0.012) |
|
|
Not male
|
−0.030 |
−0.088
|
||
|
(0.027) |
(0.028) |
|||
|
Age >25
|
−0.051 |
−0.017 |
||
|
(0.051) |
(0.025) |
|||
|
Not German
|
−0.023 |
−0.010 |
||
|
(0.042) |
(0.018) |
|||
|
Not Male |
−0.017 |
0.010 |
0.017 |
0.096*** |
|
(0.028) |
(0.033) |
(0.038) |
(0.033) |
|
|
Age >25 |
0.014 |
0.050 |
−0.014 |
−0.003 |
|
(0.036) |
(0.041) |
(0.026) |
(0.034) |
|
|
Not German |
−0.025 |
−0.007 |
0.003 |
0.006 |
|
(0.033) |
(0.033) |
(0.024) |
(0.026) |
|
|
Dec.Time <3.5s |
0.612*** |
0.613*** |
0.631*** |
0.629*** |
|
(0.017) |
(0.017) |
(0.017) |
(0.017) |
|
|
Threshold |
−0.015 |
−0.014 |
−0.047*** |
−0.049*** |
|
(0.013) |
(0.013) |
(0.017) |
(0.017) |
|
|
Safe on Right |
0.009 |
0.008 |
0.011 |
0.012 |
|
(0.009) |
(0.009) |
(0.011) |
(0.011) |
|
|
Lottery expectations |
−0.080*** |
−0.082*** |
−0.043 |
−0.043 |
|
(0.026) |
(0.026) |
(0.029) |
(0.029) |
|
|
Control variables |
Yes |
Yes |
Yes |
Yes |
|
Individual fixed effects |
No |
No |
No |
No |
|
Lottery fixed effects |
Yes |
Yes |
Yes |
Yes |
|
Clustered st. err. |
Yes |
Yes |
Yes |
Yes |
|
Number of players |
1144 |
1144 |
1072 |
1072 |
|
1st Stage F-statistic on Wealth |
7517 |
5418 |
2849 |
2365 |
|
Observations |
10,170 |
10,170 |
9230 |
9230 |
|
Adjusted R
|
0.278 |
0.279 |
0.262 |
0.263 |


The table displays the results of a two-stage least squares linear probability model with the safe choice as the dependent variable. Columns (1) and (2) consider players in the Absolute Treatment. Columns (3) and (4) consider players in the Relative Treatment. Wealth is defined as the current level of in-game currency and is instrumented for using its one period lag. All regressions include fixed effects on the lottery level. Standard errors, heteroscedasticity-robust and clustered on the subject level, are in parentheses. *, **, and *** indicate significance at the 10, 5, and 1 percent level, respectively
The signs of the control variables are also as one would expect. Demographic variables seem to have little influence on risk aversion. The only variable which shows some statistical significance is the gender of the player. Here, the results are congruent with other studies of gender effects showing higher risk aversion of female players (Charness and Gneezy, Reference Charness and Gneezy2012). Note, however, that our specific demographic makes analyses of gender effects difficult which likely contributes to the inconsistent coefficients on this variable. The indicator for a very short decision time is large and significantly positive. The threshold variable is negative and significant in the Relative Treatment group. If the risky option can unlock a new item in the shop and the safe option cannot, the probability of choosing the former increases. It is also reasonable that such an effect would appear more strongly in the Relative Treatment because the relative lotteries allowed for greater differences between the high risky and the safe payoff compared to the Absolute Treatment as the wealth increases. Whether or not the safe lottery was displayed on the right does not seem to have a significant effect on choices. The lottery expectations have a negative coefficient in all reported analyses. There seems to have been at least a subset of players who acted according to the hot hand fallacy and believed that lucky draws in past decisions were an indication of lucky draws in the current decision. This effect, however, is only significant in the Absolute Treatment, indicating that the fallacy does not have a consistent influence on decision-making. Taken together, the results on the control variables provide some measure of confidence for the experimental design. The fact that the threshold variable had an influence on choices shows that players cared about potential rewards in the shop and thus the in-game currency. The display order not having an influence shows that players cared about the consequences of their choices and did not simply choose the more conveniently reachable option.
The results from the population level analyses paint a consistent picture. Both absolute and relative risk aversion decrease in wealth, supporting the DARA and DRRA hypotheses in the setting of our field experiment. The population level analyses do, however, have an important limitation. They compare wealth levels both within and across individuals, such that the change of risk aversion in wealth is treated as a potentially interpersonal trait. This is not consistent with the theoretical motivation for a risk aversion coefficient. However, because we observe multiple decisions by the same player at different wealth levels, our experimental design allows an analysis focused on within player changes in wealth. The model again is a linear two-stage least squares regression of whether individual i chooses the safe option at decision h as a function of wealth:

In contrast to Eq. (1), this model includes individual fixed effects (denoted
 ). Because these fixed effects limit the estimation to the analysis of within player changes in wealth and it thus treats risk aversion as a purely individual characteristic, we consider this analysis our preferred specification. Since the demographic variables in
 are fixed on the level of the player, they are excluded from the analysis here and only those control variables which differ across lotteries are included. As before, the standard errors
 are heteroscedasticity-robust and clustered on the level of the player.
The estimated coefficients of the individual level analysis are displayed in Table 4. In both treatments, we see a statistically significant negative influence of wealth on the probability of choosing the safe payment. The individual level analysis thus also shows the players to have DARA and DRRA. The coefficients imply a sizable marginal effect as a one standard deviation shift in wealth is associated with a 3.90 (3.40) percentage point decrease in the likelihood of choosing the safe lottery in the Absolute (Relative) Treatment. As in Table 4 above, we find no consistent heterogeneous effects of wealth between the different demographic groups. Combined with the results of the previous analyses, this implies that both DARA and DRRA are general phenomena. It can also be seen as an indication that our results generalize beyond the gender and age group predominant in our sample.Footnote 10
Table 4 Results of the individual level two-stage least squares linear probability model

|
Dependent variable: safe choice |
||||
|---|---|---|---|---|
|
Absolute Treatment |
Relative Treatment |
|||
|
(1) |
(2) |
(3) |
(4) |
|
|
Wealth (in 1000s) |
−0.041*** |
−0.043*** |
−0.037*** |
−0.030*** |
|
(0.007) |
(0.009) |
(0.007) |
(0.009) |
|
|
Not Male
|
0.002 |
−0.046** |
||
|
(0.019) |
(0.020) |
|||
|
Age >25
|
0.003 |
−0.012 |
||
|
(0.036) |
(0.021) |
|||
|
Not German
|
0.016 |
0.005 |
||
|
(0.027) |
(0.016) |
|||
|
Control variables |
Yes |
Yes |
Yes |
Yes |
|
Individual fixed effects |
Yes |
Yes |
Yes |
Yes |
|
Lottery fixed effects |
Yes |
Yes |
Yes |
Yes |
|
Clustered st. err. |
Yes |
Yes |
Yes |
Yes |
|
Number of players |
1144 |
1144 |
1072 |
1072 |
|
1st Stage F-statistic on wealth |
3630 |
2458 |
1114 |
989.7 |
|
Observations |
10,170 |
10,170 |
9230 |
9230 |
|
Adjusted R
|
0.430 |
0.430 |
0.402 |
0.401 |


The table displays the results of a two-stage least squares linear probability model with the safe choice as the dependent variable. Columns (1) and (2) consider players in the Absolute Treatment. Columns (3) and (4) consider players in the Relative Treatment. Wealth is defined as the current level of in-game currency and is instrumented for using its one period lag. All regressions include fixed effects on the lottery level and the subject level. Standard errors, heteroscedasticity-robust and clustered on the subject level, are in parentheses. *, **, and *** indicate significance at the 10, 5, and 1 percent level, respectively
5 Robustness
5.1 Alternative specifications
The analyses reported above make certain assumptions and specification decisions. In this section, we review the three major assumptions and evaluate our results’ robustness to them. Table 5 shows the abbreviated results for the two multivariate analyses considered in Sect. 4.Footnote 11 Because we rarely find heterogeneous effects of wealth on risk aversion between the different demographic groups in the analyses reported above, we focus on the analyses without interaction terms here.
In all analyses of Sect. 4, we exclude the decisions made by subjects, who, at the point of the decision, have a level of in-game currency higher than 6000. Not applying this filter still leads to statistically significant findings of DARA and DRRA as can be seen in columns (1) and (4) of Table 5. However, the estimated coefficients are smaller than before and the marginal effect of a 1000 unit increase in wealth is thus smaller. At the same time, because the standard deviation of wealth in both treatments is now higher, the marginal effect of a one standard deviation in wealth shift remains at sizable levels. Specifically, a one standard deviation increase of wealth in the Absolute Treatment leads to a 3.48 percentage point decrease in the probability of choosing the safe payment. A one standard deviation shift in wealth in the Relative Treatment leads to a 1.83 percentage point decrease in the choice probability.
Table 5 Results of the population level and individual level two-stage least squares linear probability model with alternative specifications

|
Dependent variable: safe choice |
||||||
|---|---|---|---|---|---|---|
|
Absolute Treatment |
Relative Treatment |
|||||
|
(1) |
(2) |
(3) |
(4) |
(5) |
(6) |
|
|
Population level two-stage least squares linear probability model |
||||||
|
Wealth (in 1000s) |
−0.025*** |
−0.025* |
−0.008*** |
−0.038*** |
||
|
(0.007) |
(0.013) |
(0.002) |
(0.014) |
|||
|
Altern. Wealth (in 1000s) |
−0.019*** |
−0.019*** |
||||
|
(0.005) |
(0.004) |
|||||
|
Individual level two-stage least squares linear probability model |
||||||
|
Wealth |
−0.029*** |
−0.042*** |
−0.005*** |
−0.038*** |
||
|
(in 1000s) |
(0.008) |
(0.009) |
(0.002) |
(0.008) |
||
|
Altern. Wealth |
−0.025*** |
− 0.020*** |
||||
|
(in 1000s) |
(0.005) |
(0.004) |
||||
|
Control variables |
Yes |
Yes |
Yes |
Yes |
Yes |
Yes |
|
Lottery fixed effects |
Yes |
Yes |
Yes |
Yes |
Yes |
Yes |
|
Clustered st. err. |
Yes |
Yes |
Yes |
Yes |
Yes |
Yes |
|
Number of players |
1144 |
1144 |
1144 |
1072 |
1072 |
1072 |
|
Observations |
10,240 |
10,170 |
10,170 |
9446 |
9230 |
9230 |
The table displays the results of the models for Tables 3 and 4 with alternative model specifications. Columns (1) through (3) consider players in the Absolute Treatment. Columns (4) through (6) consider players in the Relative Treatment. Columns (1) and (4) report results including the decisions by players with a current level of in-game currency higher than 6000 units. Columns (2) and (5) replace the control variable Decision Time <3.5s with a continuous measure of decision time and the squared value of that measure. Columns (3) and (6) replace the wealth measure by an alternative wealth measure which is defined as the current level of in-game currency and all money spent in the game so far. Decisions by players with a current level of in-game currency higher than 6000 units are excluded from the analysis reported in columns (2), (3), (5), and (6). Results in the first horizontal panel use the framework of the population level linear probability model reported in Table 3. Results in the second horizontal panel use the framework of the individual level, player fixed effects linear probability model reported in Table 4. All wealth measures in all estimations are instrumented for using the one period lag of the current level of in-game currency. All regressions include fixed effects on the lottery level. Standard errors, calculated as indicated for every panel, are in parentheses. *, **, and *** indicate significance at the 10, 5, and 1 percent level, respectively
In the main analyses, we control for heuristic decision processing by including an indicator for the decision time being below 3.5s. As an alternative to this specification, we include the decision time and its squared magnitude as control variables in the estimation. As can be seen in columns (2) and (5) of Table 5, results change in the population level analysis of the Absolute Treatment and become mostly insignificant. They do, however, remain comparable in terms of sign and significance in the population analysis of the Relative Treatment and in our preferred analysis, the individual level analysis. This discrepancy can be explained by the fact that average decision time and average wealth correlate relatively strongly between subjects (correlation coefficient −0.234) but not as strongly when considered both between and within subjects (correlation coefficient −0.130). Considering the influence of decision time on the probability of choosing the safe lottery in panel (a) of Fig. 6, we can see that the quadratic function that is used in the robustness specification is unable to capture the functional form well.Footnote 12 Thus, the correlation between decision time and the dependent variable will bias the coefficient of wealth in the estimations using a quadratic function instead of a step function. In the population level analysis, where the correlation between decision time and wealth is particularly strong, this bias is so strong that the coefficient loses statistical significance in the Absolute Treatment. However, since the individual level analysis, which is our preferred specification, still shows statistically significant and economically meaningful effects of wealth on risk aversion even if we use the quadratic function to control for decision time, the robustness analyses lend support to the DARA and DRRA hypotheses.
Lastly, wealth could not only refer to the current in-game account balance, but could also refer to the amount of money already spent in the game’s shop. To account for this possibility, we generated an alternative wealth measure of in-game currency plus all money spent in the shop so far. As can be seen in columns (3) and (6) of Table 5, using this alternative wealth measure does not affect our conclusions that both absolute and relative risk aversion are decreasing in wealth. However, the result for relative risk aversion has to be considered with caution as the lotteries in the Relative Treatment are designed as relative to the in-game currency wealth and not to the wealth including money already spent.
5.2 Boredom and robustness of the instrument
Another possible challenge to our results is that players’ wealth is generally increasing with the amount of time that they have spent in the game. It could thus be that our results are driven by players learning more about the game or the lotteries or by the value of in-game currency changing for the players over time spent in the game. To analyze the potential of this explanation for our findings, we include a linear time trend in our individual level panel analysis. Table 6 reports the results of this analysis. Using a time trend is a simple way of proxying the possibility that people are either getting bored with playing the safe lottery option or start getting direct utility from taking risk in the lottery, independent of the lottery prizes. While the coefficients in all analyses lose some magnitude when including the time trend, they mostly remain statistically significant. The exception is the Relative Treatment if interactions of wealth and the demographic characteristics are included. In this case the coefficient is not significant at the 1% level any more. Our large sample size makes us hesitant to interpret coefficients with worse than 1% statistical significance. However, because the overall effect in column (3) is still significant at the 1% level, we see our result of DRRA as robust to the inclusion of a time trend.
Table 6 Results of the individual level two-stage least squares linear probability model including a linear time trend

|
Dependent variable: safe choice |
||||
|---|---|---|---|---|
|
Absolute Treatment |
Relative Treatment |
|||
|
(1) |
(2) |
(3) |
(4) |
|
|
Wealth (in 1000s) |
−0.023*** |
−0.025*** |
−0.022*** |
−0.019** |
|
(0.008) |
(0.010) |
(0.008) |
(0.009) |
|
|
Not Male
|
0.006 |
−0.036* |
||
|
(0.018) |
(0.020) |
|||
|
Age >25
|
0.004 |
−0.010 |
||
|
(0.036) |
(0.022) |
|||
|
Not German
|
0.010 |
0.009 |
||
|
(0.021) |
(0.016) |
|||
|
Time Trend |
−0.003*** |
−0.003*** |
−0.003*** |
−0.002*** |
|
(0.001) |
(0.001) |
(0.001) |
(0.001) |
|
|
Control variables |
Yes |
Yes |
Yes |
Yes |
|
Individual fixed effects |
Yes |
Yes |
Yes |
Yes |
|
Lottery fixed effects |
Yes |
Yes |
Yes |
Yes |
|
Clustered st. err. |
Yes |
Yes |
Yes |
Yes |
|
Number of players |
1144 |
1144 |
1072 |
1072 |
|
1st Stage F-statistic on Wealth |
3915 |
2930 |
915.8 |
1043 |
|
Observations |
10,170 |
10,170 |
9230 |
9230 |
|
Adjusted R
|
0.434 |
0.433 |
0.403 |
0.403 |


The table displays the results of a two-stage least squares linear probability model with the safe choice as the dependent variable. Columns (1) and (2) consider players in the Absolute Treatment. Columns (3) and (4) consider players in the Relative Treatment. Wealth is defined as the current level of in-game currency and is instrumented for using its one period lag. All regressions include fixed effects on the lottery level and the subject level. Standard errors, heteroscedasticity-robust and clustered on the subject level, are in parentheses. *, **, and *** indicate significance at the 10, 5, and 1 percent level, respectively
In our definition of the instrument, we make the choice to set the instrument equal to zero at the first decision of each player. This is not an arbitrary choice, because players just started the game and thus wealth in the previous lottery was 0 in the sense that there was no previous lottery. Nevertheless, we present a robustness analysis of this assumption in which we drop the first period and thus render the choice of the instrument’s value moot. This analysis also speaks to the issue of potentially bored players, because the fascination of facing a lottery has faded to a certain extent after having faced the first one. The results in Table 7 show a consistent picture when compared to those in Table 6. Coefficient sizes are smaller, but remain statistically significant except for the Relative Treatment when interactions with demographic variables are included. Lastly, the instrument remains strong in all four estimations, providing further support of its validity.
Table 7 Results of the individual level two-stage least squares linear probability model excluding the first period

|
Dependent variable: safe choice |
||||
|---|---|---|---|---|
|
Absolute Treatment |
Relative Treatment |
|||
|
(1) |
(2) |
(3) |
(4) |
|
|
Wealth (in 1000s) |
−0.020*** |
−0.022** |
−0.023*** |
−0.015* |
|
(0.007) |
(0.009) |
(0.007) |
(0.009) |
|
|
Not Male
|
0.0003 |
−0.048** |
||
|
(0.018) |
(0.021) |
|||
|
Age >25
|
0.003 |
−0.005 |
||
|
(0.025) |
(0.022) |
|||
|
Not German
|
0.011 |
−0.0001 |
||
|
(0.031) |
(0.016) |
|||
|
Control variables |
Yes |
Yes |
Yes |
Yes |
|
Individual fixed effects |
Yes |
Yes |
Yes |
Yes |
|
Lottery fixed effects |
Yes |
Yes |
Yes |
Yes |
|
Clustered st. err. |
Yes |
Yes |
Yes |
Yes |
|
Number of players |
926 |
926 |
873 |
873 |
|
1st Stage F-statistic on Wealth |
2995 |
2023 |
947.6 |
831 |
|
Observations |
9026 |
9026 |
8158 |
8158 |
|
Adjusted R
|
0.488 |
0.488 |
0.446 |
0.446 |


The table displays the results of a two-stage least squares linear probability model with the safe choice as the dependent variable. Columns (1) and (2) consider players in the Absolute Treatment. Columns (3) and (4) consider players in the Relative Treatment. Wealth is defined as the current level of in-game currency and is instrumented for using its one period lag. All regressions include fixed effects on the lottery level and the subject level and exclude the first decision of each player. Standard errors, heteroscedasticity-robust and clustered on the subject level, are in parentheses. *, **, and *** indicate significance at the 10, 5, and 1 percent level, respectively
6 Discussion and relationship to previous literature
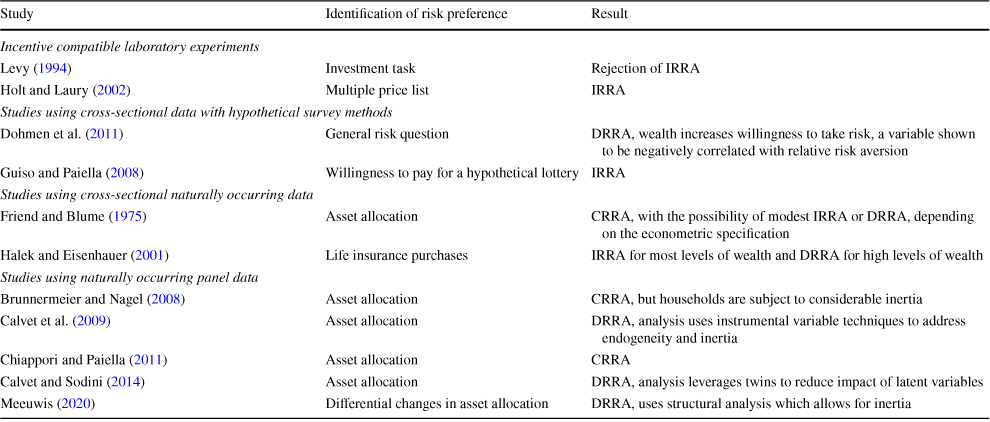
Decreasing absolute risk aversion is a consistent and well-established finding in the empirical literature. The main contribution of this paper is thus our evidence for decreasing relative risk aversion in a controlled and closed economic system. To consider how our findings relate to those of previous studies, we list a selection of them in Table 8. The table lists studies which analyze how relative risk aversion changes in wealth and focuses specifically on more recent work. Studies using experimental methods, represented here by Levy (Reference Levy1994) and Holt and Laury (Reference Holt and Laury2002), often come to inconsistent results. This is likely because it is unclear, which motive of risk aversion these studies actually elicit and to what extent wealth outside the laboratory is integrated into the subjects’ decisions. Studies using cross-sectional data, be they naturally occurring or from hypothetical surveys, have a hard time addressing potential endogeneity concerns and can be subject to omitted variable bias. In consequence, results across these studies are also not particularly consistent.
Table 8 Selection of previous studies analyzing the influence of wealth on relative risk aversion
|
Study |
Identification of risk preference |
Result |
|---|---|---|
|
Incentive compatible laboratory experiments |
||
|
Levy (Reference Levy1994) |
Investment task |
Rejection of IRRA |
|
Holt and Laury (Reference Holt and Laury2002) |
Multiple price list |
IRRA |
|
Studies using cross-sectional data with hypothetical survey methods |
||
|
Dohmen et al. (Reference Dohmen, Falk, Huffman, Sunde, Schupp and Wagner2011) |
General risk question |
DRRA, wealth increases willingness to take risk, a variable shown to be negatively correlated with relative risk aversion |
|
Guiso and Paiella (Reference Guiso and Paiella2008) |
Willingness to pay for a hypothetical lottery |
IRRA |
|
Studies using cross-sectional naturally occurring data |
||
|
Friend and Blume (Reference Friend and Blume1975) |
Asset allocation |
CRRA, with the possibility of modest IRRA or DRRA, depending on the econometric specification |
|
Halek and Eisenhauer (Reference Halek and Eisenhauer2001) |
Life insurance purchases |
IRRA for most levels of wealth and DRRA for high levels of wealth |
|
Studies using naturally occurring panel data |
||
|
Brunnermeier and Nagel (Reference Brunnermeier and Nagel2008) |
Asset allocation |
CRRA, but households are subject to considerable inertia |
|
Calvet et al. (Reference Calvet, Campbell and Sodini2009) |
Asset allocation |
DRRA, analysis uses instrumental variable techniques to address endogeneity and inertia |
|
Chiappori and Paiella (Reference Chiappori and Paiella2011) |
Asset allocation |
CRRA |
|
Calvet and Sodini (Reference Calvet and Sodini2014) |
Asset allocation |
DRRA, analysis leverages twins to reduce impact of latent variables |
|
Meeuwis (Reference Meeuwis2020) |
Differential changes in asset allocation |
DRRA, uses structural analysis which allows for inertia |
The table lists selected studies which analyze how relative risk aversion changes in wealth
Studies using naturally occurring panel data have an easier time correcting for endogeneity and omitted variable bias and, as a result, have been the focus of much of the recent literature. Because they use naturally occurring data, however, they are subject to a variety of measurement issues when it comes to the wealth of the studied individuals. What definition of wealth is used in the study often influences the result (Meeuwis, Reference Meeuwis2020). Also, as shown by Brunnermeier and Nagel (Reference Brunnermeier and Nagel2008), individuals can be subject to inertia, which complicates the econometric analysis. Recent studies by Calvet and Sodini (Reference Calvet and Sodini2014) and Calvet et al. (Reference Calvet, Campbell and Sodini2009) use high quality data on Swedish households and instrumental variable approaches to correct for inertia. They show a more consistent picture of decreasing relative risk aversion. Using an innovative approach of comparing reactions to different kinds of changes in wealth, Meeuwis (Reference Meeuwis2020) corroborates this finding.
Our result of decreasing relative risk aversion is thus consistent with findings from the most recent and best identified studies on naturally occurring data. We contribute to the literature by showing this finding in a wholly different setting. We observe decisions in a simulated and closed economic system. In our study, wealth can neither be transferred into the experiment nor out of the experiment which allows for a full observation of all relevant wealth in each decision situation. The setting also gives us significantly more control over the choice situation and can exclude certain caveats often encountered in previous studies. In this sense, our study is complementary to the previous literature.
Our study is also subject to some potential limitations. People play mobile games for their entertainment value. It thus might be the case that they are less risk averse in our setting than they are in real life. This is the reason why we do not analyze or interpret the observed levels of risk aversion. Rather, we are interested in the change of risk aversion in wealth. This change ought to be of equal direction in game and real-life settings. The use of in-game currency also potentially limits the external validity of our findings if the players did not value the currency. However, as we analyze in more detail above, players seem to value the currency and respond to the choice environment as would be expected in naturally occurring decisions concerning real wealth. Further, people are routinely willing to spend real money on virtual content comparable to what our players could buy in the game’s shop (Hamari and Keronen, Reference Hamari and Keronen2017; Hamari et al., Reference Hamari, Alha, Järvelä, Kivikangas, Koivisto and Paavilainen2017). The external validity of our results is also reinforced by their consistency with previous research.
7 Conclusions
The results of this study paint a consistent picture of absolute and relative risk aversion decreasing in wealth. This is true both when between player variation in wealth is considered and in our preferred empirical specification, which considers only within player changes in wealth. The finding is also robust to several alternative empirical specifications.
Theoretical researchers looking for guidance on assumptions regarding the change of risk aversion in wealth can reasonably assume DARA and DRRA to hold at least for the majority of decision-makers. This helps both in the development of theoretical models and in the interpretation of their results. Our results also have implications for empirical work. The consistent findings of DARA and DRRA invalidate the use of the two most commonly assumed parametric utility functions in model calibrations: exponential utility with increasing relative risk aversion and iso-elastic utility with constant relative risk aversion. It is nevertheless possible to use parametric assumptions which are consistent with our results. For example, the expo-power utility function of Saha (Reference Saha1993) can model both DARA and DRRA and thus offers a potential tool for research with parametric assumptions.
Our results also have direct implications for economic and financial decisions. Both for insurance companies and investment brokers, the finding of decreasing relative risk aversion gives guidance on how insurance or investment products should change with increasing customer wealth to be as attractive as possible for consumers. Similarly, how risk aversion changes in wealth has implications for optimal contract design where incentive effects often have to be traded off against the risk premium charged by agents (Chaigneau, Reference Chaigneau2013).
Lastly, our research can also be understood as a “calibration check” for implementing economic experiments in mobile game settings. Because our findings on the influence of wealth on risk aversion are in line with previous research on the topic, we provide evidence for the validity of our setting for economic analyses. The technique employed here can both enable researchers to examine questions which pose challenges for analyses in conventional settings (such as in this study), and support previous research in their results using higher (in-game) stakes and a less artificial environment for participants than often found in conventional laboratory experiments.
Supplementary Information
The online version contains supplementary material available at https://doi.org/10.1007/s10683-022-09762-x.
Acknowledgements
We are grateful to the influencer “Paluten” for promoting the video game analyzed in this paper on his YouTube channel. We thank Richard Butler, Benjamin Collier, Martin Halek, Glenn Harrison, Richard Peter, Marc Ragin, Casey Rothschild, Jörg Schiller, and Justin Sydnor for helpful discussions of the topic. Comments by two anonymous reviewers and the editor, John Duffy, greatly improved the quality of the paper. The study benefited from comments of seminar participants at the 2020 World Risk and Insurance Economics Congress, Temple University and LMU Munich. This study was pre-registered with the American Economic Association’s randomized controlled trial registry under ID AEARCTR-0005847. The replication material for the study is available at https://doi.org/10.7910/DVN/AHF8XB.
Funding
Open Access funding enabled and organized by Projekt DEAL. Funding was provided by the Verein zur Förderung der Versicherungswissenschaft in München e.V.
Declarations
Conflict of interest
The authors have no conflicts of interest or competing interests to report.


 hth
hth


 Open access