


1 Introduction
In recent years there has been an increasing attention to the importance of groups in understanding and explaining social capital, cooperation and well-being. For example, there is some evidence that membership in a group can affect subjects’ behavior in prisoner’s dilemma and battle of the sexes games (Charness et al. Reference Charness, Rigotti and Rustichini2007; Goette et al. Reference Goette, Huffman and Meier2006), in the public goods game (e.g., Tan and Bolle Reference Tan and Bolle2007), in bargaining settings (Hargreaves Heap and Varoufakis Reference Hargreaves Heap and Varoufakis2002; Zizzo Reference Zizzo2003), two person sequential games (Chen and Li Reference Chen and Li2009), trust games (Hargreaves Heap and Zizzo Reference Hargreaves Heap and Zizzo2009) and in coordination games (Chen and Chen Reference Chen and Chen2010). Intergroup bias forms naturally already with children (e.g., Sherif Reference Sherif1967; Files et al. Reference Files, Casey and Oleson2010), and group identification has been hypothesized to be a source of individual well-being (e.g., Akerlof and Kranton Reference Akerlof and Kranton2002); indeed, there is some neurobiological evidence that being a member of a group produces an endorphin rush (see Dunbar Reference Dunbar2006).
The starting point of this paper is that, almost pervasively, groups come in different relative sizes and/or social status. When there is discussion of ethnic conflict, for example, this is often phrased along the lines of majorities and minorities.Footnote 1 Similarly, perceptions of different social status are often perceived to accompany members of different groups:Footnote 2 for example, within an organization, members of a given team or of an ‘old boys and/or girls network’ being given status that other teams or those who are not in the elite network within the same organization do not have; or, more generally, Ivy League graduates vs. graduates from a local community college; or members of different castes in the traditional Hindu societal structure (BBC 2007). In some cases majority and minority status coincide with high and low status respectively: for example, domestic nationals versus perceived foreigners that are deemed of low status (e.g., Costello and Hodson Reference Costello and Hodson2011). Recent policy measures in both western Europe and United States have come under scrutiny for the extent to which they may hide, or institutionalize, intergroup discrimination by domestic nationals with respect to immigrant minorities made by foreign nationals.Footnote 3 In Japan, the segregation between the ordinary citizens who belonged to four recognized ranks (samurai warriors; farmers; artisans and trade people) and the minority outsiders were institutionalized in the sixteenth century. The discrimination against the outcast group still exists nowadays (Sugimoto Reference Sugimoto2003).
A key step in trying to understand the implications of groups for economies and organizations is then to look at how changing relative group size and/or changing group status affects trust and trustworthiness: this is what we do in this paper. Social identity theory would predict that subjects’ feelings of self-worth derive from being member of a group; low status group membership (or minority group membership insofar as it is perceived as low status) may be associated to lower self-evaluation (and hence psychological value) and to coping strategies that may include deferential behavior towards the high status (or majority) group (e.g. Turner Reference Turner1975; Tajfel and Turner Reference Tajfel, Turner, Hogg and Abrams2001). There is suggestive evidence that this is the case (e.g., Milner Reference Milner1975), but equally perceptions of minorities as low status may change as minorities develop better self-identities, e.g. with African Americans (Harris and Brown Reference Harris and Brown1971), making interpretation difficult. In empirical work respectively with U.S. and Indian data, Alesina et al. (Reference Alesina, Baqir and Easterly1999) and Banerjee et al. (Reference Banerjee, Somanathan and Iyer2005) show that social fragmentation can be negative for public good provision. One specific problem of interpretation is the extent to which though there is a causal link between social fragmentation and social welfare. There is also a question of how, for specific natural groups, results may depend on specific sets of stereotypes associated to the natural groups rather than apparent inter-group preferences, as Fershtman and Gneezy (Reference Fershtman and Gneezy2001) find in relation to the separation between Ashkenazic Jews and Eastern Jews (though with males only).Footnote 4 They may also depend on group-specific social norms (Berger et al. Reference Berger, Ho and Joshi2011) and preferences (Fehr et al. Reference Fehr, Hoff and Kshetramade2008). An experiment with artificial groups can then be ideally placed to identify the causal effect of having minority and low status groups independently of looking at the effect of the stereotypes, social norms and preferences associated to specific natural groups.
We do so such an experiment in the context of trust games, which is a natural stylized modeling setup for the operation of social capital. For example, in an organizational context, and as noted by Johnson and Mislin (Reference Johnson and Mislin2008), trust is recognized to raise efficiency by lower monitoring costs and turnover and by increasing uncompensated positive behavior from employees. These are normally seen as working in the direction of what Hargreaves Heap and Zizzo (Reference Hargreaves Heap and Zizzo2009; HHZ in what follows) label positive discrimination: i.e. greater trust and trustworthiness than what would be expected if there were no partitions of agents into groups.Footnote 5 There could also however be what HHZ label negative discrimination: i.e. lower trust and trustworthiness than what would be expected if there were no partitions of agents into groups. HHZ found evidence of negative discrimination in their trust game experiment, which suggests that the relationship between groups and social capital may be more complex than usually posited, at least in trust settings.Footnote 6
Our focus is on a simple, financially incentivized, deception-free behavioral experiment that implements our experimental treatment manipulations in a minimal way. We differ from experimental psychology research looking at relative group size and status effects as the latter’s focus is typically (a) on attitudes rather than behavior (e.g., Ellemers et al. Reference Ellemers, Doosje, Van Knippenberg and Wilke1992; Jost and Burgess Reference Jost and Burgess2000; Lücken and Simon Reference Lücken and Simon2005; Voci Reference Voci2006); (b) when behavior is involved, deception is systematically used in invoking the connection between responses and behavior (e.g., Sachdev and Bourhis Reference Sachdev and Bourhis1985, Reference Sachdev and Bourhis1991); (c) deception is more generally and systematically employed in treatment manipulations and elsewhere in the experimental design (e.g., all the studies listed under parts a and b). This is not to say that this psychological research is not useful: it clearly is; our aim is simply to complement it using an experimental economic methodology.Footnote 7 The early experimental research on in-group favoritism (e.g., Tajfel Reference Tajfel1970) is also relevant but more distant from what we do, since it neither distinguishes between positive and negative discrimination nor does it look at issues of group size and status.
Experiments with natural groups are less likely to employ deception (e.g., Aberson and Howanski’s, Reference Aberson and Howanski2002, attitudinal study), but, as noted above, once natural groups as opposed to artificial groups are introduced, the question arises of disentangling what we might label as the ‘pure’ effect of group membership and intergroup relations from what may be, and often plausibly are, expectations and stereotyping effects at play (e.g., Arifovic et al. Reference Arifovic, Friesen, Ludwig and Wright2012; Liebkind et al. Reference Liebkind, Henning-Lindblom and Solheim2008). This is what makes employing artificial groups desirable in a first step to identify the pure causal impact of relative size and status.
Our experimental design benchmark is from HHZ. To identify relative group size effects, all we do, relative to the random color group assignment treatment of HHZ, is to vary the group size from the two HHZ groups of 6 subjects each to having one group of 8 subjects and one group of 4 subjects.Footnote 8 We control for absolute group size effects by also having control treatments in which we either pair two groups of 4 subjects each or we pair two groups of 8 subjects each.Footnote 9 To identify status effects, all we do is to change the labeling frame we adopt in experimental sessions: rather than talking of a Blue group and a Red group (as we do in the other treatments, finding symmetrical results as HHZ do), we phrase the instructions in terms of a Blue group and in terms of subjects who are “not belonging to any group” or “outsiders to the group”. This is a minimal status group manipulation: that of being in a first group and that of being in a second group which is defined purely negatively by not being a member of the first group. Such a minimal status group manipulation arguably has the advantage of improving the interpretability of the results relative to stronger manipulations based on entitlements inducing quizzes and/or a public ceremony at the end of the experiment. Deservingness perceptions—as induced by quizzes - is an alternative obvious source of differential behavior (e.g., Hoffman and Spitzer Reference Hoffman and Spitzer1985), and public ceremonies may increase the likelihood of experimenter demand effects driving the results. The subtlety of our cue helps reduce the likelihood of experimenter demand effects; we use a variant of a Holt and Laury (Reference Holt and Laury2002) task as an extra control for whether such effects drive our results, and we find that they do not.Footnote 10 It also has external validity. This is because it mirrors the way in which sometimes low status is associated to being perceived as being outsiders to the high status groups, as the buraku are relative to the four recognized ranks of traditional Japanese society (Sugimoto, Reference Sugimoto2003).
To give a preview of key findings, there is evidence of comparatively low morale associated to low status and minority subjects. There is also evidence of deference, in different ways, towards high status and majority subjects respectively. The rest of this paper is organized as follows. Sections 2 and 3 present the experimental design and results, respectively. Section 4 discusses the results, while Sect. 5 concludes.
2 Experimental design
2.1 Outline and stage 1
The experiment was conducted in January and February 2010 at the University of East Anglia.Footnote 11 Other than for the experimental instructions, the experiment was computerized using the software z-Tree platform (Fischbacher Reference Fischbacher2007). Subjects were mostly students from various subject backgrounds. A total of 312 subjects participated in the 26 sessions. Subjects were randomly seated in the laboratory in partitioned computer terminals. Subjects read the instructions and answered a computerized control questionnaire, to check understanding, before moving on with the tasks. They were advised individually if they gave any incorrect answers. The experimental instructions had a neutral frame (e.g., did not refer to ‘trust’, ‘trusters’ or ‘trustees’) except for the context manipulations specified below. We used ‘experimental points’ as currency, each worth 4 UK pence (0.04 pounds).
We had three key experimental treatments, each with two groups per session: two groups frame, one with a majority of 8 subjects and the other with a minority of 4 subjects (84); one group frame, with the majority group of 8 being labeled as ‘the group’ engaging with 4 outsiders (S4); one group frame, with the minority group of 4 being labeled as ‘the group’ engaging with 8 outsiders (S8). As controls for the analysis, we also ran two additional treatments: two groups frame of 8 subjects (88); two groups frame of 4 subjects (44); and we also relied on the no groups (B) and the two groups of 6 subjects each with equal frequencies to play with the same and other group members (66) treatments reported in HHZ.Footnote 12
At the start of the experiment subjects were randomly assigned to one of two groups, to be made of either 4 or 8 subjects depending on the treatment, and this was common knowledge. In two groups frame treatments, the groups were labeled the Red group and the Blue group.Footnote 13 In the one group frame treatments, there are a Blue group and four or eight Not Blue subjects (depending on the treatment) who in the instructions are referred to as “not belonging to any group” or “outsiders to the group”.
Our key experimental treatments are those looking at majorities, minorities and difference in status: 84, S4 and S8. 84 considers the effect of having a majority and a minority framed as providing two group identities of equal status except for the potential implications of being a majority group or a minority group. S4 and S8 consider the effect of differential status by having a single group labeled as such, as discussed in the introduction and further in Sect. 4. In S4, the majority group of 8 is the high status (Blue), framed group and the group of 4 is the unlabeled, low status group (Not Blue); in S8, the minority group of 4 is the high status, framed group and the group of 8 is the low status group.
Any difference in behavior from being in the majority or in the minority may however not be due to any majority-minority effect (whether or not combined with a 1 group frame effect) but rather to the absolute size of the group (4 or 8 subjects). In 44 and 88 there are no majorities and minorities, but by having groups of 4 (in 44) and of 8 (in 88) we are able to control for absolute group size effects. 44 and 88 do however change the absolute number of people participating to each experimental session (8 and 16, respectively, relative to the 12 of the other treatments), and to control for this as well we can employ the experimental data from 66 in HHZ. Finally, there is a question about what would happen if there were no groups, and the B treatment from HHZ provides such a useful baseline.
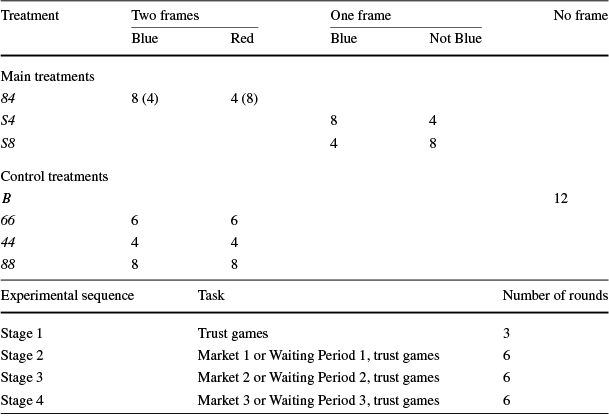
Each session was divided into four stages plus four additional behavioral tasks, and the overall experimental sequence and set of treatments is summarized in Table 1.
Table 1 Experimental treatments and experimental sequence
|
Treatment |
Two frames |
One frame |
No frame |
||
|---|---|---|---|---|---|
|
Blue |
Red |
Blue |
Not Blue |
||
|
Main treatments |
|||||
|
84 |
8 (4) |
4 (8) |
|||
|
S4 |
8 |
4 |
|||
|
S8 |
4 |
8 |
|||
|
Control treatments |
|||||
|
B |
12 |
||||
|
66 |
6 |
6 |
|||
|
44 |
4 |
4 |
|||
|
88 |
8 |
8 |
|||
|
Experimental sequence |
Task |
Number of rounds |
|---|---|---|
|
Stage 1 |
Trust games |
3 |
|
Stage 2 |
Market 1 or Waiting Period 1, trust games |
6 |
|
Stage 3 |
Market 2 or Waiting Period 2, trust games |
6 |
|
Stage 4 |
Market 3 or Waiting Period 3, trust games |
6 |
Notes: In the top two panels, the number of subjects in each group (or everyone in the experimental session, for the B treatment) is listed (in the 84 treatment, either the Blue group has 8 subjects and the Red group 4 subjects, or vice versa). Regarding the bottom panel, at the start of each of stages 2, 3, and 4, the experiment had a waiting period in the B treatment, and markets for group(s) in the 66, 88, 44, 84, S8 and S4 treatments (technically, there were two markets, one to pay for membership of each of the two groups)
2.2 Stage 1
Stage 1 had three rounds of a Berg et al. (Reference Berg, Dickhaut and McCabe1995) basic trust game and was common to all treatments. It aimed to provide subjects practice and experience with trust games. The truster (the ‘First Mover’) received 24 experimental points and chose how many points (if any) to give to the other person and how many (if any) to keep. All the points given were multiplied by a conversion rate of 3 before they were received by the trustee (the ‘Second Mover’). The trustee then decided how much (if any) to keep and how much (if any) to return to the truster. Subjects were matched randomly and anonymously each round.Footnote 14 The only information they received was about their round co-player’s decision and about their own round earnings; in treatments with groups, they had no information about the color group of co-players.
2.3 Stages 2 through 4
Trust games
In stages 2, 3 and 4 subjects played six trust games as in stage 1, but with the following differences. Each round trusters were allocated 48 points rather than the 24 of stage 1. In each round they were randomly matched with another participant in the room, and informed whether the co-player belonged to the Blue group or to the Red group or to no group, though they were not told their identity. They were assigned three times the role of trusters and three times that of trustees. They were provided, on a round-by-round basis, with a table containing information on average giving rates and average return rates by members of each group (or “not belonging to any group”) with respect to insiders and outsiders.Footnote 15 In addition, they received a summary table with average giving and return rates for each stage from the second onwards by members of each group with respect to insiders and outsiders.
Market for groups phase
Before stages 2, 3 and 4 of the trust games were played, there was a market for groups as in HHZ. Subjects had an endowment of 48 points. In the two groups frame treatments, they were first asked to state whether, if they could choose and both options were free, they would rather stay in their group or switch to the other. If he or she stated they would rather switch, then they became a potential buyer for the membership of the other group and they were asked how much they were willing to pay to swap places with a member of the other group. They could state any value between 0 and 48 points, the value of their endowment. If the subjects stated they would rather stay, they became a potential seller of group membership and were asked to state how much they would need to be paid by a member of the other group in order to swap places, again with an upper limit of 48 points. Subjects could also state that they were not willing to switch group at any price within the allowed range (0 to 48 points).
The one group frame treatments were identical in structure but the instructions were framed in terms of being in or out of the Blue group. For all treatments, the market then operated as a Walrasian clearinghouse, where the price was set so that the number of sellers was equal to the number of buyers of membership of the other group. Whenever there was a range of possible market-clearing prices, the lowest market-clearing price was chosen. As in HHZ, the mechanism only operated by swapping players between groups, so that each group remained with the same number of subjects throughout the experiment.Footnote 16
2.4 End of experiment tasks
At the end of the experiment we had four behavioral tasks presented in randomized order and aimed to try to measure risk aversion, loss aversion, ambiguity aversion and sensitivity to experimenter demand.Footnote 17 They corresponded to (a) a standard Holt and Laury (Reference Holt and Laury2002) questionnaire in the domain of gains; (b) an equivalent task in the domain of losses; (c) an ambiguity aversion task; and (d) a sensitivity to experimenter demand task. The tasks details are provided in the experimental instructions. The number of times subjects choose the safer option can be taken as a measure of risk attitude in task a. Task b consisted in a set of choices between risky options as in a, but framed in terms of losses rather than in gains; we combine task a choices of the safer option with task b choices of the riskier option to get a proxy for degree of loss aversion.Footnote 18 Task c followed the lead of Engle-Warnick and Laszlo (Reference Engle-Warnick and Laszlo2006) and offered a choice between an increasingly ambiguous lottery and the same lottery disambiguated but at a price in terms of lower expected value. The number of times subjects went for the unambiguous measure can be used as a measure of ambiguous aversion.
Task d presented an option between two lottery choices, one increasingly dominated by the other; the dominated option was characterized by a smiley face and a sentence stating that “it would be nice if some of you were to choose” such an option. The nudge provided towards choosing the dominated lotteries was significant by the standard of what we know about experimenter demand effects (see Zizzo Reference Zizzo2010), abbreviated as EDE in what follows, with the smiley face providing a social cue to interpret the sentence being provided. It provided a clear cue for subjects to behave in a way compliant to experimenter demand, even when they need to pay money to do so, and as such it is a measure of sensitivity to EDE.Footnote 19 It is not just a generic measure of conformism since the nudge clearly comes from the experimenter. As a result, we measure the degree of EDE sensitivity as the number of dominated options choices being made. Zizzo and Fleming (Reference Zizzo and Fleming2011) used a psychological questionnaire instrument and a combination of a dictator and money burning game as alternative measures to capture EDE sensitivity; relative to the first measure, our Holt and Laury variant measure had the advantage of providing an incentivized measure; relative to the second measure, and given the interpersonal nature of our experiment and potential spillovers across tasks, it had the advantage of not involving actions affecting other subjects in the experiment.
2.5 Payments
Each session lasted around 75 minutes. The average earnings were 14.39 UK pounds per subject (approximately 22–23 US dollars). Payment was based on the earnings from each of the markets; plus those from a randomly chosen round from each of the four stages; plus those from one of the ten choices for each of the end of experiment tasks, with any relevant lottery being played out by the computer. Subjects were privately paid and left the laboratory one at a time in an order designed to minimize the likelihood of seeing each other.
2.6 Relationship to baseline treatments from HHZ
The 66 treatment was identical in stages 1 through 4 structure to that of our experimental treatments under a two groups frame, with the key difference being that there were two groups of six subjects.Footnote 20
The B treatment had 12 subjects per session as the 66, 84, S8 and S4 treatments. There was no assignment to groups. Stage 1 was identical to stage 1 of the other treatments. Stages 2, 3 and 4 had no market for groups. In its place, at the beginning of each of stages 2, 3 and 4, there was a two minutes waiting period, at the start of which subjects were paid an additional 48 points. This was meant to mirror the other treatments, both by providing the same money amounts and by creating a temporal wedge between trust game tasks. Stage 2, 3 and 4 trust games were as in the other treatments, to mirror the information provided in stages 2, 3 and 4 of the other treatments, the computer screen displayed information on average giving rate and average return rate, with a summary table on average giving and return rates from stage 2 onwards being provided at the end of each stage. None of the HHZ treatments tried to control for risk aversion, loss aversion, ambiguity aversion and experimenter demand sensitivity by the means of end of experiment tasks.
3 Experimental results
3.1 Giving and return ratesFootnote 21
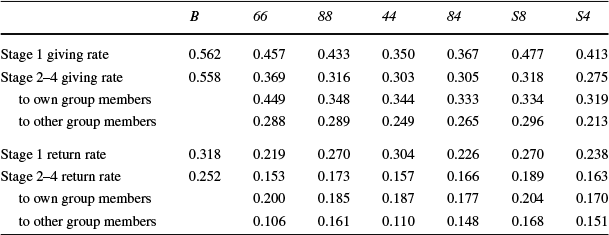
We define the giving rate as the fraction of the endowment given by trusters to trustees, and the return rate as the fraction of the amount received by trusters which is returned by the trustees to the trusters (where the amount received by trustees is 3 times what was given in all treatments).
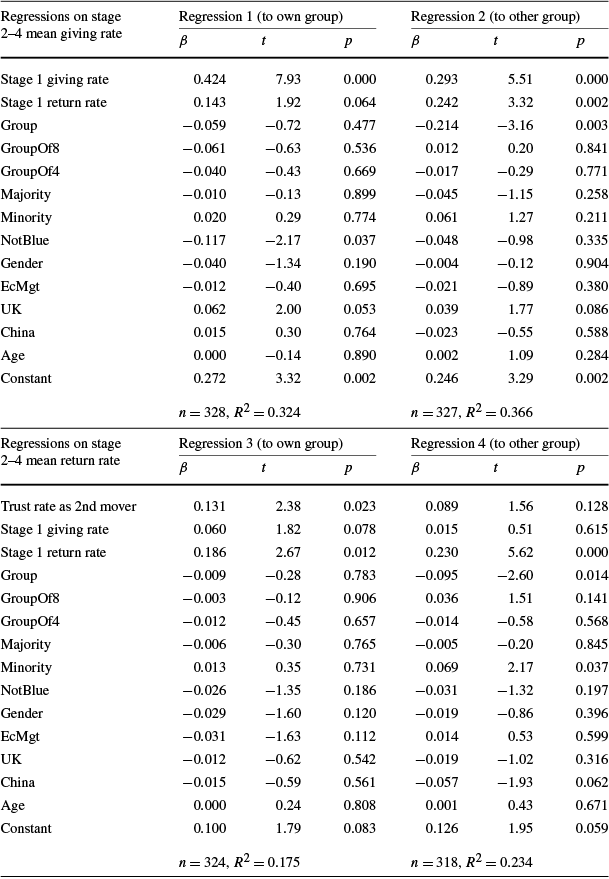
Figure 1 displays giving and return rates in the key treatments (84, S8 and S4) highlighting the role of majorities, minorities and one group framing.Footnote 22 Table 2 displays giving and return rates across stages in all treatments, including the various controls. Table 3 employs regression analysis on mean Stage 2–4 giving and return rate by each subject to verify treatment effects and the role of possible covariates.
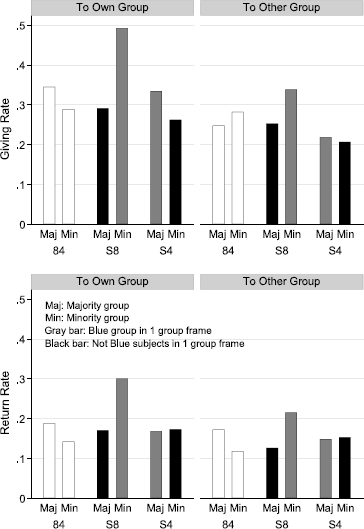
Fig. 1 Giving and return rates in Stages 2–4
Table 2 Giving and return rates
|
B |
66 |
88 |
44 |
84 |
S8 |
S4 |
|
|---|---|---|---|---|---|---|---|
|
Stage 1 giving rate |
0.562 |
0.457 |
0.433 |
0.350 |
0.367 |
0.477 |
0.413 |
|
Stage 2–4 giving rate |
0.558 |
0.369 |
0.316 |
0.303 |
0.305 |
0.318 |
0.275 |
|
to own group members |
0.449 |
0.348 |
0.344 |
0.333 |
0.334 |
0.319 |
|
|
to other group members |
0.288 |
0.289 |
0.249 |
0.265 |
0.296 |
0.213 |
|
|
Stage 1 return rate |
0.318 |
0.219 |
0.270 |
0.304 |
0.226 |
0.270 |
0.238 |
|
Stage 2–4 return rate |
0.252 |
0.153 |
0.173 |
0.157 |
0.166 |
0.189 |
0.163 |
|
to own group members |
0.200 |
0.185 |
0.187 |
0.177 |
0.204 |
0.170 |
|
|
to other group members |
0.106 |
0.161 |
0.110 |
0.148 |
0.168 |
0.151 |
Table 3 Regressions on mean giving and return rate
|
Regressions on stage 2–4 mean giving rate |
Regression 1 (to own group) |
Regression 2 (to other group) |
||||
|---|---|---|---|---|---|---|
|
β |
t |
p |
β |
t |
p |
|
|
Stage 1 giving rate |
0.424 |
7.93 |
0.000 |
0.293 |
5.51 |
0.000 |
|
Stage 1 return rate |
0.143 |
1.92 |
0.064 |
0.242 |
3.32 |
0.002 |
|
Group |
−0.059 |
−0.72 |
0.477 |
−0.214 |
−3.16 |
0.003 |
|
GroupOf8 |
−0.061 |
−0.63 |
0.536 |
0.012 |
0.20 |
0.841 |
|
GroupOf4 |
−0.040 |
−0.43 |
0.669 |
−0.017 |
−0.29 |
0.771 |
|
Majority |
−0.010 |
−0.13 |
0.899 |
−0.045 |
−1.15 |
0.258 |
|
Minority |
0.020 |
0.29 |
0.774 |
0.061 |
1.27 |
0.211 |
|
NotBlue |
−0.117 |
−2.17 |
0.037 |
−0.048 |
−0.98 |
0.335 |
|
Gender |
−0.040 |
−1.34 |
0.190 |
−0.004 |
−0.12 |
0.904 |
|
EcMgt |
−0.012 |
−0.40 |
0.695 |
−0.021 |
−0.89 |
0.380 |
|
UK |
0.062 |
2.00 |
0.053 |
0.039 |
1.77 |
0.086 |
|
China |
0.015 |
0.30 |
0.764 |
−0.023 |
−0.55 |
0.588 |
|
Age |
0.000 |
−0.14 |
0.890 |
0.002 |
1.09 |
0.284 |
|
Constant |
0.272 |
3.32 |
0.002 |
0.246 |
3.29 |
0.002 |
|
n=328, R 2=0.324 |
n=327, R 2=0.366 |
|||||
|
Regressions on stage 2–4 mean return rate |
Regression 3 (to own group) |
Regression 4 (to other group) |
||||
|---|---|---|---|---|---|---|
|
β |
t |
p |
β |
t |
p |
|
|
Trust rate as 2nd mover |
0.131 |
2.38 |
0.023 |
0.089 |
1.56 |
0.128 |
|
Stage 1 giving rate |
0.060 |
1.82 |
0.078 |
0.015 |
0.51 |
0.615 |
|
Stage 1 return rate |
0.186 |
2.67 |
0.012 |
0.230 |
5.62 |
0.000 |
|
Group |
−0.009 |
−0.28 |
0.783 |
−0.095 |
−2.60 |
0.014 |
|
GroupOf8 |
−0.003 |
−0.12 |
0.906 |
0.036 |
1.51 |
0.141 |
|
GroupOf4 |
−0.012 |
−0.45 |
0.657 |
−0.014 |
−0.58 |
0.568 |
|
Majority |
−0.006 |
−0.30 |
0.765 |
−0.005 |
−0.20 |
0.845 |
|
Minority |
0.013 |
0.35 |
0.731 |
0.069 |
2.17 |
0.037 |
|
NotBlue |
−0.026 |
−1.35 |
0.186 |
−0.031 |
−1.32 |
0.197 |
|
Gender |
−0.029 |
−1.60 |
0.120 |
−0.019 |
−0.86 |
0.396 |
|
EcMgt |
−0.031 |
−1.63 |
0.112 |
0.014 |
0.53 |
0.599 |
|
UK |
−0.012 |
−0.62 |
0.542 |
−0.019 |
−1.02 |
0.316 |
|
China |
−0.015 |
−0.59 |
0.561 |
−0.057 |
−1.93 |
0.062 |
|
Age |
0.000 |
0.24 |
0.808 |
0.001 |
0.43 |
0.671 |
|
Constant |
0.100 |
1.79 |
0.083 |
0.126 |
1.95 |
0.059 |
|
n=324, R 2=0.175 |
n=318, R 2=0.234 |
|||||
Notes: We employ error clustering to control for session level effects
Regressions 1 and 2 refer to giving rates when subjects play with own and other group members respectively. Regressions 3 and 4 are on return rates. In the regressions, error clustering is used to take into account the possible non-independence of observations by different subjects in the same session.Footnote 23 We have treatment dummies for Group (=1 in all treatments except B), GroupOf8 and GroupOf4 (=1 if subject belongs to group of 8 subjects or 4 subjects, respectively), Majority (=1 if subject belongs to strict majority), Minority (=1 if subject belongs to strict minority) and NotBlue (=1 if subject is in the low status framed group). The return rate regressions have Giving Rate received as the Second Mover as an independent variable: that is, the mean stages 2–4 giving rate the subject has received when playing as a trustee. This allows us to control for the positive relationship which we might expect between giving rate and return rate. Both giving and return rate regressions control for Stage 1 giving and return rates.Footnote 24 Various dummy variables capture individual-specific heterogeneity: stage 1 giving and return rate, age, and dummies for gender (=1 for women), economics or management educational background (=1 if applicable) and nationality (UK=1 for UK subjects and China=1 for Chinese subjects).
Result 1
Low status subjects trust less other low status subjects.
Support
Figure 1 is suggestive of this result as trust rates from low status subjects to other low status subjects appear lower than trust rates from high status subjects to other high status subjects in both S8 and S4. According to Regression 1, low status (Not Blue) subjects give 12 percentage points less to other low status subjects (P=0.037). Figure 1 clearly shows, in relation to one frame treatment sessions, that Not Blue subjects give less to other Not Blue subjects. While Blue trusters gave 40.6 % of their endowment to other Blue trusters, Not Blue trusters only gave 26.2 % of their endowment (Wilcoxon P=0.028) in the 10 sessions of S8 and S4 treatments.
Result 2
Controlling for covariates, minority subjects return more to majority subjects.
Support
Regression 4 in Table 3 shows that minority subjects have a higher return rate (by 7 percentage points) towards majority subjects, and this is statistically significant (P=0.037). Among the key treatments, Fig. 1 shows that this result is not apparent from 84 and S4 and appears to be driven by treatment S8, where the minority subjects are also the low status group.
Other results
Overall, there remains evidence for negative discrimination both in giving rates and in return rates. We could not find any statistically significant change in discrimination in either giving or return rates across rounds in different treatments.Footnote 25 Regressions 1 and 3 in Table 3 show that the introduction of groups per se does not increase giving and return rates to same group members; the coefficients are actually negative, albeit statistically insignificant. Regressions 2 and 4 show that, when controlling for a number of covariates including (in relation to return rates) behavioral reciprocity, the introduction of groups decreases giving rates to the other group members by around 20 percentage points and return rates by around 9 percentage points. Clearly, when it comes to majority and high status subjects, there is no reason to expect anything other than negative discrimination. We also could not find any statistically significant change in discrimination in either giving or return rates across rounds in different treatments.Footnote 26
In Table 3, discrimination in giving rate is defined (as in HHZ) as giving rate (stages 2–4) in group treatments minus giving rate (stages 2–4) in B treatment (similarly for the return rate). An alternative measure would be to consider [giving rate (stages 2–4) − giving rate (stage 1) in group treatments] minus [giving rate (stages 2–4) − giving rate (stage 1) in B treatment]. A parallel measure could be construed for the return rate.Footnote 27 A difficulty with these measures is that they do not prevent the possibility that in stage 1 of the group treatments giving and return rates may already be affected by the expectation of interaction with non-group members, which may lead subjects prone to negative group discrimination to already lower their giving and return rate in stage 1. The comparatively low giving rate and return rate already in stage 1 of the groups treatments, relative to the B treatment, is at least consistent with this possibility.Footnote 28 Nevertheless, even if these alternative measures are used, the finding on negative discrimination remains is replicated, at least in relation to giving rates (see online Appendix B).
Our regression analysis in Table 3 controls for absolute group size effects and finds no evidence for them as GroupOf8 and GroupOf4 are statistically insignificant in all regressions of Table 3. A cursory look at Table 2 confirms this view, with giving and return rates in 44, 66 and 88 being similar and with no trend upwards or downwards based on group size.
Among the other covariates of Table 3, there is evidence of a relationship between giving and return rate in Regressions 1, 2 and 3, though less so in Regression 4 (P=0.064, one tailed). There is also various (though not universal) evidence of dependence on giving and/or return rates in stage 1, which may be due to a combination of individual characteristics and learning dynamics.Footnote 29
3.2 Perceived values and discrimination
We now focus on the treatments with groups. This is (a) to try to get an understanding about whether subjects value groups equally depending on whether they are majority or minority groups, or whether they are framed as not belonging to any group at all; and (b) to get a better understanding of discrimination using perceived value information and, in the subset of experimental treatments that we ran (and so excluding 66 from HHZ), information from the end of experiment tasks.
Perceived value measurement
We measure perceived value subjects placed on own group membership by the extent to which subjects place a value on own group membership in excess of its material value. The markets at the start of stages 2, 3 and 4 provided an incentive-compatible mechanism for the revelation of individual preferences for staying in one’s own group (the willingness to accept, WTA, value) or for switching groups (the willingness to pay, WTP, value). As there were repeated markets, subjects also had the opportunity to gain experience both about the nature of the social commodity being traded (i.e. membership of a given group) and about the market mechanism itself.Footnote 30
WTA(own) is the positive price a subject needed to be paid to be willing to switch and WTP(own) is equivalent to a negative price on own group membership, and so they reveal the value that an individual places on membership of his or her group. Figure 2 provides information on WTA and WTP values observed in the experiment.
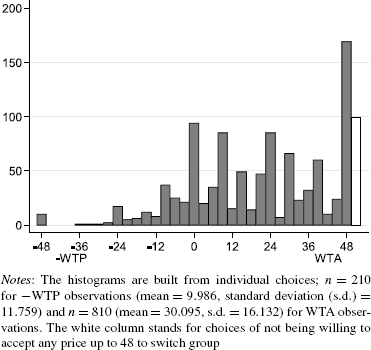
Fig. 2 Histogram of willingness to pay (WTP) and willingness to accept (WTA) in relation to the other group
We use HHZ’s simple perceived value measure M as equal for each subject and market to WTA(own) or—WTP(own), whichever is the case.Footnote 31 All of our experimental treatments, and 66 from HHZ, are such that group membership does not imply, either directly or in terms of frequency of interaction, a financial advantage in being inside rather than outside a group. It is possible, however, that, if subjects find that one group is more profitable than another in terms of actual history of trust and trustworthiness with respect to the two groups, this may affect group valuations. We address this endogeneity problem by including regression analysis with stage 2 psychological values as dependent variable, as stage 2 valuations are provided before any feedback is received on within-group and between-group performance.Footnote 32
Another problem with the average M measure of the mean psychological benefit from own group membership is that subjects could state that they were not willing to lose their membership at any allowed price between 0 and 48 points. 9.5 % of the choices were of this ‘definite stay’ kind (between 5.6 and 13.4 % in different treatments). We chose two routes to deal with this problem. M contains all observations, but conservatively introduces a valuation of 49 for these definite stays: since the lower bound for valuations was—48 (the budget), if anything, for x>49, this introduces a downward bias. Mb simply omits ‘definite stay’ observations and also introduces a downward bias in average M estimates. Either way, in the light of possible downward biases, our average M estimates should be interpreted as conservative estimates of the revealed perceived values of own group membership.
Results on perceived values
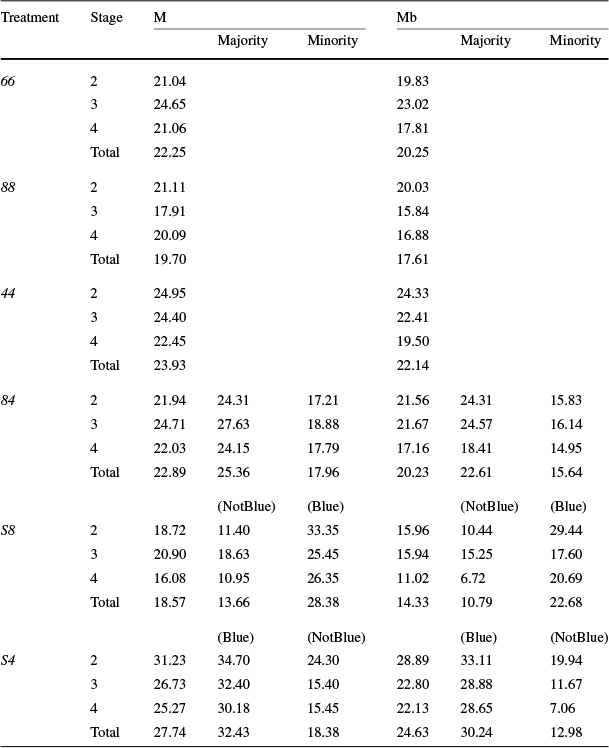
Table 4 presents M and Mb mean values by treatment, while Fig. 3 illustrates mean M and Mb values graphically focusing on our key treatments 84, S8 and S4.Footnote 33
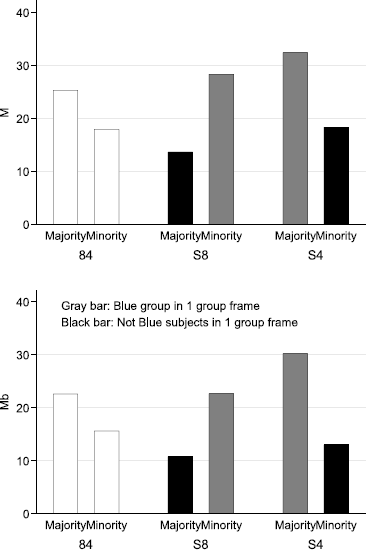
Fig. 3 Mean psychological values
Table 4 Mean psychological values
|
Treatment |
Stage |
M |
Mb |
||||
|---|---|---|---|---|---|---|---|
|
Majority |
Minority |
Majority |
Minority |
||||
|
66 |
2 |
21.04 |
19.83 |
||||
|
3 |
24.65 |
23.02 |
|||||
|
4 |
21.06 |
17.81 |
|||||
|
Total |
22.25 |
20.25 |
|||||
|
88 |
2 |
21.11 |
20.03 |
||||
|
3 |
17.91 |
15.84 |
|||||
|
4 |
20.09 |
16.88 |
|||||
|
Total |
19.70 |
17.61 |
|||||
|
44 |
2 |
24.95 |
24.33 |
||||
|
3 |
24.40 |
22.41 |
|||||
|
4 |
22.45 |
19.50 |
|||||
|
Total |
23.93 |
22.14 |
|||||
|
84 |
2 |
21.94 |
24.31 |
17.21 |
21.56 |
24.31 |
15.83 |
|
3 |
24.71 |
27.63 |
18.88 |
21.67 |
24.57 |
16.14 |
|
|
4 |
22.03 |
24.15 |
17.79 |
17.16 |
18.41 |
14.95 |
|
|
Total |
22.89 |
25.36 |
17.96 |
20.23 |
22.61 |
15.64 |
|
|
(NotBlue) |
(Blue) |
(NotBlue) |
(Blue) |
||||
|
S8 |
2 |
18.72 |
11.40 |
33.35 |
15.96 |
10.44 |
29.44 |
|
3 |
20.90 |
18.63 |
25.45 |
15.94 |
15.25 |
17.60 |
|
|
4 |
16.08 |
10.95 |
26.35 |
11.02 |
6.72 |
20.69 |
|
|
Total |
18.57 |
13.66 |
28.38 |
14.33 |
10.79 |
22.68 |
|
|
(Blue) |
(NotBlue) |
(Blue) |
(NotBlue) |
||||
|
S4 |
2 |
31.23 |
34.70 |
24.30 |
28.89 |
33.11 |
19.94 |
|
3 |
26.73 |
32.40 |
15.40 |
22.80 |
28.88 |
11.67 |
|
|
4 |
25.27 |
30.18 |
15.45 |
22.13 |
28.65 |
7.06 |
|
|
Total |
27.74 |
32.43 |
18.38 |
24.63 |
30.24 |
12.98 |
|
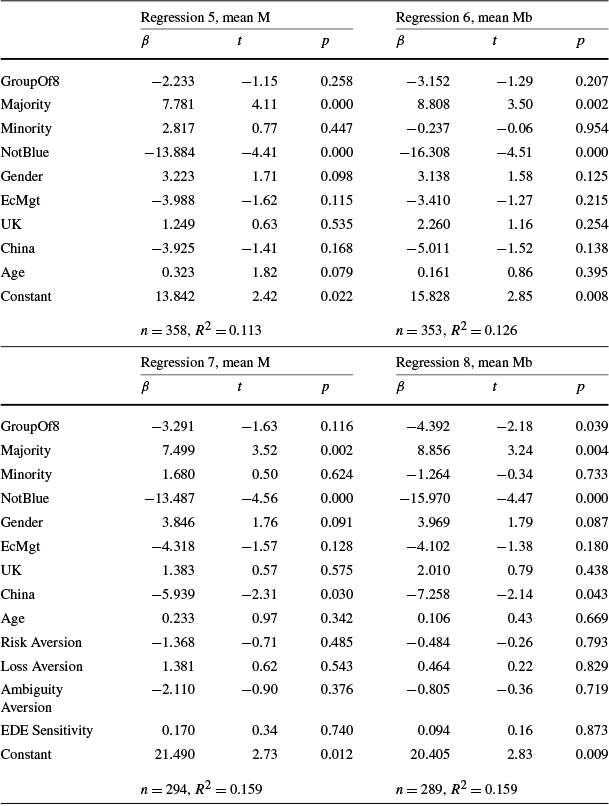
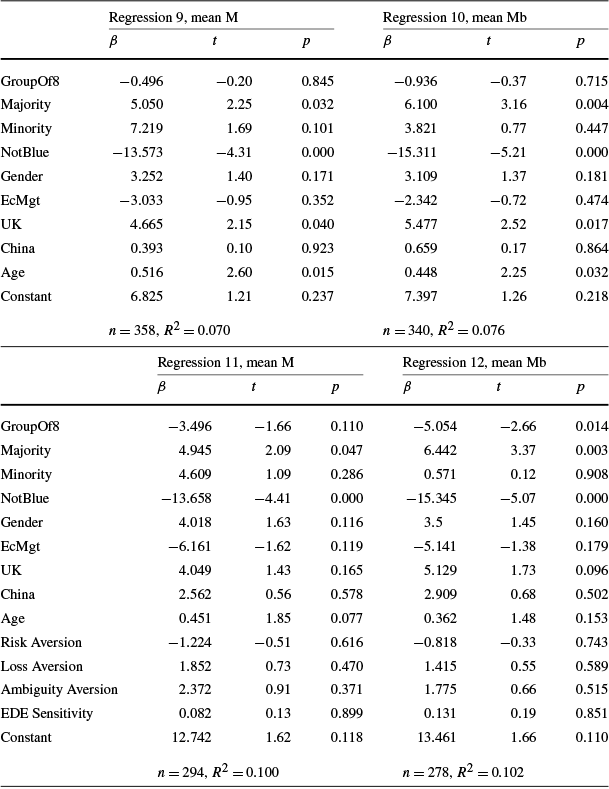
Figure 3 makes clear that for all groups in 84, S8 and S4, including those framed as outsiders, the perceived value is positive.Footnote 34 To investigate the determinants of perceived values, we present some regression analysis on M (Regressions 5 and 7) and Mb (Regressions 6 and 8) in Table 5, again controlling for possible session level specific effects by using error clustering; Table 6 has the corresponding regressions with just stage 2 M (Regressions 9 and 11) and Mb (Regressions 10 and 12) as dependent variables.Footnote 35
Table 5 Regressions on psychological value
|
Regression 5, mean M |
Regression 6, mean Mb |
|||||
|---|---|---|---|---|---|---|
|
β |
t |
p |
β |
t |
p |
|
|
GroupOf8 |
−2.233 |
−1.15 |
0.258 |
−3.152 |
−1.29 |
0.207 |
|
Majority |
7.781 |
4.11 |
0.000 |
8.808 |
3.50 |
0.002 |
|
Minority |
2.817 |
0.77 |
0.447 |
−0.237 |
−0.06 |
0.954 |
|
NotBlue |
−13.884 |
−4.41 |
0.000 |
−16.308 |
−4.51 |
0.000 |
|
Gender |
3.223 |
1.71 |
0.098 |
3.138 |
1.58 |
0.125 |
|
EcMgt |
−3.988 |
−1.62 |
0.115 |
−3.410 |
−1.27 |
0.215 |
|
UK |
1.249 |
0.63 |
0.535 |
2.260 |
1.16 |
0.254 |
|
China |
−3.925 |
−1.41 |
0.168 |
−5.011 |
−1.52 |
0.138 |
|
Age |
0.323 |
1.82 |
0.079 |
0.161 |
0.86 |
0.395 |
|
Constant |
13.842 |
2.42 |
0.022 |
15.828 |
2.85 |
0.008 |
|
n=358, R 2=0.113 |
n=353, R 2=0.126 |
|||||
|
Regression 7, mean M |
Regression 8, mean Mb |
|||||
|---|---|---|---|---|---|---|
|
β |
t |
p |
β |
t |
p |
|
|
GroupOf8 |
−3.291 |
−1.63 |
0.116 |
−4.392 |
−2.18 |
0.039 |
|
Majority |
7.499 |
3.52 |
0.002 |
8.856 |
3.24 |
0.004 |
|
Minority |
1.680 |
0.50 |
0.624 |
−1.264 |
−0.34 |
0.733 |
|
NotBlue |
−13.487 |
−4.56 |
0.000 |
−15.970 |
−4.47 |
0.000 |
|
Gender |
3.846 |
1.76 |
0.091 |
3.969 |
1.79 |
0.087 |
|
EcMgt |
−4.318 |
−1.57 |
0.128 |
−4.102 |
−1.38 |
0.180 |
|
UK |
1.383 |
0.57 |
0.575 |
2.010 |
0.79 |
0.438 |
|
China |
−5.939 |
−2.31 |
0.030 |
−7.258 |
−2.14 |
0.043 |
|
Age |
0.233 |
0.97 |
0.342 |
0.106 |
0.43 |
0.669 |
|
Risk Aversion |
−1.368 |
−0.71 |
0.485 |
−0.484 |
−0.26 |
0.793 |
|
Loss Aversion |
1.381 |
0.62 |
0.543 |
0.464 |
0.22 |
0.829 |
|
Ambiguity Aversion |
−2.110 |
−0.90 |
0.376 |
−0.805 |
−0.36 |
0.719 |
|
EDE Sensitivity |
0.170 |
0.34 |
0.740 |
0.094 |
0.16 |
0.873 |
|
Constant |
21.490 |
2.73 |
0.012 |
20.405 |
2.83 |
0.009 |
|
n=294, R 2= 0.159 |
n=289, R 2= 0.159 |
|||||
Notes: We employ error clustering to control for session level effects
Table 6 Regressions on Stage 2 psychological value
|
Regression 9, mean M |
Regression 10, mean Mb |
|||||
|---|---|---|---|---|---|---|
|
β |
t |
p |
β |
t |
p |
|
|
GroupOf8 |
−0.496 |
−0.20 |
0.845 |
−0.936 |
−0.37 |
0.715 |
|
Majority |
5.050 |
2.25 |
0.032 |
6.100 |
3.16 |
0.004 |
|
Minority |
7.219 |
1.69 |
0.101 |
3.821 |
0.77 |
0.447 |
|
NotBlue |
−13.573 |
−4.31 |
0.000 |
−15.311 |
−5.21 |
0.000 |
|
Gender |
3.252 |
1.40 |
0.171 |
3.109 |
1.37 |
0.181 |
|
EcMgt |
−3.033 |
−0.95 |
0.352 |
−2.342 |
−0.72 |
0.474 |
|
UK |
4.665 |
2.15 |
0.040 |
5.477 |
2.52 |
0.017 |
|
China |
0.393 |
0.10 |
0.923 |
0.659 |
0.17 |
0.864 |
|
Age |
0.516 |
2.60 |
0.015 |
0.448 |
2.25 |
0.032 |
|
Constant |
6.825 |
1.21 |
0.237 |
7.397 |
1.26 |
0.218 |
|
n=358, R 2=0.070 |
n=340, R 2=0.076 |
|||||
|
Regression 11, mean M |
Regression 12, mean Mb |
|||||
|---|---|---|---|---|---|---|
|
β |
t |
p |
β |
t |
p |
|
|
GroupOf8 |
−3.496 |
−1.66 |
0.110 |
−5.054 |
−2.66 |
0.014 |
|
Majority |
4.945 |
2.09 |
0.047 |
6.442 |
3.37 |
0.003 |
|
Minority |
4.609 |
1.09 |
0.286 |
0.571 |
0.12 |
0.908 |
|
NotBlue |
−13.658 |
−4.41 |
0.000 |
−15.345 |
−5.07 |
0.000 |
|
Gender |
4.018 |
1.63 |
0.116 |
3.5 |
1.45 |
0.160 |
|
EcMgt |
−6.161 |
−1.62 |
0.119 |
−5.141 |
−1.38 |
0.179 |
|
UK |
4.049 |
1.43 |
0.165 |
5.129 |
1.73 |
0.096 |
|
China |
2.562 |
0.56 |
0.578 |
2.909 |
0.68 |
0.502 |
|
Age |
0.451 |
1.85 |
0.077 |
0.362 |
1.48 |
0.153 |
|
Risk Aversion |
−1.224 |
−0.51 |
0.616 |
−0.818 |
−0.33 |
0.743 |
|
Loss Aversion |
1.852 |
0.73 |
0.470 |
1.415 |
0.55 |
0.589 |
|
Ambiguity Aversion |
2.372 |
0.91 |
0.371 |
1.775 |
0.66 |
0.515 |
|
EDE Sensitivity |
0.082 |
0.13 |
0.899 |
0.131 |
0.19 |
0.851 |
|
Constant |
12.742 |
1.62 |
0.118 |
13.461 |
1.66 |
0.110 |
|
n=294, R 2=0.100 |
n=278, R 2=0.102 |
|||||
Notes: We employ error clustering to control for session level effects
The independent variables are all those from Table 3 that can be defined in the subsample. Regressions 7 and 8 restrict the samples to those sessions for which end of experiment tasks have been measured, thus both treatments B and 66 are excluded. While losing statistical power, these analyses are able to include Holt and Laury (Reference Holt and Laury2002) variants proxies for Risk Aversion, Loss Aversion, Ambiguity Aversion and EDE Sensitivity, i.e. sensitivity to experimenter demand effects. Risk aversion is proxied by the number of risk averse choices in the domain of gains; Loss Aversion by the sum of risk averse choices in the domain of gains and risk loving choices in the domain of losses; Ambiguity Aversion and EDE Sensitivity respectively by the number of ambiguity averse and experimenter demand compliant choices.
Result 3
When covariates are controlled for, subjects appear to like being in majorities. In the differential status treatments, subjects dislike being in the low status group.
Support
We are not able to detect statistically significant differences between aggregate majority and minority mean values. However, in the regression analysis where covariates are controlled for, we find that the Majority dummy is significant across all regressions: subjects are willing to pay 5–9 points more on average for being in a majority group (P<0.05).
In relation to the second part of the result, consistently across Tables 5 and 6 regressions, the coefficients on NotBlue willing imply that subjects are willing to pay less for being low status members by 13–16 points (P<0.001). This is further corroborated by bivariate tests (Wicoxon P<0.007 in relation to the M measure and P<0.037 in relation to the Mb measure in the 10 sessions of S4 and S8): in treatment S8, Blue’s mean perceived value is 28 points, whereas Not Blue’s mean perceived value is just 13 points, i.e. just around half as much.Footnote 36 In S4, the perceived values of Blue and Not Blue are 32 and 18 respectively.Footnote 37
Explaining discrimination
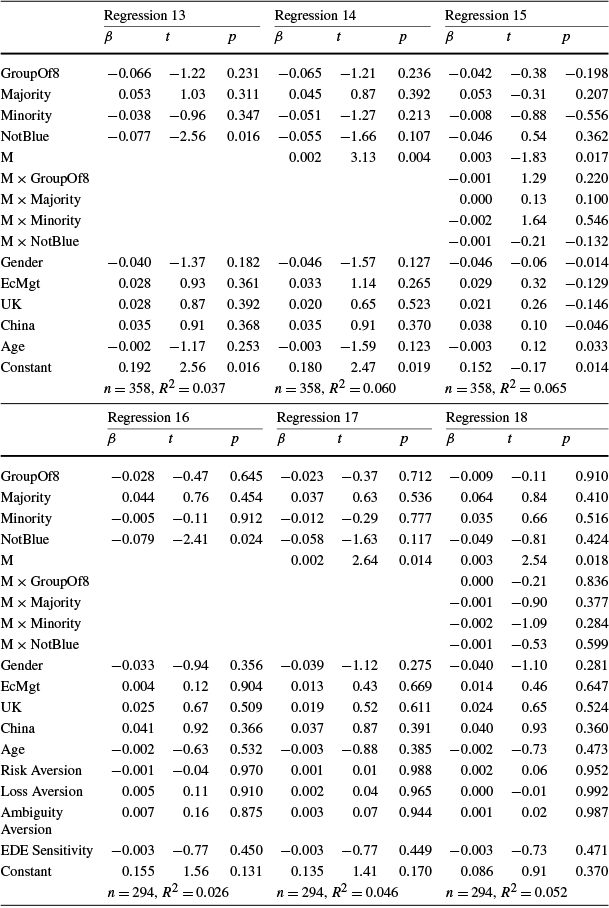
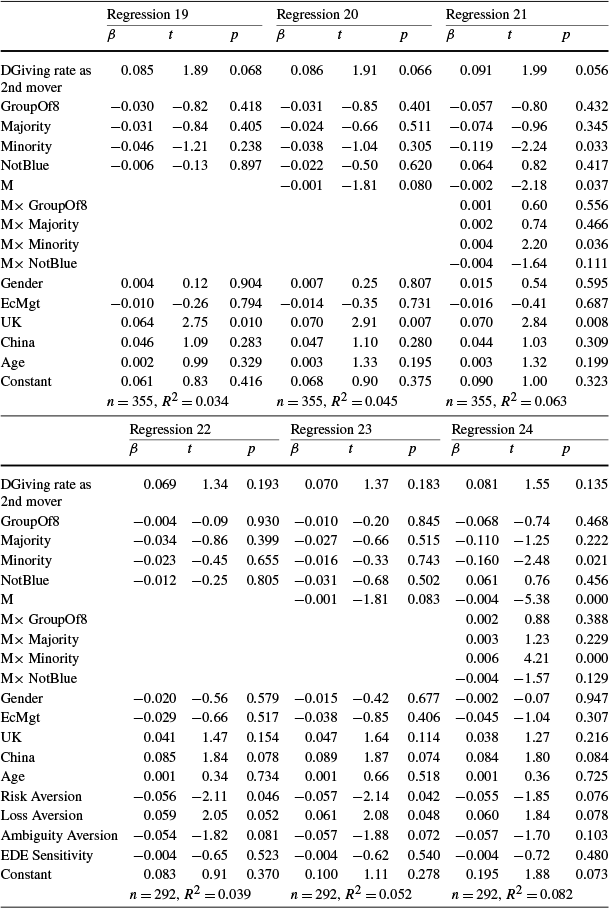
Let DGivingRate (DReturnRate) be equal to mean giving (return) rate by a subject to same group status subjects minus mean giving (return) rate by the same subject to different group status subjects. To investigate discrimination further, we ran regressions, controlling for session specific effects using error clustering, on DGivingRate (Regressions 13–18) and DReturnRate (Regressions 19–24).Footnote 38 Tables 7 and 8 give the results of these regressions.
Table 7 Regressions on DGivingRate
|
Regression 13 |
Regression 14 |
Regression 15 |
|||||||
|---|---|---|---|---|---|---|---|---|---|
|
β |
t |
p |
β |
t |
p |
β |
t |
p |
|
|
GroupOf8 |
−0.066 |
−1.22 |
0.231 |
−0.065 |
−1.21 |
0.236 |
−0.042 |
−0.38 |
−0.198 |
|
Majority |
0.053 |
1.03 |
0.311 |
0.045 |
0.87 |
0.392 |
0.053 |
−0.31 |
0.207 |
|
Minority |
−0.038 |
−0.96 |
0.347 |
−0.051 |
−1.27 |
0.213 |
−0.008 |
−0.88 |
−0.556 |
|
NotBlue |
−0.077 |
−2.56 |
0.016 |
−0.055 |
−1.66 |
0.107 |
−0.046 |
0.54 |
0.362 |
|
M |
0.002 |
3.13 |
0.004 |
0.003 |
−1.83 |
0.017 |
|||
|
M×GroupOf8 |
−0.001 |
1.29 |
0.220 |
||||||
|
M×Majority |
0.000 |
0.13 |
0.100 |
||||||
|
M×Minority |
−0.002 |
1.64 |
0.546 |
||||||
|
M×NotBlue |
−0.001 |
−0.21 |
−0.132 |
||||||
|
Gender |
−0.040 |
−1.37 |
0.182 |
−0.046 |
−1.57 |
0.127 |
−0.046 |
−0.06 |
−0.014 |
|
EcMgt |
0.028 |
0.93 |
0.361 |
0.033 |
1.14 |
0.265 |
0.029 |
0.32 |
−0.129 |
|
UK |
0.028 |
0.87 |
0.392 |
0.020 |
0.65 |
0.523 |
0.021 |
0.26 |
−0.146 |
|
China |
0.035 |
0.91 |
0.368 |
0.035 |
0.91 |
0.370 |
0.038 |
0.10 |
−0.046 |
|
Age |
−0.002 |
−1.17 |
0.253 |
−0.003 |
−1.59 |
0.123 |
−0.003 |
0.12 |
0.033 |
|
Constant |
0.192 |
2.56 |
0.016 |
0.180 |
2.47 |
0.019 |
0.152 |
−0.17 |
0.014 |
|
n=358, R 2=0.037 |
n=358, R 2=0.060 |
n=358, R 2=0.065 |
|||||||
|
Regression 16 |
Regression 17 |
Regression 18 |
|||||||
|---|---|---|---|---|---|---|---|---|---|
|
β |
t |
p |
β |
t |
p |
β |
t |
p |
|
|
GroupOf8 |
−0.028 |
−0.47 |
0.645 |
−0.023 |
−0.37 |
0.712 |
−0.009 |
−0.11 |
0.910 |
|
Majority |
0.044 |
0.76 |
0.454 |
0.037 |
0.63 |
0.536 |
0.064 |
0.84 |
0.410 |
|
Minority |
−0.005 |
−0.11 |
0.912 |
−0.012 |
−0.29 |
0.777 |
0.035 |
0.66 |
0.516 |
|
NotBlue |
−0.079 |
−2.41 |
0.024 |
−0.058 |
−1.63 |
0.117 |
−0.049 |
−0.81 |
0.424 |
|
M |
0.002 |
2.64 |
0.014 |
0.003 |
2.54 |
0.018 |
|||
|
M×GroupOf8 |
0.000 |
−0.21 |
0.836 |
||||||
|
M×Majority |
−0.001 |
−0.90 |
0.377 |
||||||
|
M×Minority |
−0.002 |
−1.09 |
0.284 |
||||||
|
M×NotBlue |
−0.001 |
−0.53 |
0.599 |
||||||
|
Gender |
−0.033 |
−0.94 |
0.356 |
−0.039 |
−1.12 |
0.275 |
−0.040 |
−1.10 |
0.281 |
|
EcMgt |
0.004 |
0.12 |
0.904 |
0.013 |
0.43 |
0.669 |
0.014 |
0.46 |
0.647 |
|
UK |
0.025 |
0.67 |
0.509 |
0.019 |
0.52 |
0.611 |
0.024 |
0.65 |
0.524 |
|
China |
0.041 |
0.92 |
0.366 |
0.037 |
0.87 |
0.391 |
0.040 |
0.93 |
0.360 |
|
Age |
−0.002 |
−0.63 |
0.532 |
−0.003 |
−0.88 |
0.385 |
−0.002 |
−0.73 |
0.473 |
|
Risk Aversion |
−0.001 |
−0.04 |
0.970 |
0.001 |
0.01 |
0.988 |
0.002 |
0.06 |
0.952 |
|
Loss Aversion |
0.005 |
0.11 |
0.910 |
0.002 |
0.04 |
0.965 |
0.000 |
−0.01 |
0.992 |
|
Ambiguity Aversion |
0.007 |
0.16 |
0.875 |
0.003 |
0.07 |
0.944 |
0.001 |
0.02 |
0.987 |
|
EDE Sensitivity |
−0.003 |
−0.77 |
0.450 |
−0.003 |
−0.77 |
0.449 |
−0.003 |
−0.73 |
0.471 |
|
Constant |
0.155 |
1.56 |
0.131 |
0.135 |
1.41 |
0.170 |
0.086 |
0.91 |
0.370 |
|
n=294, R 2=0.026 |
n=294, R 2=0.046 |
n=294, R 2=0.052 |
|||||||
Notes: DGivingRate is equal to the mean giving rate by a subject to same group status subjects minus mean giving rate by the same subject to different group status subjects. We employ error clustering to control for session level effects
Table 8 Regressions on DReturnRate
|
Regression 19 |
Regression 20 |
Regression 21 |
|||||||
|---|---|---|---|---|---|---|---|---|---|
|
β |
t |
p |
β |
t |
p |
β |
t |
p |
|
|
DGiving rate as 2nd mover |
0.085 |
1.89 |
0.068 |
0.086 |
1.91 |
0.066 |
0.091 |
1.99 |
0.056 |
|
GroupOf8 |
−0.030 |
−0.82 |
0.418 |
−0.031 |
−0.85 |
0.401 |
−0.057 |
−0.80 |
0.432 |
|
Majority |
−0.031 |
−0.84 |
0.405 |
−0.024 |
−0.66 |
0.511 |
−0.074 |
−0.96 |
0.345 |
|
Minority |
−0.046 |
−1.21 |
0.238 |
−0.038 |
−1.04 |
0.305 |
−0.119 |
−2.24 |
0.033 |
|
NotBlue |
−0.006 |
−0.13 |
0.897 |
−0.022 |
−0.50 |
0.620 |
0.064 |
0.82 |
0.417 |
|
M |
−0.001 |
−1.81 |
0.080 |
−0.002 |
−2.18 |
0.037 |
|||
|
M× GroupOf8 |
0.001 |
0.60 |
0.556 |
||||||
|
M× Majority |
0.002 |
0.74 |
0.466 |
||||||
|
M× Minority |
0.004 |
2.20 |
0.036 |
||||||
|
M× NotBlue |
−0.004 |
−1.64 |
0.111 |
||||||
|
Gender |
0.004 |
0.12 |
0.904 |
0.007 |
0.25 |
0.807 |
0.015 |
0.54 |
0.595 |
|
EcMgt |
−0.010 |
−0.26 |
0.794 |
−0.014 |
−0.35 |
0.731 |
−0.016 |
−0.41 |
0.687 |
|
UK |
0.064 |
2.75 |
0.010 |
0.070 |
2.91 |
0.007 |
0.070 |
2.84 |
0.008 |
|
China |
0.046 |
1.09 |
0.283 |
0.047 |
1.10 |
0.280 |
0.044 |
1.03 |
0.309 |
|
Age |
0.002 |
0.99 |
0.329 |
0.003 |
1.33 |
0.195 |
0.003 |
1.32 |
0.199 |
|
Constant |
0.061 |
0.83 |
0.416 |
0.068 |
0.90 |
0.375 |
0.090 |
1.00 |
0.323 |
|
n=355, R 2=0.034 |
n=355, R 2=0.045 |
n=355, R 2=0.063 |
|||||||
|
Regression 22 |
Regression 23 |
Regression 24 |
|||||||
|---|---|---|---|---|---|---|---|---|---|
|
β |
t |
p |
β |
t |
p |
β |
t |
p |
|
|
DGiving rate as 2nd mover |
0.069 |
1.34 |
0.193 |
0.070 |
1.37 |
0.183 |
0.081 |
1.55 |
0.135 |
|
GroupOf8 |
−0.004 |
−0.09 |
0.930 |
−0.010 |
−0.20 |
0.845 |
−0.068 |
−0.74 |
0.468 |
|
Majority |
−0.034 |
−0.86 |
0.399 |
−0.027 |
−0.66 |
0.515 |
−0.110 |
−1.25 |
0.222 |
|
Minority |
−0.023 |
−0.45 |
0.655 |
−0.016 |
−0.33 |
0.743 |
−0.160 |
−2.48 |
0.021 |
|
NotBlue |
−0.012 |
−0.25 |
0.805 |
−0.031 |
−0.68 |
0.502 |
0.061 |
0.76 |
0.456 |
|
M |
−0.001 |
−1.81 |
0.083 |
−0.004 |
−5.38 |
0.000 |
|||
|
M× GroupOf8 |
0.002 |
0.88 |
0.388 |
||||||
|
M× Majority |
0.003 |
1.23 |
0.229 |
||||||
|
M× Minority |
0.006 |
4.21 |
0.000 |
||||||
|
M× NotBlue |
−0.004 |
−1.57 |
0.129 |
||||||
|
Gender |
−0.020 |
−0.56 |
0.579 |
−0.015 |
−0.42 |
0.677 |
−0.002 |
−0.07 |
0.947 |
|
EcMgt |
−0.029 |
−0.66 |
0.517 |
−0.038 |
−0.85 |
0.406 |
−0.045 |
−1.04 |
0.307 |
|
UK |
0.041 |
1.47 |
0.154 |
0.047 |
1.64 |
0.114 |
0.038 |
1.27 |
0.216 |
|
China |
0.085 |
1.84 |
0.078 |
0.089 |
1.87 |
0.074 |
0.084 |
1.80 |
0.084 |
|
Age |
0.001 |
0.34 |
0.734 |
0.001 |
0.66 |
0.518 |
0.001 |
0.36 |
0.725 |
|
Risk Aversion |
−0.056 |
−2.11 |
0.046 |
−0.057 |
−2.14 |
0.042 |
−0.055 |
−1.85 |
0.076 |
|
Loss Aversion |
0.059 |
2.05 |
0.052 |
0.061 |
2.08 |
0.048 |
0.060 |
1.84 |
0.078 |
|
Ambiguity Aversion |
−0.054 |
−1.82 |
0.081 |
−0.057 |
−1.88 |
0.072 |
−0.057 |
−1.70 |
0.103 |
|
EDE Sensitivity |
−0.004 |
−0.65 |
0.523 |
−0.004 |
−0.62 |
0.540 |
−0.004 |
−0.72 |
0.480 |
|
Constant |
0.083 |
0.91 |
0.370 |
0.100 |
1.11 |
0.278 |
0.195 |
1.88 |
0.073 |
|
n=292, R 2=0.039 |
n=292, R 2=0.052 |
n=292, R 2=0.082 |
|||||||
Notes: DReturnRate is equal to the mean return rate by a subject to same group status subjects minus mean return rate by the same subject to different group status subjects. We employ error clustering to control for session level effects
Regression 13 contains the same independent variables as the regressions in Table 5. Regression 14 adds stage 2 M and Regression 15 adds interaction terms between stage 2 M and GroupOf8, Majority, Minority and NotBlue. Regressions 16–18 are the corresponding regressions adding the end of experiment task variables (and working on the subset of sessions for which the end of experiment task data is available). Regressions 19–24 are the corresponding regressions to Regressions 13–18 but with DReturnRate as the dependent variable and DGiving Rate as Second Mover as an added independent variable (defined as the giving rate from insiders minus the giving rate from outsiders which the subject has experienced as a trustee).Footnote 39
Result 4
Subjects who value their group more give comparatively more to insiders than to outsiders. Low status subjects discriminate less in giving rates between insiders and outsiders, and, when covariates are controlled for, minority subjects discriminate less in return rates against majority subjects.
Support
The M dummy is positive and significant in all regressions which include it (P<0.02). Regressions 13–16 show that Not Blue subjects discriminate less by about 8 %. This fits with Result 1 that being labeled as an outsider to the one group depresses giving rates to other outsiders. We also just determined that NotBlue is a negative predictor of perceived value (Result 3 and Tables 5 and 6). That being the case, it is not surprising that NotBlue becomes statistically insignificant as perceived value measures are introduced: its effect appears to operate through the impact it has on perceived value, which, in turn and as in HHZ, predicts less discrimination in giving. The natural interpretation of this is that, because low status subjects dislike being low status, they discriminate less in giving.
Regarding the last part of the result on minorities, it fits with Result 2 on minorities returning more to majority subjects. When controlling for the M interaction terms, there is evidence that minority subjects discriminate less (P<0.05 in Regressions 21 and 24).Footnote 40
Result 5
Subjects who value their group more return comparatively less to insiders relatively to outsiders. Minority subjects who value their group more discriminate more between insiders and outsiders.
Support
Subjects who place more value on their own group discriminate less in reciprocating trust rather than more (P<0.1, 0.05, 0.01, 0.01 in Regressions 19, 20, 23 and 24 respectively). Conversely, subjects placing more value in their minority groups discriminate more (P<0.05 in Regressions 21 and 24).Footnote 41
Other results
In all regressions in Tables 5 through 8, our measure of EDE Sensitivity is uncorrelated with behavior.Footnote 42 To the extent that they are proxied by our measure of EDE Sensitivity, experimenter demand effects do not explain perceived value or discrimination in either giving or return rates.
There is some evidence from Regressions 22–24 that risk averse subjects appear to discriminate less (P<0.05 or 0.06), loss averse subjects may discriminate more (P<0.05 or 0.06) and ambiguity averse subjects may also discriminate more (P<0.05 or 0.1);
4 Discussion
As suggested by social identity theory as applied to the understanding of intergroup discrimination (e.g., Tajfel and Turner Reference Tajfel, Turner, Hogg and Abrams2001), we find evidence of deference, in different ways, from low status and from minority subjects. In the psychological research, majorities and minorities can both display ingroup bias (Leonardelli and Brewer Reference Leonardelli and Brewer2001), but our minority subjects discriminate less in return rates against majority subjects when covariates are controlled for (Result 4); and this appears to be connected to greater giving to majority members (Result 2). Our low status subjects are deferential with respect to the amount of trust they put in high status subjects, in the sense that they put less trust in other low status subjects (Result 1) and so engage in less discrimination (Result 4).
Three obvious qualifiers to our findings apply. First, our group identity manipulation is minimal, and, while this is a good first step to allow interpretability, it is possible that stronger group manipulations may be required to obtain larger or different asymmetries in behavioral results; we know that in other settings the strength of group manipulation does affect behavioral findings (e.g., Charness et al. Reference Charness, Rigotti and Rustichini2007; Chen and Chen Reference Chen and Chen2010). Nevertheless, it is striking how we find our minimal group status manipulation having an impact, and more so precisely because it is a minimal manipulation. Second, we cannot rule out that stronger effects of relative group size might follow from more unbalanced group manipulations. As noted in Footnotes Footnote 8 and Footnote 20, random matching was adopted to have the same probability to play with any other subject in the laboratory whether the co-participant belongs to the same or other group, and, as a by-product of random matching, we needed sufficiently large minority groups to ensure that subjects played with both insiders and outsiders and we maximized statistical power. However, more unbalanced groups are an obvious direction for future research. Third, since random matching was adopted, in the majority/minority treatments, minority group subjects are more frequently matched with majority group members. One might argue that minority subjects are deferential because of interacting more frequently with the majority group more than the minority group. However, on the one hand, the random matching ensured that the probability of re-matching with any given subject was precisely the same and so this strategy cannot be justified on the grounds of rational reputational effects; on the other hand, HHZ explicitly tested for the effect of greater frequency of interaction with a ‘segregation’ treatment where subjects played twice as frequently with insiders as with outsider, and did not find that the aggregate level of discrimination changed as a result of differences in the frequency of interaction.Footnote 43
Another key finding of our experiment is that there is loss in psychological value from being either a low status ‘outsider’ or a member of a minority group. Nevertheless, Table 4 shows that in-group favoritism and positive perceived value are still present on average with low status subjects. This is a significant finding in the following sense. One potential criticism of our minimal status manipulation is that what we are really inducing is the perception of not being in any group. However, based on (say) the positive perceived value, it is clear that Not Blue subjects still perceive themselves as a group (if a less desirable, low status group) as opposed to perceive themselves as belonging to no group.Footnote 44 There are also real world examples, such as the traditional Japanese caste system discussed in the introduction, where being classified as outsiders to the high status group or groups is the defining feature of how the low status group is identified.
It is also interesting to compare these results to those from the psychological research, in relation to which the stylized finding is that, while not universally so, low status groups tend to display outgroup favoritism as opposed to the usual ingroup bias (e.g., Hinkle and Brown Reference Hinkle, Brown, Abrams and Hogg1990; Jost and Burgess Reference Jost and Burgess2000; Hewstone et al. Reference Hewstone, Rubin and Willis2002). It is clear that the psychological research is right to suggest that low status group members value own group membership less, and are more deferential to high group status subjects as a result. Our study also replicates the psychological finding that low status subjects get lower satisfaction from group membership than on high status subjects (e.g., Ellemers et al. Reference Ellemers, Van Knippenberg, De Vries and Wilke1988, Reference Ellemers, Doosje, Van Knippenberg and Wilke1992; Sachdev and Bourhis Reference Sachdev and Bourhis1987); so do minority subjects, with minorities generally being perceived more negatively than majorities (Lücken and Simon Reference Lücken and Simon2005; Seyranian et al. Reference Seyranian, Atuel and Crano2008).
There is a connection between the results on behavior and those on psychological value. Low status subjects appear to have low morale and this lower investment in own group identity leads to a reduction in trust towards other low status subjects. In relation to minority subjects, there is both low morale and a lower return rate towards other ingroup members. To put this in the organizational context referred to in the introduction, managers need to be aware of the potential unintended consequences for trust, trustworthiness and morale of creating status-based group partitions in an organization. There is the risk of causing low morale among low status—particularly if minority—workers, and, while high status subjects are not affected by discrimination, the overall impact on trust and trustworthiness for the organization is unlikely to be positive.
Because of overall negative discrimination, creating a polarized society in terms of emphasizing domestic (high status and majority) workers versus foreign workers, as it is common among a number for example of UK newspapers and politicians, erodes trust and trustworthiness, hence potentially leading to a more conflict prone society. If foreign workers indeed see themselves as low status, it may also reduce trust of foreign workers in other foreign workers, while reducing the negative effects in terms of trustworthiness with respect to domestic workers. The qualification on the foreign workers seeing themselves as low status is an obvious one, and is especially interesting to consider in the case of long standing status based social systems, such as the caste system in India or Japan. A common understanding of social status, as clearly identified in a caste system, ensures that a high caste agent does not suffer from the negative social capital implications of social group partitioning in the same way as an outcast. Future research is clearly useful to link our stylized artificial group experiment to a richer natural group setup, against which our work can act as a benchmark.
One finding which is inconsistent with HHZ is that, in return rate regressions, higher perceived own group value is associated with less discrimination (Result 5). There is a countervailing effect for minority subjects (also as per Result 5) and Regression 24 in Table 8 shows that the two effects basically cancel each other for minority subjects. For subjects who are not in minorities, if our result were replicated, one possible interpretation of this would be that more stringent expectations of trust are associated with members of one’s own group, leading to lower return rates for each given level of trust. Put it differently, insiders would feel more let down by any given level of trust from insiders ‘like them’ (Bacharach et al. Reference Bacharach, Guerra and Zizzo2007; Battigalli and Dufwenberg Reference Battigalli and Dufwenberg2007), and as a result they would feel less incline to fulfill trust as a result. This could be seen as another side of what Bohnet et al. (Reference Bohnet, Greig, Herrmann and Zeckhauser2008) label betrayal aversion: if I strongly identify with a group and my higher expectations are not fulfilled, I am more likely to return less as a punishment. Obviously, however, future research needs to determine the extent to which these psychological valuation results are robust, let alone whether our interpretations have merit.
The fact that our results are robust to our experimenter demand effect instrument is at least suggestive evidence that such effects are not a problem in our experiment, or at least they are less of a problem than in most other experiments also given the subtlety of the social statue cue involved. This may not be surprising, since, in a different experiment on inter-group behavior, Turner (Reference Turner1975) reached a similar conclusion based on a detailed analysis of end of experiment subject reports showing that subjects did not see an experimentally ‘appropriate’ way to behave, and those that did, did not always conform to it.Footnote 45 Nor is there reason to believe that having a market for groups may change group salience and so discrimination behavior as a result of an experimenter demand effect, since, as noted in an earlier footnote, HHZ ran a control treatment—closely mirroring our basic design—where there were groups but no market for groups and found no resulting difference.
There is a potential parallelism between our findings on minority subjects and our findings on low status subjects; in both cases, there is evidence of comparative unhappiness with one’s own position and of deference towards (in the sense of less discrimination against) outsiders, though the latter operates differently for the two cases. It is too early to say whether, in a sense, subjects perceive being in a minority as being of low status. The different way in which a stronger psychological valuation operated with respect of minorities and status with respect to return rates would suggests that, as warned by psychologists (e.g., Hewstone et al. Reference Hewstone, Rubin and Willis2002), the analogy can only be drawn that far.
5 Conclusions
We have presented an experiment which employed trust games to look at the impact of low group status and relative group size on trust, trustworthiness and discrimination. While the expected finding of negative discrimination found in HHZ was broadly supported, there are important ways in which group status and comparative group size made a difference. Low status subjects had comparatively low morale by being low status, as measured by own group valuation. They trusted less other low status subjects, implying a comparative deference towards high status subjects. Minority subjects had comparatively low morale by being in a minority. They were less trustworthy with respect to other minority subjects, implying a comparative deference towards majority subjects.
Stronger group identity led to higher discrimination in trust but, surprisingly, to being more unforgiving when it came to reciprocating trust. We conjecture that this may be due to subjects with strong group identity being more likely to feel let down by any lack of trust in them displayed by others in their group. Obviously, further research is needed to verify the robustness of our results, both in general and in relation to specific natural groups and sets of groups.
Acknowledgements
We thank the University of East Anglia for financial support, three reviewers and participants to presentations in Amsterdam, Copenhagen, East Anglia, Nottingham and Oxford for useful advice. The usual disclaimer applies. The experimental instructions, and other appendices, can be found online at http://www.uea.ac.uk/~ec601/MinExpEAppendix2.pdf.


 Open access