


1 Introduction
Political polarization is a widespread global phenomenon (Carothers and Donohue Reference Carothers and Donohue2019), with consequences of great interest to the public and social scientists (Bail et al. Reference Bail, Argyle, Brown, Bumpus, Chen, Hunzaker, Lee, Mann, Merhout and Volfovsky2018; Dixit and Weibull Reference Dixit and Weibull2007). Particularly, the US is useful to study polarization and its consequences due to increasing polarization in current years (Boxell et al. Reference Boxell, Gentzkow and Shapiro2020). Recent studies show that the polarization of the Democratic and Republican Parties is increasing and is higher than at any other time since the Civil War (Hare and Poole Reference Hare and Poole2014). A current survey by the Pew Research center also demonstrates that partisanship division increased in recent years and not only on the party level (Pew Research Center Reference Center2017a). The Pew Research Center (Reference Center2017a) shows that in 1994 more than one-third of self-identified Republicans were more liberal than the median Democrat—compared to just 5% in 2017. The same trend can be seen for Republicans. The study also illustrates that “Republicans and Democrats both say their friend networks are predominantly made up of people who are like-minded politically”(Pew Research Center Reference Center2017a) and most Democrats and Republicans state that they have few or no friends in the opposing party.
Partisanship does not only shape views (Bartels Reference Bartels2002) and influence political behavior (Campbell et al. Reference Campbell, Converse, Miller and Stokes1980; Green et al. Reference Green, Palmquist and Schickler2002) but also affects the decision where to live (Bishop and Cushing Reference Bishop and Cushing2008), what to buy (Nunberg Reference Nunberg2007) and how to name the own children (Oliver et al. Reference Oliver, Wood and Bass2016). Political polarization also has negative consequences. For example, it has been shown that political polarization corrodes civility in public discourse (Sunstein Reference Sunstein2018), erodes public faith in institutions (Fomina Reference Fomina2019) and nourishes discontent with political parties (Carothers and Donohue Reference Carothers and Donohue2019). Yet, it is an open question whether and how political polarization affects individual decision-making, particularly destructive behavior.
Our research examines whether and to what degree political polarization “spills over” into non-political, especially destructive behavior. To examine this question, we recruit from the population of American online workers without revealing anything about our interest in partisan spillovers. We then compare individual choices outside of the voting context but based on the (revealed) partisan preferences of the co-player. Our main question is whether partisanship produces spiteful decisions among the population at large outside of political contexts.
We, therefore, measure attitudes of supporters of Donald Trump and of supporters of Hillary Clinton towards coinciding voters and opposing voters. More importantly, we measure whether participants are willing to harm their counterparts (by reducing their payoff). We do so by adopting a design with no trade-off between the own and the others’ payoffs; that is, a setting of pure spite. To the best of our knowledge, we are the first to study spite in a political context, and more importantly, we are the first to study the “spill over” of partisan preferences into destructive behavior.
Previous research has already focused on whether partisanship affects non-political behavior. For example, Fowler and Kam (Reference Fowler and Kam2007) demonstrates that partisanship influences decisions in dictator games. They show ingroup favoritism among co-partisans in the sense that dictators share more money with partisan recipients than non-partisans. In a similar vein, Carlin and Love (Reference Carlin and Love2013) investigate the effect of partisanship on trust behavior. They show that partisanship biases trust behavior in favor of co-partisans.Footnote 1 While there is a trade-off between the own payoff and the other’s payoff in dictator and trust games, we use a game where there is no monetary benefit for the decider in destroying the payoff of the other. Thus, we look at a systematically different situation. While e.g., Fowler and Kam (Reference Fowler and Kam2007) can show that partisanship influences decisions in dictator games, it seems like this behavior is to benefit the ingroup without harming the out-group. Yet, the dictator game does not allow for a distinction between positive and negative discrimination. We use a design that identifies the dysfunctional aspect of behavior. Hence, the difference between a dictator game and our game is comparable to the difference between omitting help and directly harming others. Thus, unlike Fowler and Kam (Reference Fowler and Kam2007) and Carlin and Love (Reference Carlin and Love2013) the main goal of our paper is to study dysfunctional behavior directly.
Investigating the effect of partisanship on non-political behavior is also closely linked to the literature on the ingroup–outgroup bias.Footnote 2 This literature investigates whether group affiliation (either induced or existing) leads to discriminatory behavior towards ingroup and/or outgroup-members.Footnote 3 One of the main findings in this strand of literature is that people discriminate positively towards the ingroup (ingroup favoritism). However, hostile discrimination against the outgroup (outgroup-hate) is rarely found.Footnote 4
One exception using natural groups is Weisel and Böhm (Reference Weisel and Böhm2015), who show that findings of outgroup-hate are actually more a form of help avoidance and less a form of direct harm to the outgroup. Similarly, Abbink and Harris (Reference Abbink and Harris2019) study intergroup conflict among artificial and naturally occurring groups and find outgroup discrimination only among the naturally occurring groups. Moreover, Heap and Zizzo (Reference Heap and Zizzo2009) and Zizzo (Reference Zizzo2010) show negative discrimination in artificially induced groups and in cases where the perception of common fate is missing. Further, Brewer (Reference Brewer, Sibley and Barlow2017) reviews the literature on ingroup-love and outgroup-hate and points out that most discrimination is positive and not negative. Balliet et al. (Reference Balliet, Wu and Dreu2014) apply meta-analytic techniques on cooperative decision-making studies of intergroup conflict and find support for ingroup favoritism, but little evidence for outgroup-hate. Most recently, Dimant (Reference Dimant2020) provides evidence that ingroup-love and outgroup-hate function differently and are not necessarily two sides of the same coin. Specifically, Dimant (Reference Dimant2020) finds, in a setting of political polarization, that ingroup-love occurs in the perceptional domain, whereas outgroup-hate occurs in the behavioral domain.
In the economic literature, Chen and Li (Reference Chen and Li2009) show that ingroup-bias also transcends to economic decision-making.Footnote 5 More specifically they show that a match with an ingroup-member results in greater charity concerns and lower envy.Footnote 6 The most current advancements are made by Kranton and Sanders (Reference Kranton and Sanders2017) and Kranton et al. (Reference Kranton, Pease, Sanders and Huette2018). Kranton and Sanders (Reference Kranton and Sanders2017) show that people exhibit groupy and non-groupy preferences. More specifically, Kranton and Sanders (Reference Kranton and Sanders2017) use a minimal-group paradigm and political affiliation to investigate whether a person’s social preferences change depending on the matched partner type. They show that 40% of participants exhibit no bias, i.e., the participants do not change their social preferences, while 60% of participants switch from one social-preference classification to another (e.g., selfish to inequality-averse). Interestingly, the results in Kranton and Sanders (Reference Kranton and Sanders2017) indicate that ingroup-bias might result in a higher likelihood of being classified as dominance-seeking. Thus our work can be seen as complementary to Kranton and Sanders (Reference Kranton and Sanders2017) and provides even stronger support for the importance of partisanship on changes in social preferences. Thus, while the literature so far has mainly provided compelling evidence for ingroup-bias, there has been no sole focus on the destructive side of this bias. Different from the previous literature, we focus particularly on negative discrimination in the form of direct harm.
While the question at hand has not been answered so far, there has been some research on antisocial behavior. A prevalent theme in economic decision-making is the study of prosocial behavior. It has been demonstrated that people have prosocial preferences,Footnote 7 behave as conditional cooperators,Footnote 8 and are willing to sacrifices their own payoff for the benefit of another person.Footnote 9 However, the dark side of economic decision-making is emerging recently. This literature shows that a significant fraction of people are not maximizing payoff or behaving prosocially but are punishing antisocially (Herrmann et al. Reference Herrmann, Thöni and Gächter2008), are burning money of others,Footnote 10 behaving spitefullyFootnote 11 and even are willing to pay for the antisocial behavior.Footnote 12 This literature has also established that even children display destructive behavior (Fehr et al. Reference Fehr, Glätzle-Rützler and Sutter2013), that observability might induce antisocial behavior (Bolton et al. Reference Bolton, Dimant and Schmidt2018), and that social proximity matters for social preferences (Dimant and Hyndman Reference Dimant and Hyndman2019). Further, Dimant (Reference Dimant2019) shows that antisocial behavior is more contagious than prosocial behavior and that social proximity amplifies this effect. Similarly, Bauer et al. (Reference Bauer, Cahlíková, Chytilová and Želinský2018) provide evidence of social contagion of ethnic hostility, and Zizzo and Fleming (Reference Zizzo and Fleming2011) show that social pressure is correlated with money-burning behavior. Most relevant for our paper in the context of antisocial behavior are the studies by Dimant (Reference Dimant2020) and Gangadharan et al. (Reference Gangadharan, Grossman, Molle and Vecci2019). Dimant (Reference Dimant2020) focuses on political polarization (in the form of hate and love for Donald J. Trump) and finds outgroup-hate in a take-or-give dictator game. Gangadharan et al. (Reference Gangadharan, Grossman, Molle and Vecci2019) study the effect of social identity (via university residential arrangements) on antisocial behavior and reveal that sharing the same social identity mitigates antisocial behavior. We contribute to this literature by focusing explicitly on the effect of political polarization on antisocial behavior.
In line with the previous literature on destructive behavior, we find that some participants are willing to destroy the resources of coinciding voters. More importantly, however, we show that, on the aggregate, participants behave significantly more spitefully towards their voting counterpart (i.e., opposing voters)—they increase the probability of destroying an opposing voter’s payoff by almost 15% relative to the probability of destroying a fellow voters’ payoff—which constitutes our main finding. Yet, it is important to understand whether this effect is found throughout or is rather driven by a subgroup. Of particular interest is the behavior of the rather distinct subgroups of Clinton and Trump voters. We find that Trump voters, who generally exhibit higher levels of spite, do not behave more spitefully towards opposing voters—there is no statistically significant effect of their opponents’ partisanship on their choices. By contrast, Clinton voters do behave increasingly more spitefully towards opposing voters—they increase the probability of destroying a Trump voters’ payoff by almost 34% relative to the probability of destroying a fellow Clinton voter’s payoff. Thus, our main result is driven primarily by the behavior of Clinton voters. We also see that participants significantly dislike their voting counterparts. The difference in behavior between Clinton and Trump voters seems to arise from an asymmetry in the intensity of the ingroup–outgroup bias. Clinton voters express strong antipathy toward Trump supporters, whereas Trump voters have a weaker aversion towards Clinton voters. Thus, we offer three main results:
1. Participants report having more negative attitudes towards opposing voters.
2. Participants behave significantly more spitefully towards their voting counterparts, which is mostly driven by Clinton voters.
3. Clinton and Trump voters differ substantially in their attitudes and behavior towards opposing voters.
Altogether, we provide first evidence of spiteful behavior due to political affiliation, and we find first empirical support for the destructive effects of political division.
2 Design
In the following, we will present the recruitment, the procedure of the experiment, and the measures of interest.Footnote 13 We conducted the experiment in five waves: before the 58th US presidential election in late November 2016, after the inauguration of the president-elect in late January 2017, before the midterms in late October 2018, after the midterms in early November 2018 and after the 59th US presidential election in early January 2021.Footnote 14
2.1 Recruitment
Participants were recruited via Amazon’s Mechanical Turk (MTurk) which is an online labor market and frequently used by social scientists for conducting experiments.Footnote 15 Workers in MTurk can choose from human intelligence tasks (HITs), and are paid by the requester after performing the task. These tasks are typically relatively simple and quick (like answering surveys, transcribing data, classifying images, etc) (Horton et al. Reference Horton, Rand and Zeckhauser2011; Paolacci et al. Reference Paolacci, Chandler and Ipeirotis2010). More importantly, MTurk samples tend to be more representative of the US population than typical student samples as MTurk samples are usually more diverse in age, ethnicity, education, and geographical location than student samples (Buhrmester et al. Reference Buhrmester, Kwang and Gosling2011; Paolacci et al. Reference Paolacci, Chandler and Ipeirotis2010). Further, the results obtained in MTurk are similar to results obtained via traditional methods (Buhrmester et al. Reference Buhrmester, Kwang and Gosling2011; Paolacci et al. Reference Paolacci, Chandler and Ipeirotis2010). For example, in a recent paper Arechar et al. (Reference Arechar, Gächter and Molleman2018) show that even interactive experiments can be conducted very reliably online and that behavioral patterns observed in the lab can be replicated using an online experiment with an MTurk sample.
In addition to the more diverse sample, there are several advantages of using an online design for our experiment. First, participants’ anonymity can be sufficiently ensured, as we have only participants’ MTurk-ID, which might result in more reliable results concerning antisocial behavior. Secondly, reciprocity concerns can be minimized as participants have no way of meeting the other participants nor figuring out who was assigned as their partner (which might be possible in a laboratory setting, which might bias behavior in a more pro-social direction). Third, peer effects can be excluded for the reason mentioned above. Fourth, participants might be more open to revealing their true political identity.
To ensure a qualitative sample (i.e., participants understanding the task and paying attention), we restrict eligibility criteria. We restrict recruitment to US-based individuals with an approval rate of 97% or higher.Footnote 16 Further, we restrict recruiting to individuals with 500 or more approved HITs. In addition, individuals have to pass an attention check and comprehension questions to take part.
2.2 Procedure
Participants willing to take part in the study were directed to the online survey tool Qualtrics, where they were asked about their vote in the 58th US presidential election. Only participants who indicated to vote for either Donald Trump or Hillary Clinton were directed towards the consent form.Footnote 17 Undecided or independent voters were excluded from participation in the survey. All of the remaining participants were directed, after reading the consent form, to answer socio-demographic questions (gender, age, income, education).Footnote 18
Thereafter, the participants were presented with the experimental manipulation. The manipulation of the experiment was to let the participants either interact with a coinciding voter or an opposing voter.
The participants were told that at the beginning of the experiment, Trump voters were assigned the group color red, while Clinton voters were assigned the color blue. The manipulation across participants was to tell them which color their matched opponent will have (either red or blue).Footnote 19
To test comprehension and attentiveness, we asked whether participants understand the elements that appear on her screen, as some recent studies indicate the use of bots on MTurk. These simple questionnaire-elements include choices, payoffs, as well as information of her coplayer, i.e., whether their matched competitor was assigned the color blue, red, or green (which was a filler). Inattentive participants, those not comprehending the task, as well as potential bots were filtered out, as we are only interested in participants who have a basic comprehension of the task. Thus, failing to answer these questions correctly led to the exclusion of the experiment and the payment.
One potential concern of asking—as a basic comprehension test—which color the competitor was assigned to, might make the manipulation salient.Footnote 20 There are several responses to this concern. First, it is crucial for this study that participants have a basic comprehension of the task and the situation. Second, there have been several comprehension questions which would diffuse the focus on this particular manipulation question. Third, even if the question would result in a higher salience for the political position of the opponent, this would just result in a more realistic setting. Political attitudes and views are often presented and highlighted very saliently by real-world actors, as setting up yard signs, having political bumper stickers, wearing MAGA-hats, etc.Footnote 21
Overall, we have a 2 (Own Vote
 Clinton; Trump
 )
)
 2 (Opponent’s Vote
 Clinton; Trump
 ) design.
After answering the control question, we measured the spite behavior towards their co-player (either coinciding voter or opposing voter), which is explained in greater detail in Sect. 2.3. After completing the incentivized tasks, the participants had to answer a set of post-experimental questions.
To measure the participant’s attitudes towards the opposing voters, we used an adjusted version of the social distance questionnaire (Crandall Reference Crandall1991) and the feeling thermometer (Weisberg Reference Weisberg1980). We also elicited the general spite tendency by using a questionnaire (Marcus et al. Reference Marcus, Zeigler-Hill, Mercer and Norris2014).Footnote 22
At the end of the experiment, one of the items from the spite behavior was randomly selected to become payoff-relevant to ensure incentive compatibility.Footnote 23 The participants were informed that they would be paid within 1 week after determining the payoff, depending on their and their opponent’s decision.Footnote 24 A graphical representation of the procedure can be seen in Fig. 16 in supplementary material.
2.3 Own spite measure
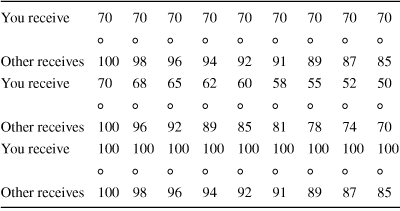
Our main measure was aimed to mimic basic market interactions where spite has been observed. More specifically, our measure reflects a simplified and condensed version of a second-price auction where one player can reduce the payoff of the opponent by increasing the own bid (see Kimbrough and Reiss Reference Kimbrough and Reiss2012, for such a situation). This measure consists of three distribution-decisions upon money. These distributions are shown in Table 1. We call this our own spite measure. We asked the participants to decide three times among nine possible allocations, similar to the SVO-Slider measure by Murphy et al. (Reference Murphy, Ackerman and Handgraaf2011). The participants were told that either their decision or their opponent’s decision would be implemented, depending on a computerized random draw.
In all sets, the allocation with the highest payoff for the other player also maximizes the own payoff. However, any deviation from this allocation reduces the payoff of the other player and never increases the own payoff. In contrast to a standard dictator game—where there is a trade-off between the own payoff and the payoff of the opponent—in this game, the participants who do not choose the Pareto-efficient outcome do this in order to harm the other player. Therefore, any deviation from the Pareto-efficient outcome resembles spiteful behavior in a market setting and can be interpreted as spite or joy-of-destruction.Footnote 25
Table 1 Spite measure
|
You receive |
70 |
70 |
70 |
70 |
70 |
70 |
70 |
70 |
70 |
|
|
|
|
|
|
|
|
|
|
|
|
Other receives |
100 |
98 |
96 |
94 |
92 |
91 |
89 |
87 |
85 |
|
You receive |
70 |
68 |
65 |
62 |
60 |
58 |
55 |
52 |
50 |
|
|
|
|
|
|
|
|
|
|
|
|
Other receives |
100 |
96 |
92 |
89 |
85 |
81 |
78 |
74 |
70 |
|
You receive |
100 |
100 |
100 |
100 |
100 |
100 |
100 |
100 |
100 |
|
|
|
|
|
|
|
|
|
|
|
|
Other receives |
100 |
98 |
96 |
94 |
92 |
91 |
89 |
87 |
85 |


The table depicts the nine allocation choices in each of the three decisions of participants in our own spite measure. For each choice, the upper row denotes the payoff in experimental currency units for the deciding participants, while the bottom rows each denote the payoff for the other player
In our measure, the spite score is the amount taken away relative to the maximally possible amount. The amount taken away can range between 0 and 60 points (reducing the payoff of the opponent in all three distributions) and, therefore, the spite score ranges between 0 and 1.Footnote 26 As spite is arguably rather rare, we designed the task such that the incentive to behave spitefully is rather high. In particular, we decided to have low stakes (i.e., each point in the distribution represents 0.2 cents)Footnote 27 so that behaving spitefully is easily detected. This way, first, we potentially increase the chance of finding spiteful behavior, and second, any null-findings would have a greater bearing.
2.4 Measures of attitudes
To measure the participant’s attitudes towards their co-player, we utilized the social distance questionnaire and the feeling thermometer.
2.4.1 Social distance questionnaire
The social distance questionnaire is designed “to measure social rejection and willingness to interact with an individual member of a social group” (Robinson et al. Reference Robinson, Shaver and Wrightsman1999, p. 341 ff). In our experiment, the respective social groups were Trump voters and Clinton voters. The questionnaire elicits the agreeableness upon seven items on a scale between one and seven. The participants were asked to rate how strongly they agree with statements about a person. For example, participants were asked to indicate how strongly they agree with the following statements made about a Trump voter: “This appears to be a likable person” or “I would like this person to move into my neighborhood.” The social distance score is the mean of seven item answers.Footnote 28 Higher scores indicate feeling closer to the individual member of the respective social group.
2.4.2 Feeling thermometer
The feeling thermometer is commonly used in polling (f.e. American national election studies), political sciences (Greene Reference Greene1999; Kaid et al. Reference Kaid, Leland and Whitney1992; Miller and Wlezien Reference Miller and Wlezien1993) and also in medicine (Patrick et al. Reference Patrick, Starks, Cain, Uhlmann and Pearlman1994; Jacobson et al. Reference Jacobson, Maxson, Mays and Kowalski1992; Schünemann et al. Reference Schünemann, Griffith, Jaeschke, Goldstein, Stubbing and Guyatt2003). The feeling thermometer asks participants to imply how warm they feel towards a specific group or person. We asked participants to indicate their feeling towards Clinton voters, Trump voters, Republicans in general, and Democrats in general, on a scale between 0 and 10. Participants were told that if they had a positive feeling towards a group or feel favorably towards it, they should give it a score somewhere between 5 and 10, depending on their feeling. If they felt negatively, they should give a score between 0 and 5, and in case of no feeling, they should give a score of 5.
2.5 Framework
To help the reader place our results, we present a simple framework based on a model of antisocial behavior by Gangadharan et al. (Reference Gangadharan, Grossman, Molle and Vecci2019). The monetary payoff of participant i is denoted by
 for each choice a. However, we also assume that participant i has a concern for the monetary payoff of the opponent
 . Following Gangadharan et al. (Reference Gangadharan, Grossman, Molle and Vecci2019), we assume this concern to be the difference between the own monetary payoff and the monetary payoff of the opponent weighted by the spite factor
 . The utility function of participant i, therefore, is given by:

where u(x) denotes the utility from monetary payoff. For values of
 we classify the preferences of the participant as spiteful and for values of
 we classify the preferences of the participant as altruistic. To account for the political identity of the opponent we assume that the regard for the opponent’s gain is shifted by
 . Thus, the utility function of participant influenced by political identity is given by:

Let
 if participants share the same political identity as their opponent, and
 otherwise.
We can easily see that the utility of i is increasing in
 if they are altruistic (
 ) and is decreasing in
 if they are spiteful (
 ). More importantly, it is evident that the decreasing utility in
 is larger if the participants do not share the same political identity as their opponent. Thus, we hypothesize that participants behave more spitefully if they are paired with an opposing voter compared to a coinciding voter, i.e. political identity influences antisocial behavior.
3 Results
3.1 Participants
A total of 3535 participants (1888 females, 1647 males, 2180 Clinton voters, 1355 Trump voters) finished the survey.Footnote 29
As with most experimental studies, our sample does not perfectly represent the American population. However, in Online Appendix we elaborate in detail how our selected sample does show a striking similarity to the general populations’ patterns and reflects the attitudes of general Clinton and Trump voters rather reliably.
3.2 Spite behavior
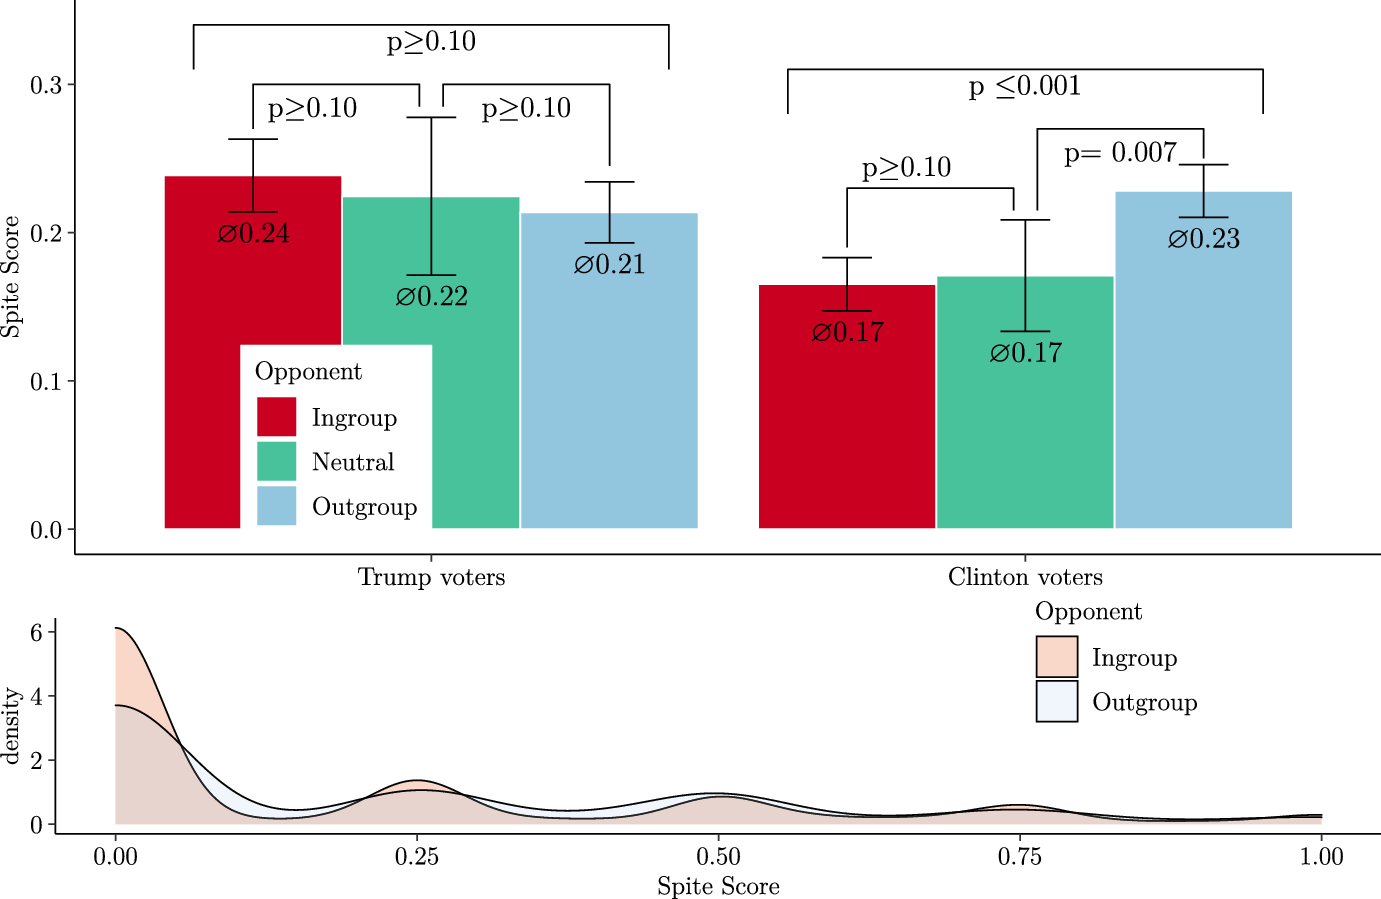
Fig. 1 Results of the spite score. The figure on the top depicts how spitefully participants behave their partners. The left three bars show the spite behavior of Trump voters while the right three bars show the spite behavior of Clinton voters. Red bars denote the spite behavior towards outgroup-members (i.e., opposing voter), while blue bars denote the spite behavior towards ingroup-members (i.e., coinciding voter) averaged over all five waves. Green bars denote the spite behavior in the baseline treatment, which was collected only in the fifth wave, where no information upon the opponent was provided. Tie fighters depict 95% confidence intervals. P values are calculated using t-tests. The figure on the bottom depicts the distribution of the spite score by opponent. The red distribution denotes the spite behavior toward ingroup-members while the blue distribution denotes the spite behavior towards outgroup-members. (Color figure online)
To see how participants are behaviorally influenced by their opponent, we examine the spite score in this section. The spite score is a proportion between 0 and 1, and it represents how many points were taken away from the opponent relative to the maximally possible amount. For example, a spite score of .4 means that 40% of the payoff was destroyed relative to payoff that could have been destroyed. A distribution of the spite score is shown in the bottom panel of Fig. 1. The top panel of Fig. 1 depicts the aggregated spite behavior by opponent and vote. We can see that the spite behavior towards ingroup-members (i.e., coinciding voters) is substantial. On average 41% of participants behave spitefully towards an ingroup-member and overall participants exhibit a spite score of 0.19 towards ingroup-members. Note that this level of spite is not uncommon in the literature. For example, Levine (Reference Levine1998) demonstrates that 20% of subjects might be considered spiteful. Sadrieh and Schröder (Reference Sadrieh and Schröder2017) find in their experiment that about 37% of participants were willing to harm passive players. Further, Kimbrough and Reiss (Reference Kimbrough and Reiss2012) find that 34% of choices are spiteful and about 15% of choices are maximally spiteful, and Abbink and Sadrieh (Reference Abbink and Sadrieh2009) and Abbink and Herrmann (Reference Abbink and Herrmann2011) find destruction rates between 9 and 40%.
To analyze the spite behavior more formally we will use a zero-inflated beta-regression. In Online Appendix we discuss in detail why we use this estimation approach and how it is estimated. Note that all our results are also robust to more common estimation methods like OLS and Tobit regressions as discussed in Online Appendix. Essentially the zero-inflated beta-regression estimates the decision to be spiteful in two parts: first, it estimates whether a participant decided to be spiteful or not (using a logistic regression); and second, it estimates conditionally on deciding to be spiteful, how spiteful participants decided to behave (using a beta regression).
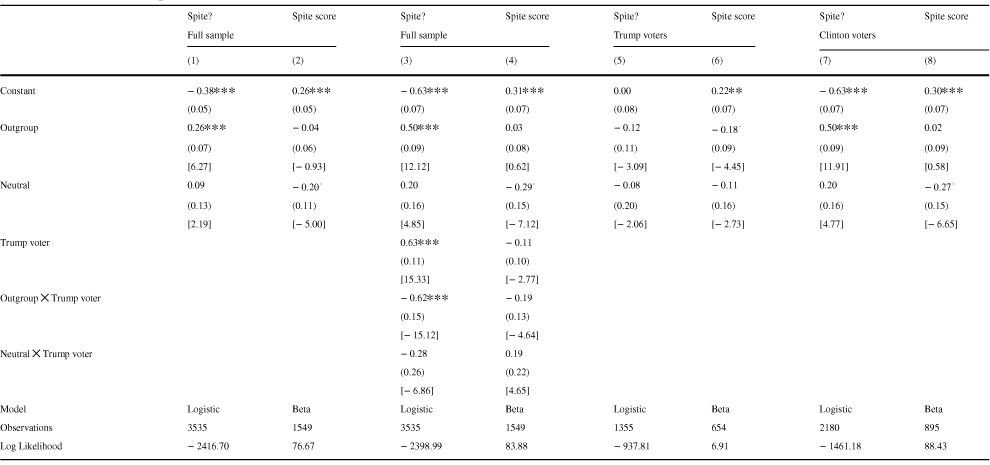
On the aggregate (pooling over Clinton and Trump voters), we can see from Table 2 that the probability of a participant to behave spitefully towards an opposing voter (47%) is significantly higher than the probability of a participant to behave spitefully towards a fellow voter (41%). Specifically, the probability of spiteful behavior increases by 15% if a participant is to interact with an opposing voter. However, the intensity of spite, conditional on being spiteful, does not increase significantly if the deciding participant is interacting with an outgroup-member compared to an ingroup-member. Further, we see that spiteful behavior is indistinguishable between ingroup-members and neutral members.Footnote 30 Thus, we find evidence of negative discrimination.Footnote 31
Result B1 Participants are significantly more likely to behave spitefully towards an opposing voter compared to a coinciding voter.
Thus, the key insight is that the participants are more likely to behave spitefully towards people who voted differently in a non-political situation, and shows that partisanship spills over into the non-political realm. However, this result is driven mainly by the behavior of Clinton voters.
The disaggregated results can be found in Table 2.Footnote 32 The probability of a Clinton voter to behave spitefully towards a Trump voter is significantly higher than the probability of a Clinton voter to behave spitefully towards a Clinton voter. Specifically, Clinton voters increase the probability of spiteful behavior towards outgroup-members significantly from 35 to 47%, i.e. a relative increase of 34%. Once decided to behave spitefully, the probability of a Clinton voter to behave fully spitefully (taking away all points) towards a coinciding voter did not differ significantly from the probability of a Clinton voter to behave fully spitefully towards a Trump voter. We also see that Clinton voters do not behave more spitefully (neither in their decision to behave spitefully nor in their conditional behavior) towards a neutral baseline opponent. Thus, Clinton voters display more spiteful behavior towards outgroup-members, which is consistent with negative discrimination.
Concerning Trump voters, we see that they are significantly more likely to behave spitefully towards a coinciding voter compared to the likelihood of a Clinton voter behaving spitefully to a coinciding voter. However, Trump voters show no significant change in their spiteful behavior towards Clinton voters (neither in their decision to behave spitefully nor in their conditional behavior). We also see that Trump voters do not behave more spitefully (neither in their decision to behave spitefully nor in their conditional behavior) towards a neutral baseline opponent. Thus, while Trump voters generally behave more spitefully they do not differentiate between ingroup-members, outgroup-members and neutral opponents.
Thus, the antisocial behavior of Clinton voters is mainly driving the result B1. This means that Clinton voters engaged in relatively more dysfunctional behavior than Trump voters if paired with an outgroup-member compared to an ingroup-member. Thus, political polarization leads to more dysfunctional behavior—however, only for Clinton voters.
Result B2 Clinton voters are more likely to behave spitefully towards Trump voters compared to fellow Clinton voters. Trump voters, on the other hand, do not differentiate in their behavior between Clinton and Trump voters.
Table 2 Estimation of the spite behavior
|
Spite? |
Spite score |
Spite? |
Spite score |
Spite? |
Spite score |
Spite? |
Spite score |
|
|---|---|---|---|---|---|---|---|---|
|
Full sample |
Full sample |
Trump voters |
Clinton voters |
|||||
|
(1) |
(2) |
(3) |
(4) |
(5) |
(6) |
(7) |
(8) |
|
|
Constant |
− 0.38
|
0.26
|
− 0.63
|
0.31
|
0.00 |
0.22
|
− 0.63
|
0.30
|
|
(0.05) |
(0.05) |
(0.07) |
(0.07) |
(0.08) |
(0.07) |
(0.07) |
(0.07) |
|
|
Outgroup |
0.26
|
− 0.04 |
0.50
|
0.03 |
− 0.12 |
− 0.18
|
0.50
|
0.02 |
|
(0.07) |
(0.06) |
(0.09) |
(0.08) |
(0.11) |
(0.09) |
(0.09) |
(0.09) |
|
|
[6.27] |
[− 0.93] |
[12.12] |
[0.62] |
[− 3.09] |
[− 4.45] |
[11.91] |
[0.58] |
|
|
Neutral |
0.09 |
− 0.20
|
0.20 |
− 0.29
|
− 0.08 |
− 0.11 |
0.20 |
− 0.27
|
|
(0.13) |
(0.11) |
(0.16) |
(0.15) |
(0.20) |
(0.16) |
(0.16) |
(0.15) |
|
|
[2.19] |
[− 5.00] |
[4.85] |
[− 7.12] |
[− 2.06] |
[− 2.73] |
[4.77] |
[− 6.65] |
|
|
Trump voter |
0.63
|
− 0.11 |
||||||
|
(0.11) |
(0.10) |
|||||||
|
[15.33] |
[− 2.77] |
|||||||
|
Outgroup
|
− 0.62
|
− 0.19 |
||||||
|
(0.15) |
(0.13) |
|||||||
|
[− 15.12] |
[− 4.64] |
|||||||
|
Neutral
|
− 0.28 |
0.19 |
||||||
|
(0.26) |
(0.22) |
|||||||
|
[− 6.86] |
[4.65] |
|||||||
|
Model |
Logistic |
Beta |
Logistic |
Beta |
Logistic |
Beta |
Logistic |
Beta |
|
Observations |
3535 |
1549 |
3535 |
1549 |
1355 |
654 |
2180 |
895 |
|
Log Likelihood |
− 2416.70 |
76.67 |
− 2398.99 |
83.88 |
− 937.81 |
6.91 |
− 1461.18 |
88.43 |


This table depicts a zero-inflated beta regression model of the spite behavior. Outgroup indicates that the opponent is an outgroup-member (i.e., opposing voter), Neutral indicates that the opponent is not specified (i.e., baseline, which was collected in the fifth wave only), and the omitted category is Ingroup which indicates that the opponent is an ingroup-member (i.e., coinciding voter). Models (1), (3), (5), and (7) denoted by “Spite?” estimate the decision to behave spitefully or not with a logistic regression. Models (2), (4), (6), and (8) denoted by “Spite Score” estimate the decision on how spitefully to behave conditionally on behaving spitefully using a beta regression. Model (1)–(4) display the full sample while Models (5)–(6) and (7)–(8) display the spite behavior of Trump and Clinton voters, respectively. Standard errors are in parenthesis. Marginal effects (in %) are shown in brackets
 ;
;
 ;
;
 ;
;

3.3 Attitudes
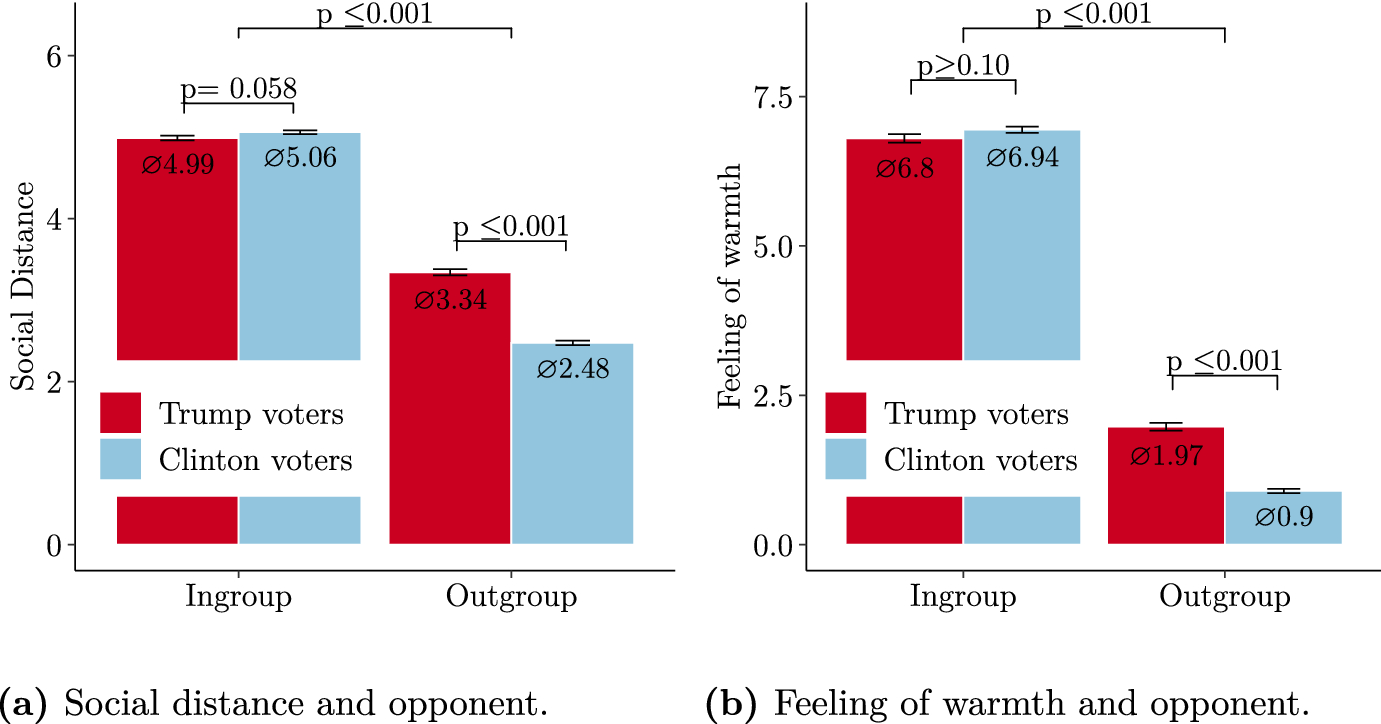
Fig. 2 Attitudes and opponent. The figure shows the attitudes towards opponents. The figure on the left shows how close participants report to feel towards their ingroup-members and outgroup-members. The figure on the right shows how warm participants report to feel towards their ingroup-members and outgroup-members. The left two columns show the attitudes towards ingroup-members (i.e., coinciding voters) while the two right columns indicate the attitudes towards outgroup-members (i.e., opposing voters). Red bars denote the attitudes of Trump voters, while blue bars denote the attitudes of Clinton voters. Tie fighters denote 95% confidence intervals. P values are calculated using t-tests. (Color figure online)
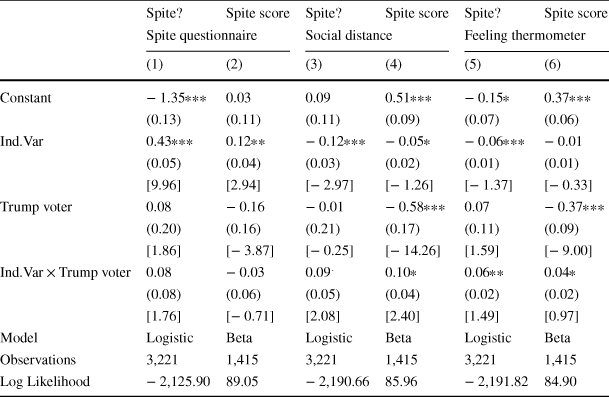
To have a better understanding of the underlying reasoning for the observed behavior, we examine how attitudes are related to spiteful behavior. For that purpose, we investigate how the spite score is related to the spite questionnaire, feeling of closeness and feeling of warmth. The result of these estimations can be found in Table 3. It can be seen that the probability of behaving spitefully and behaving maximally spitefully (conditional on behaving spitefully) increased with increasing scores in the spite questionnaire. Comparably, it can be seen that the probability of behaving spitefully and behaving maximally spitefully decreased with the distance and the warmth participants felt towards their opponent. Thus, the kinder the attitude participants have towards their opponent the less spitefully is the behavior.
Result A0 Feeling of warmth, feeling of closeness, and the spite questionnaire measure are significantly correlated with spite behavior.
Table 3 Attitudes as predictors of spite behavior
|
Spite? |
Spite score |
Spite? |
Spite score |
Spite? |
Spite score |
|
|---|---|---|---|---|---|---|
|
Spite questionnaire |
Social distance |
Feeling thermometer |
||||
|
(1) |
(2) |
(3) |
(4) |
(5) |
(6) |
|
|
Constant |
− 1.35
|
0.03 |
0.09 |
0.51
|
− 0.15
|
0.37
|
|
(0.13) |
(0.11) |
(0.11) |
(0.09) |
(0.07) |
(0.06) |
|
|
Ind.Var |
0.43
|
0.12
|
− 0.12
|
− 0.05
|
− 0.06
|
− 0.01 |
|
(0.05) |
(0.04) |
(0.03) |
(0.02) |
(0.01) |
(0.01) |
|
|
[9.96] |
[2.94] |
[− 2.97] |
[− 1.26] |
[− 1.37] |
[− 0.33] |
|
|
Trump voter |
0.08 |
− 0.16 |
− 0.01 |
− 0.58
|
0.07 |
− 0.37
|
|
(0.20) |
(0.16) |
(0.21) |
(0.17) |
(0.11) |
(0.09) |
|
|
[1.86] |
[− 3.87] |
[− 0.25] |
[− 14.26] |
[1.59] |
[− 9.00] |
|
|
Ind.Var
|
0.08 |
− 0.03 |
0.09
|
0.10
|
0.06
|
0.04
|
|
(0.08) |
(0.06) |
(0.05) |
(0.04) |
(0.02) |
(0.02) |
|
|
[1.76] |
[− 0.71] |
[2.08] |
[2.40] |
[1.49] |
[0.97] |
|
|
Model |
Logistic |
Beta |
Logistic |
Beta |
Logistic |
Beta |
|
Observations |
3,221 |
1,415 |
3,221 |
1,415 |
3,221 |
1,415 |
|
Log Likelihood |
− 2,125.90 |
89.05 |
− 2,190.66 |
85.96 |
− 2,191.82 |
84.90 |


Trump voter denotes a dummy with value one if the deciding participant is a Trump voter and zero if the deciding participant is a Clinton voter. Ind.Var. indicates the independent variable with is either the spite questionnaire, the feeling of closeness or the feeling of warmth. Models (1), (3), and (5) estimate the decision to behave spitefully or not with a logistic regression. Models (2), (4), and (6) estimate the decision on how spitefully to behave conditionally on behaving spitefully using a beta regression. Models (1) and (2) estimate the spite behavior using the spite questionnaire as the independent variable. Models (3) and (4) estimate the spite behavior using the social distance questionnaire as the independent variable. Models (5) and (6) estimate the spite behavior using the feeling thermometer as the independent variable. Standard errors are in parenthesis. Marginal effects (in%) are shown in brackets
 ;
;
 ;
;
 ;
;

Next, we analyze the attitudes of Trump and Clinton voters towards coinciding and opposing voters. For that purpose, we examine the social distance questionnaire (Fig. 2a) and the feeling thermometer (Fig. 2b).Footnote 33 It can be seen that on average ingroup-members are considered much closer compared to outgroup-members (t(3220) = 72.4,
 ). Specifically, we find a significant and substantial gap—2.24 point difference on a 7 point scale, or a relative decrease in closeness of 44%—in the participants’ attitudes towards fellow partisans and opposing voters. We also find that ingroup-members are felt much warmer towards compared to outgroup-members (t(3220) = 102.8,
 ). This again represents a significant and substantial difference—a 5.14 point difference on a 10 point scale, or a relative decrease in feeling of warmth of 77%—and provides again evidence for substantial polarization.Footnote 34
Result A1 Attitudes towards outgroup-members are substantially worse compared to the attitudes towards ingroup-members.
Similar to the antisocial behavior, it can be seen that the difference in social distance and the feeling of warmth between ingroup-members and outgroup-members is bigger for Clinton voters compared to Trump voters (t(3219) = − 13.7,
 , t(3219) = 16.7,
 ). This is, in particular, due to Clinton voters’ attitudes towards outgroup-members, as Clinton and Trump voters do not differ significantly in their attitudes towards ingroup-members. Specifically, Clinton voters express almost 17%, 15% more antipathy toward Trump voters than the reverse in the measures of social distance and feeling of warmth, respectively.
Result A2 Clinton voters show more negative attitudes towards their outgroup-members than Trump voters do.
Thus, in conclusion, we find similar patterns in attitudes and in spite behavior. Outgroup-members are considered as more distant/less warm, and the participants behave more spitefully towards their outgroup-members. Clinton voters behave more spitefully towards their outgroup-members compared to their ingroup-members while Trump voters are indifferent. A similar observation is made in attitudes: Clinton and Trump voters have comparable attitudes towards ingroup-members but Clinton voters have significantly worse attitudes towards their outgroup-members than Trump voters do.Footnote 35
3.4 Wave effects
As mentioned in the design section, we conducted the experiment in five waves: in late November 2016 (before the 58th US presidential election), late January 2017 (after the inauguration), late October 2018 (before the midterms), early November 2018 (after the midterms), and early January 2021 (after the 59th US presidential election).
Figure 3 shows the changes in spite behavior and attitudes between the waves. From Fig. 3, we can see that there are some minor changes over time, which, however, do not follow a clear pattern, nor are the changes substantial and really meaningful. One of the bigger changes is the spiteful behavior of Trump voters towards Trump voters from before the election in 2016 to early January 2021. Here we see a rather substantial increase (which, however, is not significantly different from zero). One possible explanation for this increase is the insurrection of the Capitol also in early January 2021, which might have been very salient at the time of the experiment and sparked particularly negative attitudes of Trump voters towards fellow Trump voters. Figure 6 in Electronic supplementary material shows all the pairwise comparisons between waves in spite behavior and attitudes. From Fig. 6, we see that for spite, no change is significantly greater than zero. A similar result is obtained for the social distance with the exception that Trump voters changed to slightly more positive attitudes towards Clinton voters from before the 58th US presidential election to after the 59th US presidential election—which however, represents a change of just 0.36 points on a 7 point scale. For the feeling of warmth, we see some significant changes over time which are mostly due to the relatively negative attitudes of Trump voters towards Clinton voters before the 58th US presidential election. The biggest change is observed from before the 58th US presidential election to after the 59th US presidential election. However, even this change (0.81 points on a 10 point scale) is relatively small.
We can conclude that for each subgroup and each of the relevant measures, there are no systematic or relevant changes. Thus, behavior and preferences seem to be rather stable over this 4-year period.Footnote 36
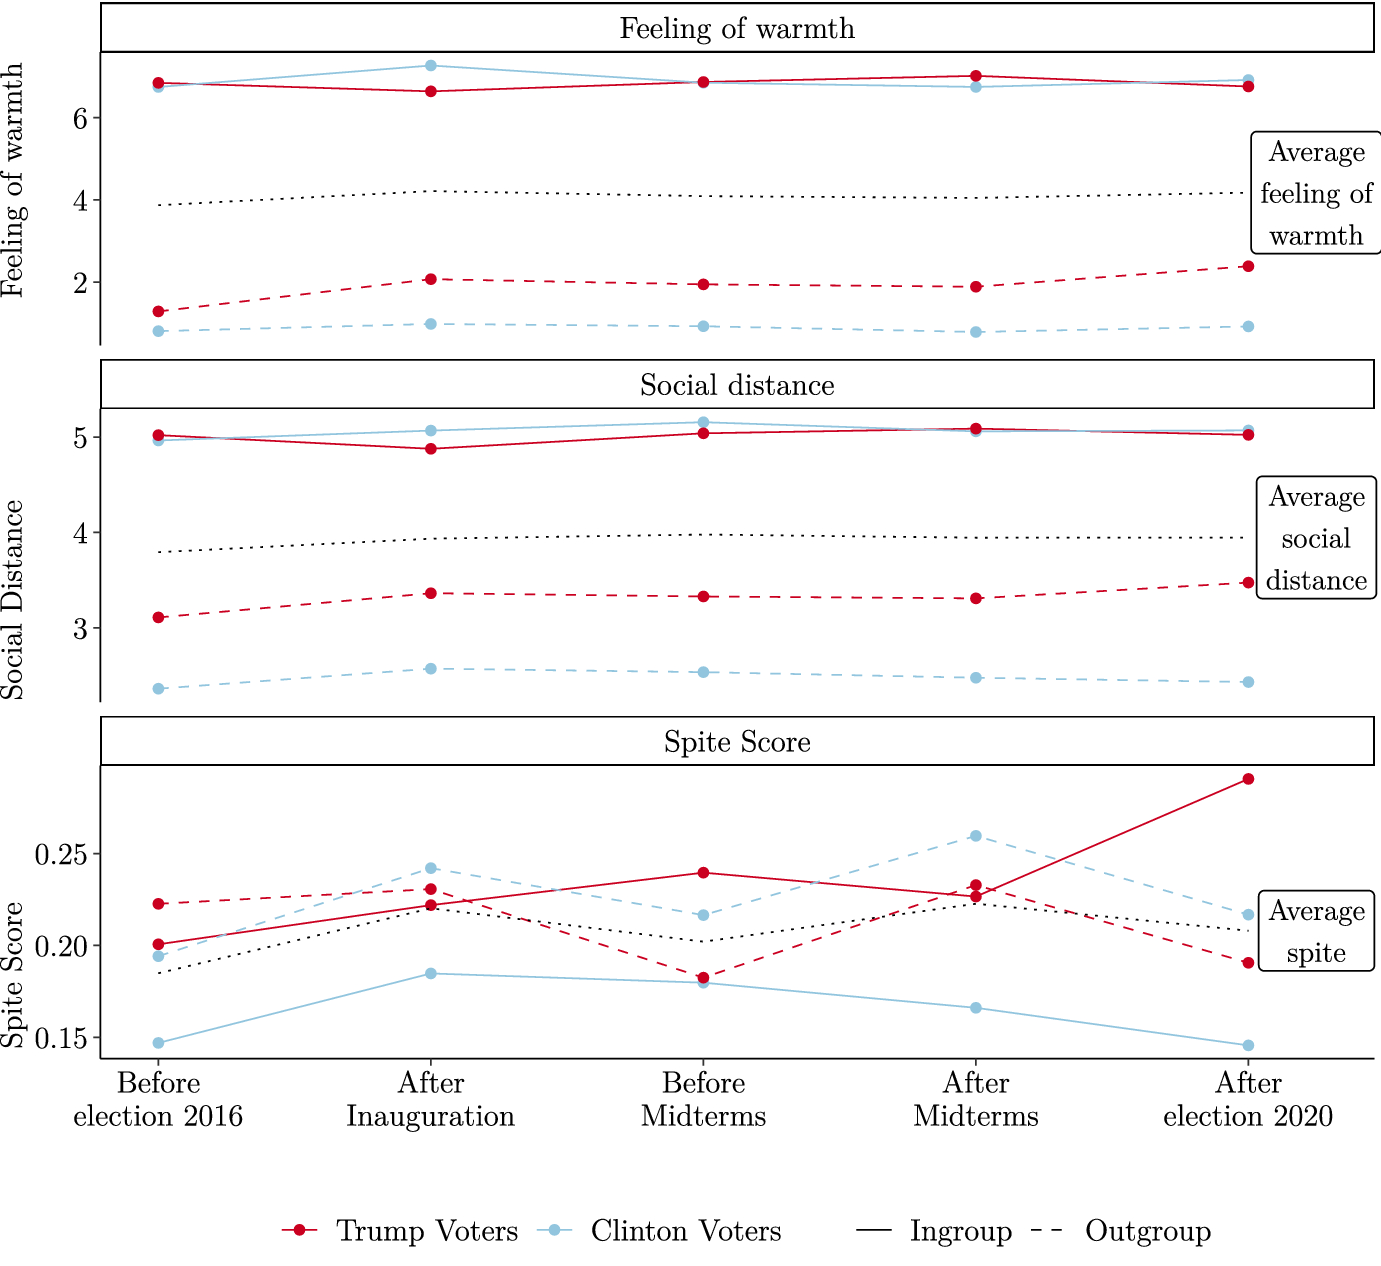
Fig. 3 Attitudes and spite over time. The figure depicts the spite behavior and attitudes over time (i.e., for each of the five waves). The panel on top represents the reported feeling of warmth. The panel in the middle represents the reported social distance. The panel on the bottom depicts the spite behavior. Black dotted lines show the average behavior/attitudes for each measure. Blue lines denote the behavior and attitudes of Clinton voters, while red lines represent the behavior and attitudes of Trump voters. Solid lines depict the behavior and attitudes towards ingroup-members (i.e., coinciding voter) while dashed lines depict the behavior and attitudes towards outgroup-members (i.e., opposing voter). The five waves were conducted: in late November 2016 (before the 58th US presidential election), late January 2017 (after the inauguration), late October 2018 (before the midterms), early November 2018 (after the midterms), and early January 2021 (after the 59th US presidential election). (Color figure online)
4 Discussion
This paper investigates whether partisanship—understood as the self-identified party affiliation—leads to dysfunctional behavior. In particular, we study which attitudes and, more importantly, which behavior voters show towards voters casting the same or the opposite vote. To the best of our knowledge, we are the first to study spite in a political context. For this purpose, we collected decisions of self-reported Clinton and Trump voters five times over a period of 4 years.
Most importantly, we were able to show that dysfunctional behavior—understood as the destruction of wealth—is significantly more likely if an opposing voter (outgroup) is impacted compared to a coinciding voter (ingroup). This effect is mainly driven by Clinton voters, who are significantly more likely to behave spitefully towards Trump voters compared towards fellow Clinton voters. This effect is not found for Trump voters—while Trump voters generally exhibit more spiteful behavior they do not differentiate between Trump voters and Clinton voters in their behavior.
These effects are supported by the attitudes of the voters: attitudes towards opposing voters are substantially and significantly more negative than attitudes towards coinciding voters. This effect is significantly stronger for Clinton voters. Further, the timing of the experiment does not substantially change attitudes, and it has no significant effect on dysfunctional behavior.
Several aspects of the results are worth elaborating on.
First, it is worth pointing out that we are not the first to find substantial polarization in the US (see Pew Research Center Reference Center2017a), but we are the first to show that this polarization leads to significantly increased destructive behavior (at least for Clinton voters). This is the main point of the paper, and this presents a significant and important contribution. We are able to show that even in a low key situation, like an online experiment, people are more likely to behave spitefully if matched with opposing voters. Hence, it seems plausible that in more salient situations where partisanship is even easier to detect and of more importance (e.g., collaborative work), the effect would be even stronger. More importantly, we know now that an increasing polarization leads to increased social and economic costs.
Second, it is interesting that the timing of the experiment hardly influenced attitudes and behavior. During this period Donald Trump won unexpectedly in 2016 and lost in 2020. However, these events seem not to spill over substantially into attitudes and behavior. This indicates that the destructive consequences of polarization are persistent and might be hard to eradicate.
Third, the differences between Clinton voters and Trump voters are worth elaborating on. On the one hand, it seems not too surprising that Trump voters did not differentiate between ingroup-members and outgroup-members because this would be perfectly in line with most papers on outgroup-bias who show that outgroup-bias lead rarely to purely hostile behavior (Brewer Reference Brewer1999, Reference Brewer, Sibley and Barlow2017; Balliet et al. Reference Balliet, Wu and Dreu2014). It is also not too surprising that attitudes towards opposing voters are negative because this has also been shown in other papers (Tajfel Reference Tajfel1970; Fowler and Kam Reference Fowler and Kam2007; Weisel and Böhm Reference Weisel and Böhm2015).
However, it is puzzling that Clinton voters have significantly less positive attitudes towards their outgroup-members compared to Trump voters. More importantly, Clinton voters behave relatively more spitefully towards outgroup-members compared to ingroup-members—which cannot be found for Trump voters. This result is particularly interesting in the sense that it does not only show a mere group identity effect (as our aggregate results are driven by Clinton voters only) but an effect of political identity. The asymmetry in destructive behavior between Clinton and Trump voters suggests that political identity functions differently than just plain group identity.
One possible explanation for the asymmetry in behavior is that Trump voters are considered morally wrong in supporting Donald Trump. In that case, Mummendey and Wenzel (Reference Mummendey and Wenzel1999) argue theoretically that “inferior” groups are more likely to experience discrimination and hostility. Similarly, Brewer (Reference Brewer1999) argues that negative discrimination might be present if participants are fighting for political power. Further support is provided by Parker and Janoff-Bulman (Reference Parker and Janoff-Bulman2013), who show that morality based groups lead to less positive emotions. More importantly, Weisel and Böhm (Reference Weisel and Böhm2015) demonstrate a significant increase in help avoidance if the group difference is morality-based: “When given the chance to benefit a strong-enmity outgroup, and even more so a morality-based outgroup, many group members decline to do so” (Weisel and Böhm Reference Weisel and Böhm2015, p. 118). In Online Appendix we discuss differences in ascribed morality between Clinton and Trump voters in our experiment. We find that Clinton voters consider Trump voters substantially less moral than vice versa. In parallel, polls also reveal that a majority of Democrats express to feel angry going into the midterm elections of 2018 while only 30 percent of Republicans say the same.Footnote 37 This indicates that the group difference might be morality-based and consequently drive hostile behavior.
Another possible explanation for the heterogeneous effects between Clinton and Trump voters is the expectation of Clinton voters that Trump voters will generally behave more spitefully and therefore retaliate in expectation. Trump voters on the other hand just generally are more prone to spiteful behavior independent of the opponent. Thus, Clinton voters just increase their spiteful behavior to match the spiteful behavior of Trump voters, which results in a heterogeneous effect.
However, these explanations are only conjectures and it might be valuable for future research to take a closer look at the justifications and motivations of Clinton and Trump supporters to engage in hostile behavior.
While we believe the results to be robust, some possible limitations should be noted. First, our experiment might be prone to experimenter demand effects as the opponent’s political orientation is made salient. While this saliency is essential for the treatment to work, it might reveal the experiment’s purpose and, thus, lead participants to shift their behavior. To obtain a bound on a possible demand effect we conducted a demand-effect treatment as suggested in de Quidt et al. (Reference de Quidt, Haushofer and Roth2018) and reported in detail in Online Appendix. Inducing demand does not change the behavior in our setting.Footnote 38 Thus, while a demand effect cannot be excluded, we find that inducing a demand effect does not alter the behavior of participants substantially. Another limitation of our experiment is the non-representativeness of our sample. While our sample is much more representative of the US population than typical student samples, it is still not representative of the US population, as discussed in detail in supplementary material. Thus, such a selection might bias our results and reduce the generalizability of our findings. In Online Appendix, we try to deal with this issue by adjusting the weights of our estimations to make our sample artificially representative. While our results remain robust, we cannot exclude the possibility that our findings would differ using a representative sample. A similar concern is that sampling Trump and Clinton voters via MTurk might be problematic as, for example, Trump voters on MTurk are different from Trump voters in the general population. Reassuringly Huff and Tingley (Reference Huff and Tingley2015) show that Mturkers behave similarly to the general population with regard to their voting behavior and suggest that Mturk is a great source to study voters. Further, we find striking similarities in demographics and voting patterns between our sample and nationally representative samples as discussed in supplementary material. Nevertheless, we should caution the reader that we cannot exclude the possibility that, for example, Clinton voters on Mturk are particularly spiteful compared to Clinton voters in general. It is also worth pointing out that we made our treatment rather salient by providing the political identity of their opponents to participants. While this was essential for the experiment it might reduce generalizablity. Partisan affiliation would most likely be less salient in the vast majority of human interaction. Thus, our experiment might not speak to everyday situations but primarily to environments where political identity is salient (such as around elections, rallies, etc.). Another concern we have to think about is possible spillover effects between the auction experiment (which is reported in Mill and Morgan (Reference Mill and Morgan2020)) and the main task of this experiment (the spite task). It is possible that conducting an auction prior to the spite task might have increased spiteful behavior as participants might have been put into a competitive frame. Behavioral spillovers are discussed in detail in Dolan and Galizzi (Reference Dolan and Galizzi2015). In particular, Cason and Gangadhara (Reference Cason and Gangadhara2012), and Savikhin and Sheremeta (Reference Savikhin and Sheremeta2012) find spillover effects between competitive games and cooperative games. However, we have two “competitive” games, which most likely will reduce the spillover effect. Further, we can see that the behavior in the SVO-task reported in Online Appendix is very similar to behavior reported in other studies (see also Footnote 19) which indicates that behavior has not been influenced substantially. More importantly, while such a spillover effect might shift overall behavior towards more spite, this spillover effect is identical between the treatments and also influences Clinton and Trump voters arguably to the same extend.Footnote 39 Thus, while the absolute level of spite might have been affected by the auction, the auction is unlikely to account for our heterogeneous results.
Given the growing polarization in the US, it is essential to understand which further-reaching consequences it has. This question is particularly relevant with regard to destructive behavior as it might reduce our societal progress, threaten our democratic values, and potentially curtail economic growth. Overall, the central message of this paper is: political polarization might boost destructive behavior. Increasing polarization not only manifests itself in differences in attitudes but also results in destructive behavior. The goal of future research has to be to figure out how to combat such destructive behavior and how to mitigate the political division.
Funding
Open Access funding enabled and organized by Projekt DEAL.


 Open access