


1 Introduction
The concept of rationality holds a central role in modern economic theory (Sugden Reference Sugden1991). Both in individual decision making and in strategic interactions, choices are considered rational when they maximize the decision maker’s expected utility. Individuals’ preferences and utility functions are, however, not directly observable. The Generalized Axiom of Revealed Preferences (GARP) sets conditions such that rationality can be judged by observing choices and choice sets. In particular, if choices satisfy the GARP, they can be explained as the outcome of the maximization of a well behaved utility function (Afriat Reference Afriat1967).Footnote 1
In this paper we test whether people are capable of making rational economic choices, i.e. choices consistent with GARP, when deciding under stress. Stress is the response to environmental challenges that are potentially threatening or harmful. Importantly, such response cannot be controlled by human will (Goldstein and McEwen Reference Goldstein and McEwen2002; Dickerson and Kemeny Reference Dickerson and Kemeny2004). Stress can be triggered by a psychological stressor (such as giving a public speech or an exam) or a physiological one (such as being exposed to very cold/hot temperatures, pain and injury). In this paper we only manipulate the latter type of stress, but it is worth noting that both types of stress can induce psychological and physiological responses, which are mutually affected and hard to disentangle (McRae et al. Reference McRae, Saladin, Brady, Upadhyaya, Back and Timmerman2006; Skoluda et al. Reference Skoluda, Strahler, Schlotz, Niederberger, Marques, Fischer, Thoma, Spoerri, Ehlert and Nater2015).
Exposure to stress is a prominent feature of everyday life. It has been shown that stressors have a major influence upon mood and subjective wellbeing (van Eck et al. Reference van Eck, Berkhof, Nicolson and Sulon1996), risk attitudes (e.g. Cahlíková and Cingl Reference Cahlíková and Cingl2017; Buckert et al. Reference Buckert, Schwieren, Kudielka and Fiebach2014; Porcelli and Delgado Reference Porcelli and Delgado2009), prosocial behavior (von Dawans et al. Reference von Dawans, Fischbacher, Kirschbaum, Fehr and Heinrichs2012) and health (Schneiderman et al. Reference Schneiderman, Ironson and Siegel2005). Stressful conditions also interfere with deliberative processes and induce decision-makers to fall back on intuitive responses that require few cognitive resources (see Yu Reference Yu2016, and references therein). The use of such intuitive thinking modes, as opposed to deliberative ones, increases cognitive biases (Kahneman and Egan Reference Kahneman and Egan2011) and reduces people’s patience (Haushofer and Fehr Reference Haushofer and Fehr2014). In this paper we investigate whether there is a causal effect of exogenously induced physiological stress on economic rationality.
There is a limited empirical literature testing the consistency of individuals’ choices with GARP. Studies conducted with student samples from different universities (Cappelen et al. Reference Cappelen, Kariv, Sorensen and Tungodden2014; Choi et al. Reference Choi, Fisman, Gale and Kariv2007a), among primary school kids (Harbaugh et al. Reference Harbaugh, Krause and Berry2001) and with a representative sample of the Dutch population (Choi et al. Reference Choi, Kariv, Müller and Silverman2014), show that economic rationality varies markedly across different socio-demographic groups. Only a few studies have focused, however, on the vulnerability of GARP to contextual factors. Burghart et al. (Reference Burghart, Glimcher and Lazzaro2013) find that individuals with a high concentration of alcohol in blood are no less rational than sober individuals, but this evidence is purely correlational as the intake of alcoholic drinks was not randomized in their study. Castillo et al. (Reference Castillo, Dickinson and Petrie2017) observe that consistency with GARP is not affected by whether individuals make decisions at a time that fits their (self-reported) circadian rhythm. The paper by Drichoutis and Nayga (Reference Drichoutis and Nayga2017) comes probably closest to ours. The authors study whether individuals’ consistency with GARP is affected by the cognitive load induced by a memorizing task. They find that cognitive load has adverse effects on performance in reasoning tasks, but observe no effect of cognitive load on consistency with GARP. To the best of our knowledge, our study is the first providing a direct test of the causal effect of stress on economic rationality.
To answer our research question, we conduct a laboratory experiment where participants are randomly assigned to one of two stress-related treatments: Stress or No Stress. In the Stress treatment, participants are administered the Cold Pressor Test (CPT), which requires to immerse ones’ dominant hand into a bucket of ice–cold water (approximately 4 °C) for 90 s. The CPT is an effective way to induce stress, as the pain of enduring a physically unpleasant situation typically produces a sharp increase in participants’ subjective stress as well as levels of cortisol, the human body’s stress hormone (see, e.g., Delaney et al. Reference Delaney, Fink and Harmon2013; Schoofs et al. Reference Schoofs, Wolf and Smeets2009). Participants in the No Stress treatment are asked to put their dominant hand in a bucket of lukewarm water (30–35 °C) for 90 s. Throughout the experiment, we measure participants’ stress levels by assessing the concentration of cortisol in saliva (e.g., Vining et al. Reference Vining, McGinley, Maksvytis and Kian1983; Kirschbaum and Hellhammer Reference Kirschbaum and Hellhammer1989). Cortisol reacts to both physical and psychological stressors through the autonomic nervous system and the hypothalamic–pituitary–adrenal axis (Dickerson and Kemeny Reference Dickerson and Kemeny2004) and it can be accurately measured in saliva.
After the experimental manipulation, we measure the extent to which participants make choices consistent with GARP. Participants face fifty independent economic decision problems that involve allocating money between two accounts, knowing that the amount of money in each account is paid out with probability 50% (Choi et al. Reference Choi, Fisman, Gale and Kariv2007a, Reference Choi, Fisman, Gale and Karivb, Reference Choi, Kariv, Müller and Silverman2014). The decision problems thus require to make tradeoffs between risk and returns, a feature which is common to many decisions outside the laboratory. Each of the fifty decision problems differ in the rate at which participants could transfer money from one account to the other and in the total amount of money to allocate. These variations generate a rich dataset that we use to assess how consistent individuals’ choices are with GARP (Choi et al. Reference Choi, Fisman, Gale and Kariv2007a, Reference Choi, Fisman, Gale and Karivb, Reference Choi, Kariv, Müller and Silverman2014).
We find that physiological stress significantly increases participants’ cortisol levels but does not change the consistency of their choices with GARP. This result is robust to accounting for the natural decline of cortisol over time and to considering four different ways of quantifying inconsistencies with GARP. Furthermore, simulated choice behavior shows that our results cannot be attributed to participants choosing randomly.
As robustness check, we test two plausible alternative mechanisms that could drive this result other than the direct effect of stress. First, the lack of an effect of stress on rationality could be due to a change in risk preferences. Since GARP is easier to satisfy under risk neutral preferences, this could happen if the stressor induced participants to act more risk neutral. We find that the stressor does not significantly change risk preferences and, moreover, risk preferences are not systematically correlated with violations of GARP.Footnote 2
Second, our results could in principle be explained by the timing in which participants start the decision-making task. Since cortisol levels take some time to react, participants start the economic task 20 min after the cessation of the stressor. However, while the cortisol reaction to stressors is delayed, physiological responses to stressors are complex and start within seconds after the exposure to stress. Our design does not allow us to study the immediate effects of stress on rationality. In order to test for such effects, we conduct a second experiment where we use the same protocol of the first experiment but we eliminate the time gap between the stressor and the decision-making task. The results of this second experiment by and large confirm that stress has no significant negative impact on economic rationality, even when participants start making decisions right after experiencing a stressor. If anything, immediate responses to stress seems to improve economic rationality.
Overall, our analysis provides strong empirical evidence that economic rationality, defined as consistency with GARP, does not get impaired by physiological stress.
The reminder of this paper is organized as follows. Section 2 describes the experimental design and Sect. 3 describes how economic rationality is measured. We present our results in Sect. 4, and in Sect. 5 we compare them to those of the second experiment, when there is no delay between the stressor and the economic task. A discussion and conclusions are presented in Sect. 6.
2 Experimental design
Within each experimental session, participants are randomly assigned either to the Stress treatment or to the No Stress treatment. The experiment includes two main parts: in the first part, we manipulate participants’ stress levels, in the second part we measure whether participant’s choices in an economic task are consistent with GARP.Footnote 3 Saliva samples are collected at different points in time to monitor how stress levels change during the experiment. In what follows we describe the experiment in detail.
Once participants arrived at the laboratory, they are asked to read and sign an informed consent form. In order to avoid revealing the purpose of the experiment, participants receive information only about the condition to which they are assigned. Participants are allowed to stop participating in the experiment at any time, without providing any explanation to the experimenter.Footnote 4
At the beginning of the experiment, participants provide the first saliva sample by spitting in a small tube. The concentration of cortisol in this sample provides a baseline value to later evaluate the effectiveness of our treatment manipulation.
Thereafter, participants are instructed to immerse their dominant hand, including the wrists, into a bucket of water for 90 s or, otherwise, until they could no longer tolerate it. Those in the Stress treatment, did so in a bucket with ice–cold water (4–6 °C). Participants in the No Stress treatment use a bucket with pleasantly warm water (30–35 °C). The difference between the Stress treatment and No Stress treatment solely lies in the temperature of the water. This procedure, called Cold Pressor Test, is a well-established way to increase cortisol levels without putting the respondent at risk. Cortisol typically peaks 20–30 min after the cessation of the stressor (Weitzman et al. Reference Weitzman, Fukushima, Nogeire, Roffwarg, Gallagher and Hellman1971; Pruessner et al. Reference Pruessner, Wolf, Hellhammer, Buske-Kirschbaum, Von Auer, Jobst, Kaspers and Kirschbaum1997; Selmaoui and Touitou Reference Selmaoui and Touitou2003; Debono et al. Reference Debono, Ghobadi, R-H, Huatan, Campbell, Newell-Price, Darzy, Merke, Arlt and Ross2009). Therefore, we collect two saliva samples after the stress manipulation: one immediately after participants take the hand out of the bucket and one after 20 min, which is shortly before the start of the second part of the experiment. In order to avoid downtime until the start of second part of the experiment, participants answer a questionnaire on demographics, health habits, risk attitudes, personality traits and their general feelings. The only purpose of this questionnaire was to keep participants busy while waiting for the second part of the experiment.Footnote 5
The second part of the experiment starts 20 min after the stress manipulation. First, we collect the third saliva sample of the experiment. Thereafter, we ask participants to make fifty choices involving economic trade-offs. In Sect. 3 we explain how these fifty choices are used to measure participants’ degree of economic rationality defined by choice consistency with GARP. The economic decision problems are presented using the computerized graphic design developed by Choi et al. (Reference Choi, Fisman, Gale and Kariv2007a, Reference Choi, Fisman, Gale and Karivb, Reference Choi, Kariv, Müller and Silverman2014). For each decision problem, participants have to allocate money between two accounts (labeled BLUE and RED respectively), knowing that the amount of money in each account is paid out with probability 50%. The experimental currency unit is points which are converted to Euro at the exchange rate of 8 points = 1 Euro.
Figure 1 provides an example of a typical decision problem. Participants have to choose a point xi on the A–B budget line by clicking with the mouse on it. In this example, the expected payoff of choices decreases from A to B and hence choosing point A, i.e. allocating all the money into the RED account, yields the maximum expected payoff. However, since each account is paid out with probability 50%, participants who are risk averse may choose to allocate some money to the BLUE account to ensure themselves a minimum payoff. The slope of the A–B budget line determines how much money in the RED account a participant must give up to allocate one additional monetary unit to the BLUE account. Equal allocation to the two accounts, represented by point C on the 45° line, eliminates risk completely.Footnote 6 Furthermore, for any degree of risk aversion, all allocations on the C–B line are dominated by allocations on the A–C line.

Fig. 1 Example of a decision problem
Participants face fifty independent decision problems similar to that shown in Fig. 1. Each decision problem differs in the slope of the A–B line and/or its intercepts. Specifically, each problem starts with the computer randomly selecting a budget line from the set of lines that intersect at least one of the axes at 50 or more points, and with no intercept exceeding 100 points. The budget lines selected for each subject in different decision problems are independent of each other and of the sets selected for any other subject in the experiment. At the end of the experiment, the computer program randomly selects one of the fifty choices for payment. Once all fifty choices are made, participants provide the last saliva sample and answer a short questionnaire. Saliva samples are frozen at − 80° C after collection and subsequently sent to the laboratory of the Faculty of Social and Behavioral Sciences of the University of Amsterdam for cortisol measurement.
A total of 100 participants are recruited through an online system to participate in the experiment, 56 (28 male and 28 female) are randomly assigned to the Stress treatment and 44 (18 male and 26 female) to the No Stress treatment. During the recruitment, participants are informed that they would not be allowed to do sports, smoke and take food and beverages at least an hour before the experiment, because such activities are known to potentially influence cortisol levels. Participants are also reminded about this before the experiment. The experiment is programmed in z-Tree (Fischbacher Reference Fischbacher2007) and conducted in June 2017 at the CentERlab of Tilburg University, in the Netherlands. We conduct six experimental sessions, between twelve and twenty participants take part in each session.Footnote 7 Each session lasts approximately 90 min in total, of which 41 min on average are used for the economic task. The average earnings are 9.4 Euro. Participants receive their earnings via bank transfer at the end of the experiment.
Our experimental protocol was approved by the Ethics Review Board of the School of Social and Behavioral Sciences of Tilburg University. The Ethics Review Board evaluated the project on the following dimensions: (1) plausible scientific background and rationale for the number of participants (e.g., statistical power); (2) risk–benefit balance for the research participants (inclusion and exclusion criteria, age, and ability to give informed consent, appropriateness of the reward/compensation, participant burden, potential risks and how these risks are minimized); (3) privacy and confidentiality; and (4) data use and storage. The procedures of the Ethics Review Board can be found at: https://www.tilburguniversity.edu/research/social-and-behavioral-sciences/erb. In our application for approval, we addressed the items listed above, and specifically addressed the participant burden and potential risks related to the cold exposure. We mentioned that a conservative time limit was set at 90 s cold exposure and that participants had the opportunity to discontinue participation when they experience too much discomfort. This was also mentioned in the informed consent document.
3 Consistency of choices with GARP
GARP demands that an individual’s choices display a certain degree of consistency. For instance, when an individual chooses option x when faced with a choice between options x and y, it would be surprising if y is chosen when the set of alternatives includes x. The idea is that the initial choice of x reveals a predisposition to choose x over y that should be robust to the inclusion of different alternatives in the choice set (Mas-Colell et al. Reference Mas-Colell, Whinston and Green1995). Stated more formally: Let X, Y be distinct bundles of alternatives, each lying on a linear budget constraint. GARP requires that if X is (indirectly) revealed preferred to Y, then Y is not strictly directly revealed preferred to X, that is, X is not strictly within the budget set when Y is chosen (Varian Reference Varian1982).
GARP is of fundamental importance for economic theory because if, and only if, choices satisfy GARP they can be rationalized as the outcome of the maximization of a “well-behaved” utility function (Afriat Reference Afriat1967). Empirically, it is likely that choice data violate GARP to some extent and it is thus necessary to have a criteria that evaluates to which degree the data are consistent with the axiom. In what follows, we describe four measures that allow inferring individuals’ degree of economic rationality from choice data.Footnote 8
Following Cox (Reference Cox1997), we first present a simple count of the frequency of inconsistent decisions, i.e. for each individual we count how many decisions are actual violations of GAPR. We then introduce three indexes which provide different measures of the consistency of choices with GARP: the Houtman and Maks Index (HMI), which measures the largest subset of choices consistent with GARP, the Critical Cost Efficiency Index (CCEI) which reflects the minimum adjustments required to eliminate all violations of GARP, and the Unified Critical Cost Efficiency Index (UCCEI), which additionally requires that choices do not violate first order stochastic dominance.
3.1 Number of violations of GARP
Violations of GARP are defined as follows: let xi denote the quantity vector, that is the amount of points allocated to the two accounts, and pi denote the price vector, that is the prices of points in the two accounts. R denotes the revealed preference relation. Then an inconsistent pair of revealed preferences such that xaRxb, pbxb > pbxa and xbRxa, paxa > paxb would constitute two violations of GARP. In contrast, inconsistent revealed preferences such that xaRxc, pcxc > pcxa and xcRxa, paxa < paxc would be reported as one violation of GARP (Cox Reference Cox1997). The total number of potential violations of GARP is the number of all paired choices in the dataset.Footnote 9
3.2 The Houtman–Maks Index (HMI)
The Houtman and Maks Index (Reference Houtman and Maks1985) measures the largest subset of choices that is consistent with GARP, which indirectly indicates the number of choices that violate GARP. Violations are defined in the same way as described in subsection 3.1 above. Since the algorithm by Houtman and Maks is not computationally feasible for large datasets, we use a simpler algorithm introduced by Heufer and Hjertstrand (Reference Heufer and Hjertstrand2015) to compute the HMI.Footnote 10
3.3 The Critical Cost Efficiency Index (CCEI)
The CCEI reflects the minimum adjustments required to eliminate all violations of GARP associated with the choice data (Afriat Reference Afriat1972). The CCEI is defined between 0 and 1, where 1 corresponds to a fully rational set of choices. A CCEI of, for example, 0.80 indicates that on average budget sets need to be shifted by 20% to reconcile all choices with GARP.
The construction of the CCEI for a violation of GARP is illustrated in Fig. 2. The figure shows a pair of choices, xa and xb, in which xa is directly revealed preferred to xb and vice versa, so that GARP is violated. The choice inconsistency can be removed in two ways: the line going through bundle xa is shifted from B to A, such that xb is directly revealed preferred to xa. Alternatively, the line going through xb is moved from D to C, in a way that xa is directly revealed preferred to xb. The shift from D to C is the smallest perturbation necessary to restore consistency with GARP, and the CCEI for this choice is thus defined as C/D.
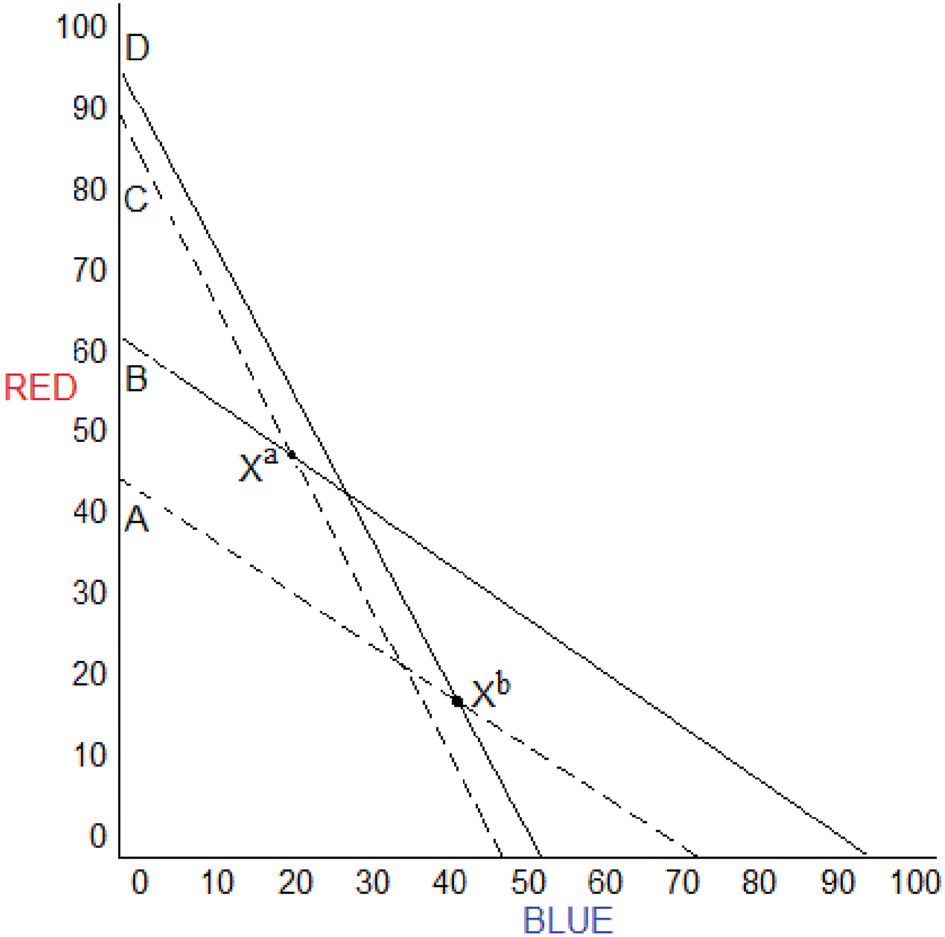
Fig. 2 The CCEI for a simple violation of GARP
3.4 Unified Critical Cost Efficiency Index (UCCEI)
Using CCEI as a measure of economic rationality has some limitations. Choices that violate first order stochastic dominance, and that hence do not maximize payoff in the experiment, may nevertheless be consistent with GARP. For instance, an individual who allocates all the money to the BLUE account in all the decision problems, is consistent with GARP although she is not maximizing her payoff when the BLUE account is more expensive than the RED. Since the CCEI score does not capture the extent to which choices violate stochastic dominance, we also analyze choice data using the Unified Critical Cost Efficiency Index (UCCEI), which captures both violations of GARP and of stochastic dominance (Choi et al. Reference Choi, Kariv, Müller and Silverman2014).
The UCCEI is constructed by adding all mirror image allocations to the dataset. These are created by reversing the BLUE and RED prices and the associated allocation in each decision problem, while the payoff from the actual and mirror image allocations is the same. In this augmented dataset, stochastically dominated choices in combination with their mirror image violate GARP. Differently, choices that do not violate stochastic dominance do not violate GARP when compared to their mirror image. The UCCEI is thus equivalent to the CCEI calculated on an enlarged database, and by construction it is at most as large as the CCEI associated to the actual data.
Figure 3 illustrates how the UCCEI is constructed. In the figure, line AB represents a decision problem where the RED account is cheaper than the BLUE. Any decision to allocate fewer points to the cheaper account, that is a choice on the B–C line, violates stochastic dominance. Assuming that allocation xd is observed, we can construct the mirror image allocation xd′. The pair of choices xd and xd′ violates GARP, and thus decrease the CCEI score. Any choice along A–C does not violate stochastic dominance, and hence any pair of choices on A–C and their mirror image does not violate GARP.

Fig. 3 A violation of stochastic dominance
4 Results
4.1 Cortisol response to stress
Figure 4 shows average cortisol levels standardized by individual baseline values. Since baseline cortisol levels typically vary substantially across individuals, standardization helps visualizing the effectiveness of the stress manipulation. Recall that sample 1 is collected at the beginning of the experiment, sample 2 is taken right after the stress manipulation, sample 3 is taken 20 min after it and sample 4 is collected after participants finished making all economic choices.

Fig. 4 Standardized cortisol levels with 95% confidence intervals
Figure 4 shows that our treatment manipulation is effective: cortisol increases on average by 50% in sample 3 compared to sample 1 in the Stress treatment. In contrast, participants in the No Stress experience a slight decrease in cortisol during the experiment.
We test whether cortisol levels change significantly within treatments using the Wilcoxon matched-pairs signed-rank test. In the Stress treatment, the cortisol level in sample 3 is significantly higher than in all the other samples (p < 0.01 in pair-wise comparisons). In particular, 20 min after the stressor, cortisol increases by 47% compared to the standardized baseline.Footnote 11 This is similar to the percentage increase observed in other studies (e.g. 43% in Sharpley et al. Reference Sharpley, Kauter and McFarlane2009, 50% in Schwabe and Wolf Reference Schwabe and Wolf2009 and 44% in Buser et al. Reference Buser, Dreber and Mollerstrom2017). There are no significant differences in cortisol levels between sample 1 and sample 2 (p = 0.68), sample 1 and sample 4 (p = 0.24), sample 2 and sample 4 (p = 0.43). In the No Stress treatment, cortisol levels show a decreasing trend: from sample 1 to sample 2 (p = 0.05), from sample 2 to sample 3 (p = 0.26), from sample 3 to sample 4 (p < 0.01).
In order to test whether cortisol concentrations differ between the Stress and the No-Stress treatment, we use the two-sample Wilcoxon rank-sum test. Cortisol concentration in sample 2 is similar in the two treatments (p = 0.12). In contrast, cortisol levels measured 20 min after the stress manipulation are significantly higher in the Stress than in the No Stress treatment (p < 0.01). The difference in cortisol levels between treatments persisted after participants completed the economic decision problems (p = 0.09).
4.2 Economic rationality
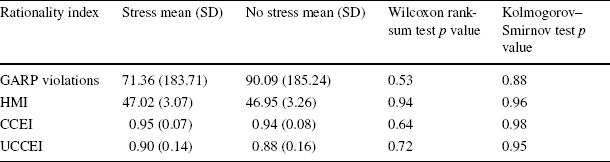
Table 1 shows means and standard deviations of the main four measures of economic rationality by treatment, along with the p values of the two statistical tests we use to test for treatment differences.
Table 1 Rationality measures by treatment
|
Rationality index |
Stress mean (SD) |
No stress mean (SD) |
Wilcoxon rank-sum test p value |
Kolmogorov–Smirnov test p value |
|---|---|---|---|---|
|
GARP violations |
71.36 (183.71) |
90.09 (185.24) |
0.53 |
0.88 |
|
HMI |
47.02 (3.07) |
46.95 (3.26) |
0.94 |
0.96 |
|
CCEI |
0.95 (0.07) |
0.94 (0.08) |
0.64 |
0.98 |
|
UCCEI |
0.90 (0.14) |
0.88 (0.16) |
0.72 |
0.95 |
As is clear from Table 1 we find no significant difference in rationality between treatments, no matter which rationality measure we consider. On average, participants in the Stress treatment display about 71 violations of GARP, while participants in No Stress display a larger, although not statistically different, number of violations (90 violations). Since the number of violations is directly related to the HMI, it naturally follows that we also do not observe treatment differences when considering the HMI.
The CCEI of participants in the (No) Stress treatment is (0.94) 0.95, which is in line with the CCEI estimated for other university students samples.Footnote 12 As expected, the UCCEI is lower than the CCEI, as the latter takes also violations of first order stochastic dominance into account. In Appendix B we show that our results are also robust to other two alternative indeces of economic rationality proposed by Varian (Reference Varian1990, Reference Varian1991) and Echenique et al. (Reference Echenique, Lee and Shum2011).
Figure 5 shows the distribution of the four rationality measures by treatment. The figure shows that although most participants in our experiment are not fully rational, their choice behavior is very close to satisfying GARP, even under stressful conditions.

Fig. 5 Distribution of rationality measures
Column 5 of Table 1 confirms that all the four rationality measures are similarly distributed in the two treatments.
Taken together, these results thus show that stressful conditions do not have an impact on participants’ ability to make rational economic choices.Footnote 13
The high observed consistency of choices raises the question of whether satisfying GARP is a rather undemanding requirement. To put this conjecture to test, we generate two samples of respectively 100 and 25.000 simulated individuals that choose randomly in 50 decision problems of the type implemented in the experiment. For the purpose of conducting such a robustness test we summarize violations only using the CCEI, as it is the most common measure in the literature. Figure 6 shows the distribution of the CCEI scores in our experiment and in the two simulated samples. Clearly, economic rationality is much higher among participants in our experiment than in the simulated samples. In both simulated samples, the average CCEI is 0.64 and no participants have a CCEI above 0.95. It is therefore very unlikely that the degree of economic rationality observed in our experiment is attributable to random choice behavior.
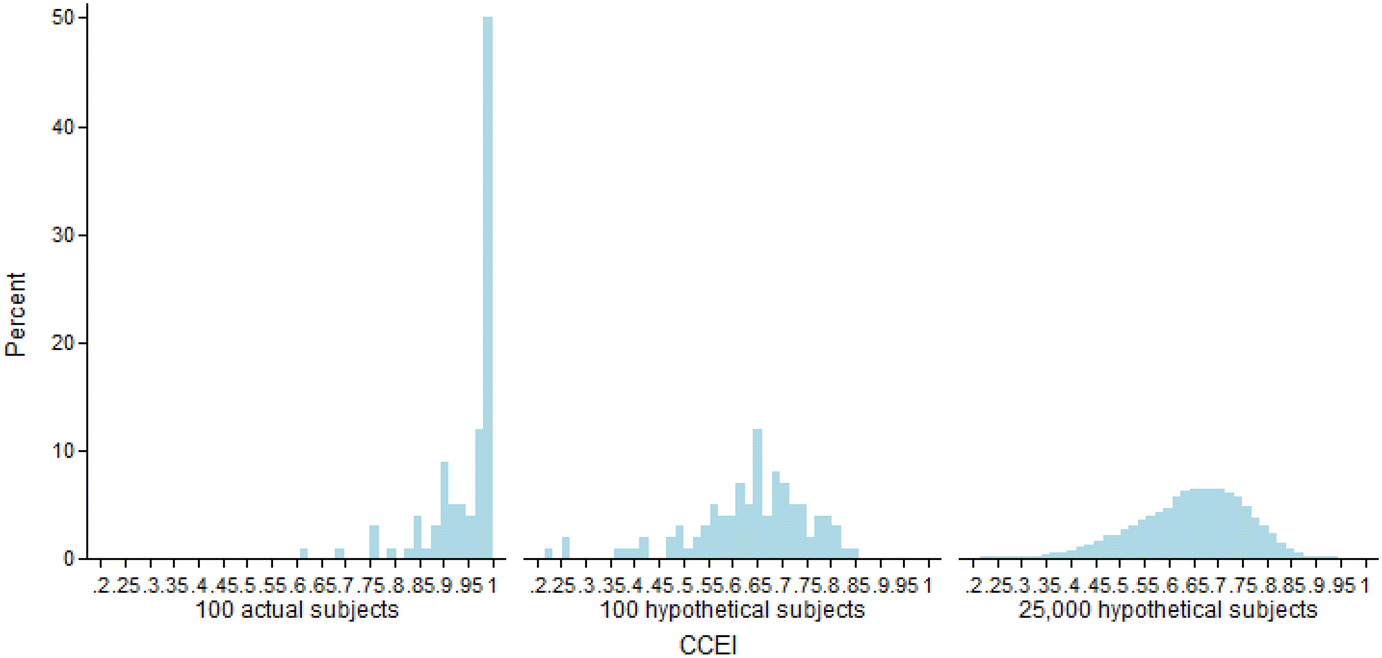
Fig. 6 Distribution of CCEI of actual data and hypothetical subjects
Note that the conclusion that stress does not reduce economic rationality is most likely not due to lack of statistical power. Our data show that if anything, stress slightly increases consistency with rationality (CCEI = 0.94 in No Stress treatment, CCEI = 0.95 in Stress treatment) rather than reducing it. Hence, even if we were to enlarge the sample size there would be no a priori reason to expect that the direction of the result would change.Footnote 14
At last, we analyze whether economic rationality responded to the gradual decrease of cortisol over the time during which economic decisions were taken. Does rationality increase with the reduction of cortisol in the body? To answer this question, we compute the CCEI score for the first 10, 20, 30, 40 and 50 economic decisions. As Table 2 shows, we do not find statistically significant differences between treatments in any group of economic decisions. We thus conclude that economic rationality is quite stable with respect to the fluctuations in cortisol levels during the experiment.
Table 2 CCEI scores by group of decisions

|
Decisions |
Stress mean (SD) |
No stress mean (SD) |
Wilcoxon rank-sum test p value |
Kolmogorov–Smirnov test p value |
|---|---|---|---|---|
|
1–10 |
0.99 (0.04) |
0.98 (0.05) |
0.75 |
0.99 |
|
1–20 |
0.98 (0.05) |
0.97 (0.06) |
0.51 |
0.75 |
|
1–30 |
0.97 (0.05) |
0.95 (0.07) |
0.37 |
0.38 |
|
1–40 |
0.96 (0.06) |
0.94 (0.08) |
0.34 |
0.67 |
|
1–50 |
0.95 (0.07) |
0.94 (0.08) |
0.64 |
0.98 |
4.3 Risk preferences
Individuals’ choices in the economic task also reveal their risk preferences. Like Choi et al. (Reference Choi, Kariv, Müller and Silverman2014) and Cappelen et al. (Reference Cappelen, Kariv, Sorensen and Tungodden2014), we measure risk preferences by looking at the fraction of total points that an individual allocates to the cheaper account, without making any assumption on the parametric form of individuals’ utility function.Footnote 15 At the two extremes, allocating all the points to the cheaper account reveals risk neutral preferences, while allocating the points equally between the two accounts completely eliminates risk and is consistent with infinite risk aversion. Generally, the smaller the fraction of points that individuals allocate to the cheaper account, the more risk averse they are.
We find that individuals in Stress allocate on average a fraction of 0.72 points to the cheaper account, while individuals in No Stress are slightly more risk averse and allocate on average 0.70 points to the cheaper account. These differences are not statistically significant (Wilcoxon rank-sum test p = 0.42), which suggests that being exposed to physiological stress has only moderate effects on risk preferences.
At last, we test whether risk preferences are systematically related to consistency with GARP. This may be the case because satisfying GARP can be less demanding for participants who are risk neutral, and therefore allocate all points either on the x or y axis, compared to participants who are very risk averse, and thus choose allocations close to the 45° degree line. We find that risk preferences and CCEI scores are effectively uncorrelated in both treatments (Pearson’s correlation ρ = − 0.01, p = 0.95 in No Stress; ρ = − 0.05, p = 0.70 in Stress). This result is also found in Choi et al. (Reference Choi, Kariv, Müller and Silverman2014).
5 Experiment on immediate stress responses
Since our measurement of stress relies on cortisol concentrations, we chose to have a 20-min gap between the end of the CPT and the economic task to allow for cortisol to peak in response to the stressor.Footnote 16 However, we acknowledge that the timing of the decision with respect to the stressor could potentially affect results: while the cortisol reaction is delayed, the physiological response to stressors is complex, and the response of the autonomic nervous system starts within seconds when exposed to a stressor (see Pabst et al. Reference Pabst, Brand and Wolf2013; Vinkers et al. Reference Vinkers, Zorn, Cornelisse, Koot, Houtepen, Olivier and Verster2013; Margittai et al. Reference Margittai, Strombach, van Wingerden, Joëls, Schwabe and Kalenscher2015). Other hormones are produced prior to cortisol resulting, among others physiological responses, in an immediate increase of the heart rate. The heart rate itself returns back to baseline within a few minutes after the cessation of the stressor. Therefore by the time cortisol peaks, most of the immediate responses to the stressor are already gone.
In order to test the effect of immediate stress responses on rationality, we run another experiment where participants do the GARP task right after the CPT instead of waiting 20 min. In what follows, we briefly describe this second experiment and present its results.
5.1 Description
The second experiment was conducted in March 2019 also at the CentERlab of Tilburg University. A total of 104 participants who did not participate in the original experiment were recruited for this experiment. 53 participants (20 male and 33 female) were assigned to the Stress treatment and 51 (17 male and 34 female) to the No Stress treatment. We implemented all the features of the original experiment,Footnote 17 the main difference being that economic rationality was tested immediately after the CPT. For methodological consistency, we also collected saliva samples at beginning of the experiment (sample #1) and right after the stress manipulation (sample #2).Footnote 18 However, we eliminated the third and fourth saliva sample collection because this would require interrupting participants during the GARP task.
5.2 Results
Table 3 presents means and standard deviations of the four main index of economic rationality by treatment.
Table 3 Rationality measures by treatment

|
Rationality index |
Stress mean (SD) |
No stress mean (SD) |
Wilcoxon rank-sum test p value |
Kolmogorov–Smirnov test p value |
|---|---|---|---|---|
|
GARP violations |
73.23 (206.49) |
83.39 (195.18) |
0.34 |
0.87 |
|
HMI |
47.64 (3.25) |
47.27 (3.19) |
0.36 |
0.99 |
|
CCEI |
0.96 (0.06) |
0.95 (0.07) |
0.27 |
0.30 |
|
UCCEI |
0.92 (0.11) |
0.89 (0.15) |
0.20 |
0.57 |
Like in our original experiment, we find no significant treatment differences in rationality, no matter which rationality measure we consider. Furthermore, we find no differences in the average of any of the four rationality indexes when we compare the stress and no-stress treatments across experiments (Stress 1 vs. Stress 2 p = 0.28, 0.13, 0.32 and 0.27; No-Stress 1 vs. No-Stress 2 p = 0.54, 0.60, 0.67 and 0.77).Footnote 19
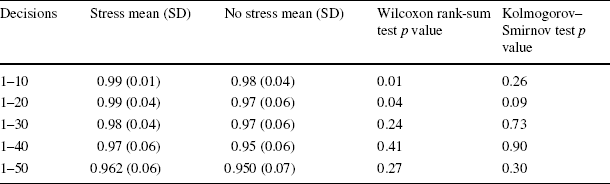
Given that the purpose of this experiment is testing the immediate effect of stress on rationality, we also look at treatment effects in the first 10, 20, 30, 40 and 50 economic decisions. As Table 4 shows, we find statistically significant treatment differences in the first two sets of decisions, but no treatment differences in the decisions thereafter. In particular, when making decisions right after the stressor, participants in the Stress treatment are more consistent with GARP than those in the No Stress treatment. This difference disappears later on, presumably when the immediate response of the autonomic nervous system goes back to normal.
Table 4 CCEI scores by group of decisions
|
Decisions |
Stress mean (SD) |
No stress mean (SD) |
Wilcoxon rank-sum test p value |
Kolmogorov–Smirnov test p value |
|---|---|---|---|---|
|
1–10 |
0.99 (0.01) |
0.98 (0.04) |
0.01 |
0.26 |
|
1–20 |
0.99 (0.04) |
0.97 (0.06) |
0.04 |
0.09 |
|
1–30 |
0.98 (0.04) |
0.97 (0.06) |
0.24 |
0.73 |
|
1–40 |
0.97 (0.06) |
0.95 (0.06) |
0.41 |
0.90 |
|
1–50 |
0.962 (0.06) |
0.950 (0.07) |
0.27 |
0.30 |
6 Discussion and conclusions
Over the past four decades, individual rationality has been criticized for being a rather unrealistic assumption in economics. This criticism, when borne out by scientific evidence, precludes most economic models from making valid predictions. More importantly, this criticism constitutes a challenge for welfare and policy analysis, as policy makers cannot base their decisions on models whose assumptions are systematically violated by decision makers. In light of this, scholars have proposed alternative positive and normative frameworks that encompass non-standard models of choice (e.g. Bernheim Reference Bernheim2009; Manzini and Mariotti Reference Manzini and Mariotti2014) or have advocated to completely dismiss welfare analysis based on observed choice behavior (Sen Reference Sen1985; Sugden Reference Sugden2004; Layard Reference Layard2005).
This paper takes a step back on this debate and experimentally tests whether the rationality assumption indeed breaks down in a context in which individuals make economic decisions under physiological stress. This context is especially relevant because it has been shown that when making decisions in stressful situations, fast and effortless heuristics may dominate over demanding deliberation (Yu Reference Yu2016). We show that the main rationality axiom used in economics survives well under stress. The choices of participants who are stressed out are highly consistent with the main rationality axiom used in economics, and are not significantly different from the choices of participants in a control group. These results are robust to several alternative measures of economic rationality, and also hold when rationality is tested immediately after the cessation of the stressor. If anything, participants under stress experience a temporary increase in choice consistency during the first 20 decisions after the CPT.
Before discussing the implications of our results, some considerations on our identification strategy are due. First, we note that GARP is not a trivial axiom to satisfy. Studies on GARP, including ours, test the pair-wise consistency of choices in a large number of decision problems, and show that random behavior would dramatically decrease consistency. The heterogeneity in consistency observed across countries, socio-economic conditions, gender and age (see, e.g., Choi et al. Reference Choi, Fisman, Gale and Kariv2007a, Reference Choi, Kariv, Müller and Silverman2014) further indicates that GARP is not a trivial axiom to satisfy. Second, the decision problems participants face in the laboratory resemble typical trade-offs between risk and expected returns that people face in many economic decisions in real life. Third, while the population of university students is not representative of the general population, there is no a priory reason to think that stress would affect students rationality in a different way than non-students. Moreover, in the OECD countries, 43% of the population has some type of tertiary education and hence our results speak about a non-negligible group of people.Footnote 20 Lastly, we consider the issue of statistical power. The study did not reveal statistically significant differences between the Stress versus the No-Stress conditions, and the observed effect sizes are small (Cohen’s d ranging from 0.01 to 0.14). This supports the existence of a negligible effect of stress exposure on economic decision making; the corresponding post hoc power estimates for these effect sizes range between 0.06 and 0.17. Moreover, the effects are in the opposite direction as anticipated, making the issue of statistical power less important with regard to the present hypothesis.
The results reported in this paper have important general implications. This paper sheds light on the discussion of the concept of rationality and its robustness (Sugden Reference Sugden1991; Manzini and Mariotti Reference Manzini and Mariotti2014). In line with other existing studies (e.g. Drichoutis and Nayga Reference Drichoutis and Nayga2017), we show that rationality defined as consistency of choices is a robust assumption. This however, does not imply that people always maximize their payoffs. The observed difference between the CCEI and UCCEI scores shows that some participants, although consistent, violated first order stochastic dominance and hence did not maximize their earnings in the experiment. More generally, a decision maker who systematically fails to fully internalize the consequences of his choices may nevertheless satisfy GARP. This discrepancy between consistency of choices and utility maximization is taken up for example, in models of addiction, projection bias, cognitive biases and overconfidence (see Dalton and Ghosal (Reference Dalton and Ghosal2018) for a general model of individually sub-optimal consistent choices).
Overall, we see this paper as an initial step into a broader research agenda that tests the assumption of economic rationality with different decision problems and stressors, which can potentially yield different physiological and behavioral responses (Kemeny Reference Kemeny2003). Inducing temporary, physiological stress in participants is a natural starting point for this research because we can rely on the CPT, which is a very well established method to manipulate acute stress. Moreover, although it has been shown that psycho-social stressors can induce a stronger stress response than the CPT (von Dawans et al. Reference von Dawans, Fischbacher, Kirschbaum, Fehr and Heinrichs2012; Cahlikova and Cingl Reference Cahlíková and Cingl2017) psychological stress can depend on the cultural and social context, which makes it harder to manipulate in a sample that is heterogeneous in these dimensions. For instance, Haushofer et al. (Reference Haushofer, Jang and Lynham2015) find that the Trier Social Stress test for groups (von Dawans et al. Reference von Dawans, Kirschbaum and Heinrichs2011), which is meant to induce social stress, actually decreased stress in a sample of Kenyan males. The difference in social context, and in particular the attitudes of Kenyans towards public speaking, may explain this result.
Our results are also relevant for the debate on whether the stress generated by poverty yields worse economic decision-making (see, for example, Mani et al. Reference Mani, Mullainathan, Shafir and Zhao2013; Carvalho et al. Reference Carvalho, Meier and Wang2016). While we show that acute physiological stress does not impair rational-decision making, it would also be interesting to test whether chronic stress has different effects (Riis-Vestergaard et al. Reference Riis-Vestergaard, van Ast, Cornelisse, Joëls and Haushofer2017). Chronic stress is especially common among people with low socio-economic conditions, and a growing literature shows that decision making in such groups is often short-sighted and more prone to biases (Haushofer and Fehr Reference Haushofer and Fehr2014).
Finally, in this study we focus on decision making under risk, but it is not clear whether consistency with GARP would also hold when decisions involve ambiguous prospects. There is ample evidence that phenomena like probability distortions and ambiguity aversion are common in decisions problems under uncertainty (Wakker Reference Wakker2010); studying consistency with GARP in these environments is an interesting avenue for future research.
Acknowledgements
We thank Syngjoo Choi, Shachar Kariv and Wieland Müller for providing the codes to compute the Critical Cost Efficiency Index, the Varian’s Index and the Money Pump Index. We also thank Jan Heufer and Per Hjertstrand for providing the codes to calculate the Houtman–Maks Index, and the Editor and two anonymous reviewers for excellent suggestions on a previous version of this paper. We are indebted to Dr. Jos Bosch at the University of Amsterdam for providing expertise and resources to carry out the cortisol measurements and Marina Wissink and Benjamin Robert Kop for their assistance in conducting the assays. We also thank the participants at EWEBE 2018 workshop, ESA 2018 World Meeting and TIBER 2018 Symposium for helpful comments.


 Open access