INTRODUCTION
Pea (Pisum sativum L.) is a diploid (2n = 14), annual, self-pollinated species of the Leguminosae family. It is the world's second-largest cultivated food legume, with a global production of 11.332 million tons in 2014. Canada is the world's dominant exporter of peas, followed by the United States, Russia, France and Australia. Argentina is South America's leading producer and exporter with a total area of 45.500 hectares cultivated and ~113.000 tons produced in 2015. Pea seeds are rich in protein (23–25%), slowly digestible starch (50%), soluble sugars (5%), fibre, minerals and vitamins. They also accumulate secondary metabolites, such as isoflavonoids, that are considered beneficial to human health through anticancer and other health-promoting activities. Thanks to their ability to symbiotically fix nitrogen from the air, peas offers interesting options for reducing environmental burdens (Smykal et al., Reference Smýkal, Aubert, Burstin, Coyne, Ellis, Flavell, Ford, Hýbl, Macas, Neumann, McPhee, Redden, Rubiales, Weller and Warkentin2012). For all these reasons, pea continues to be an important crop worldwide both for human consumption and animal feed. Grain yield must increase for pea to remain an attractive option in crop rotations. In a highly self-pollinated crop like pea, the breeding strategy generally involves the hybridization of potential genotypes from the existing germplasm and selection of superior genotypes in the segregating population. This requires the knowledge of the heritability of interesting traits, which is a key parameter in quantitative genetics because it determines the response to selection. Narrow sense heritability expresses the proportion of the total variance that can be attributed to the additive gene effects. It has long been observed that crossing two plant species or genotypes can create a hybrid with faster growth rate, more biomass at maturity and/or greater reproductive output than its parents, a phenomenon called heterosis. Different authors have analysed the existence of heterosis in pea for various agronomic traits, some of the most recent ones being Espósito et al. (Reference Espósito, Bermejo, Gatti, Guindón, Cravero and Cointry2014) and Joshi et al. (Reference Joshi, Ravindrababu, Patel and Chauhan2015). Similar to heterosis, transgressive segregation occurs when phenotypic trait values in hybrid populations fall outside the range of parental variation. Transgressive segregation is distinct from heterosis because it manifests predominantly in the F2 generation and may persist indefinitely once established. The success of selection in self-pollinated crops depends on the extent to which breeders can fix transgressive segregation in early generations. The prediction of heterotic crosses makes more efficient the obtaining of superior lines that are transgressive segregants in advanced generations because there is a relationship between both concepts. It has been hypothesized that genetic distance between parents is the origin of heterosis and it is positively correlated with the frequency of transgressive segregation (Rieseberg et al., Reference Rieseberg, Archer and Waynw1999). Thus, efficient parent's selection and heterosis prediction in pea have been of great interest to breeders for an early determination of those crosses capable of producing a high frequency of transgressive recombinant lines. On the other hand, the performance of a genotype is determined by how it integrates genotype and environmental influences. In early generations, there is a high proportion of environmental variation, so their analysis is more effective when using best linear unbiased prediction (BLUP). Lorenzana and Bernardo (Reference Lorenzana and Bernardo2009) evaluated the accuracy of different methods for the prediction of genotypic values and concluded that BLUP approach is the method of choice for predicting genotypic values in biparental plant populations. Key advantages of using the BLUP approach are that the predictors are better corrected for extraneous variation, unbalanced data can be analysed and information from relatives can be incorporated using all pedigree information (Piepho et al., Reference Piepho, Möhring, Melchinger and Büchse2008). The objective of this study was to evaluate the cross between two genetically distant varieties of pea to determine heritability, heterosis and frequency of transgressive segregants for yield related traits in F2 progeny and their F3 families using BLUP approach.
MATERIALS AND METHODS
Plant material
Both pea varieties used as parents presented contrasting characteristics. DDR14, from India, is a normal leafy variety, with yellow seeds and cream tegument, large pods and grains. On the other hand, Explorer, from Canada, is a semi-leafless plant, with green colour seeds and colourless tegument, medium-size pods and grains. According to Espósito et al. (Reference Espósito, Bermejo, Gatti, Guindón, Cravero and Cointry2014), both genotypes are also divergent at the molecular level when evaluated by SRAP and SSR markers and were placed in different groups when clustering was performed with 21 other accessions.
Phenotypic evaluation
A total of 110 individual plants of F2 generations were sown in a unique row and were evaluated during 2013 in the Experimental Field of the Faculty of Agronomy of Rosario National University (33°1’S and 60°53’W). The parental and F1 seeds were sown in plots consisted in a row of 1 m long and 10 cm between plants (10 plants per plot) arranged in a complete randomized design with two replications during 2013–2015. Two rows of the 110 families F3 were evaluated using the same scheme during two years (2014 and 2015).
Since grain yield is a complex trait, it could be usefully expressed as the product of their components. Phenotypic data was evaluated for the following traits: numbers of days from sowing to 50% of plot flowering (DF); plant height (PH) (cm); number of pods (NP) and seeds per plot (NS); pod length and width (PL, PW) (cm); seed diameter (SD) (cm); number of seeds per pod (SP) and seed weight (SW) (g) measured at the dry seed stage. Previous work evaluated these traits and determined its effects on seed yield (Espósito et al. Reference Espósito, Martin, Cravero, Liberatti, López Anido and Cointry2009).
Statistical analysis
Normal distribution of the morphological data evaluated in different generations was verified by a Shapiro–Wilk test (Shapiro and Wilk, Reference Shapiro and Wilk1965). Data from parents and F1 generation between years was subjected to analysis of variance (ANOVA) to determine the existence of genotype by environments interactions (GxE). Transgressive segregants in F2 population were determined using individual trait values as those individuals that segregate beyond the range of parental means at the 5% probability level. Data collected from F3 families was subjected to ANOVA, components of variance between and within families were estimated and narrow sense heritability was calculated following Cahaner and Hillel (Reference Cahaner and Hillel1980) and standard error was estimated from variance of intra-class correlation. To eliminate the environmental effects, data from parents, F1 and F3 was fitted to a linear mixed effects model and BLUPs were calculated for the random effect of genotype using MetaR (Alvarado et al., Reference Alvarado, López, Vargas, Pacheco, Rodríguez, Burgueño and Crossa2015). Heterosis of F1 over best parent was estimated using this BLUP values. Transgressive segregants were identified for each trait as those F3 families whose BLUP value exceeded that of the best parent by at least 2 SDs (standard deviations), considering SDs based on the values of the entire offspring population. Principal components analysis (PCAs) was performed using BLUP data to obtain a graphical representation of the relationship structure of the 110 F3 families generated. Manhattan distances were calculated and the distance matrix was subjected to cluster analysis by the weighted average linkage method, then a dendrogram was constructed using Infostat (Balzarini and Di Renzo, Reference Balzarini and Di Renzo2003). Type of gene action was determined comparing BLUP values of parental lines and F1 according to Mather and Jinks (Reference Mather and Jinks1982). Mean and SDs were computed for all analysed generations following standard statistical methods using Infostat (Balzarini and Di Renzo, Reference Balzarini and Di Renzo2003).
RESULTS
Mean values of morphological traits evaluated in different generations showed a normal distribution (W > 0.85). ANOVA for parental lines, F1 generation across years and F3 families determined that GxE was statistically significant for all characters (data not shown). Data from F3 families was used for the estimation of narrow sense heritability, due to GxE every year was analysed separately. In 2014, the highest heritability values were shown for SP (83.5%), whereas NP, NS and SP showed the highest values in 2015 (96.6%, 89.3% and 88.1%, respectively) (Table 1). For most of the traits, similar values were observed in both environments, except for NP and NS that showed higher values in 2015.
Table 1. Estimated narrow sense heritability values and standard error for yield-related traits evaluated within the Explorer x DDR14 population in 2014 and 2015.

DF: numbers of days from sowing to 50% of plot flowering; PH: plant height (cm); NP: number of pods; NS: seeds per plot; PL: pod length (cm); PW: pod width (cm); SD: seed diameter (cm); SP: number of seeds per pod; SW: seed weight (g).
The effect of environmental factors can be handled through the use of BLUP to predict genotypic value. In this work, BLUP values were calculated for parents, F1 and F3 populations. Since the F2 population cannot be replicated, it was impossible to write the linear model for establishing the BLUP values, so the analysis of this generation was done with mean values. The comparison between the BLUP values of F1 hybrid and the two corresponding parents indicated a high percentage of heterosis for NP (27.1%) and NS (23.3%) (Table 2).
Table 2. Parents and F1 best linear unbiased predictors (BLUPs) and percentage of heterosis for yield-related traits evaluated within the Explorer x DDR14 population.

DF: numbers of days from sowing to 50% of plot flowering; PH: plant height (cm); NP: number of pods; NS: seeds per plot; PL: pod length (cm); PW: pod width (cm); SD: seed diameter (cm); SP: number of seeds per pod; SW: seed weight (g).
In F2 population, more than 10% of transgressive segregants were observed for PH, PW, SD and SW. Mean of transgressive individuals was 15.3 cm shorter than the best parent for PH, 0.15 cm wider for PW, 0.15 cm larger for SD and 0.055 heavier for SW. In F3 population, more than 10% of transgressive segregants were observed for NP and NS. BLUP values of transgressive families were 9.89 and 23.039 larger than the ones for the best parent. Percentage of transgressive segregants for PH, PL, PW and SD found in F2 was higher than the ones found in F3 generation while the opposite was true for NP and NS (Table 3). Only for NV, two genotypes (54 and 68) were transgressive in F2 and F3 generations.
Table 3. Percentage of transgressive segregants for yield-related traits evaluated in F2 and F3 progeny derived from Explorer x DDR14 cross.

Mean of parents and F2 transgressive individuals measured in 2013 and best linear unbiased predictors (BLUPs) of parents and F3 transgressive families. DF: numbers of days from sowing to 50% of plot flowering; PH: plant height (cm); NP: number of pods; NS: seeds per plot; PL: pod length (cm); PW: pod width (cm); SD: seed diameter (cm); SW: seed weight (g). SP is not shown because no transgressive segregants were observed.
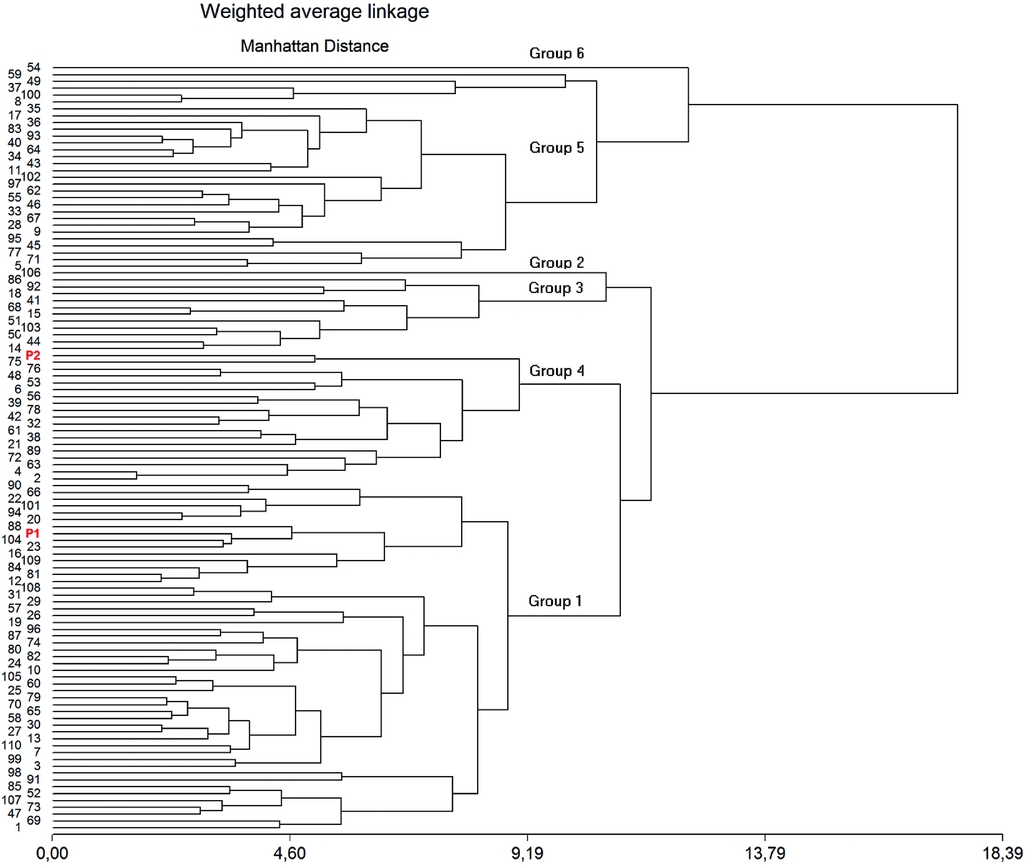
Principal component analysis of BLUP showed that the first two PCs only explain 47% of the total variation. If the third one is included, 64% of the variation is explained. Figure 1 represents the distribution of the families according to the two principal axes of variation using PCA, NP and NS being the variables that contributed most to the first coordinate. Almost all of the families inside the circle are transgressive for these traits. Family 54 can be considered one of the best ones, because it has the highest NP (64.409) and NS (189.590) and the lowest DF (78.678).
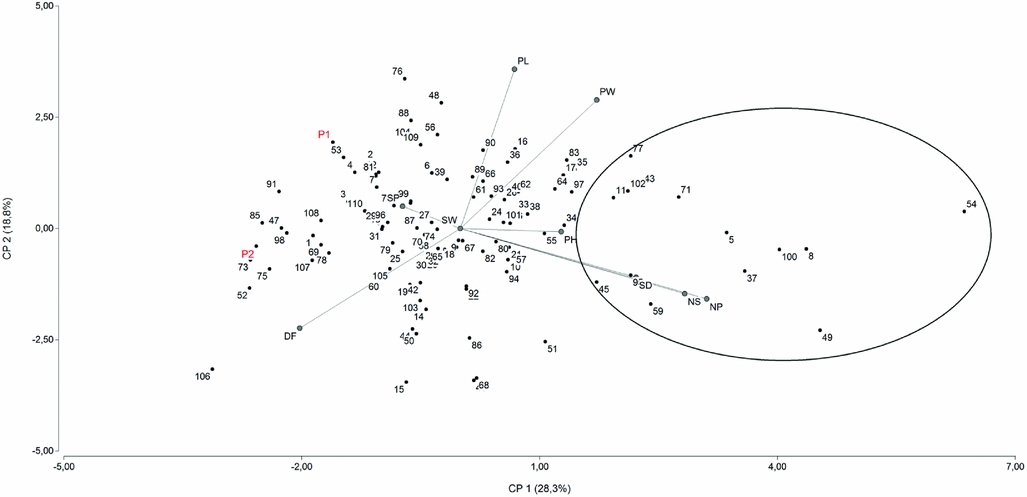
Figure 1. Diagram showing the relationships among the 110 F3 families derived from Explorer (P2) and DDR14 (P1) based on principal component analysis. Families inside the circle are transgressive for NS and NP. Parental position is indicated with red colour.
Relationships between the 110 families and the parental lines revealed by cluster analyses are shown in Figure 2. Six main clusters can be observed, cluster 1 contained a great number of genotypes (51, including DDR14), followed by cluster 5 (29 genotypes), cluster 4 (19 genotypes, including Explorer), cluster 3 (11 genotypes), cluster 2 and cluster 6 that contained only one genotype. These last two clusters have the more extreme phenotypes: 106 (cluster 2), which has low PH, NP and SP, the highest DF and the lowest PL, SP and SW; and 54 (cluster 6), which has the highest NS, NP, SD, PW, PL and the lowest DF (Table 4). Families included in cluster 6 along with families included in clusters 5 are the most promising ones, all the families that were indicated as transgressive with a circle in PCA analysis are contained in one of these two clusters.

Figure 2. Dendrogram showing the relationships among the 110 F3 families derived from Explorer (P2) and DDR14 (P1) constructed according to the weighted average linkage method and based on the Manhattan genetic distance estimates. Parental position is indicated with red colour.
Table 4. Mean of groups formed by cluster analysis.

Different letters indicated significant differences according to a Duncan test (p < 0.05). DF: numbers of days from sowing to 50% of plot flowering; PH: plant height (cm); NP: number of pods; NS: seeds per plot; PL: pod length (cm); PW: pod width (cm); SD: seed diameter (cm); SP: number of seeds per pod; SW: seed weight (g).
By examining the parental and F1 data, we could determine what type of gene action was present for evaluated traits (Table 5). According to this analysis, overdominance effects were found for DF, NP, NS, PL and SD, partial dominance of Explorer for PH and PW and partial dominance of DDR14 for SP. For SW, there was no difference between parents, so gene effects were not evaluated.
Table 5. Estimates of the additive and dominance effects.

(a) Type of gene action: OD, overdominance; DP: partial dominance; DF: numbers of days from sowing to 50% of plot flowering; PH: plant height (cm); NP: number of pods; NS: seeds per plot; PL: pod length (cm); PW: pod width (cm); SD: seed diameter (cm); SP: number of seeds per pod.
DISCUSSION
The improvement of yield is one of the main objectives of plant breeding, but its polygenic inheritance makes the improvement for this character difficult. The exploitation of maximum genetic potential from available resources implies the knowledge of genetic parameters of yield components. Hence, the present study was conducted in a cross between two pea varieties, its F2 progeny and F3 families to find out transgressive segregants and to determine the magnitude of heritability and heterosis.
Heritability estimates (h 2) can be classified as high (>50%), medium (30–50%) and low (<30%). High values were obtained for all evaluated characters, except for SW and PH, that shown medium values. The high values of narrow heritability indicated that rapid gain could be achieved through selection for the different traits; however, the presence of genotype x environment interaction could limit the correspondence of these estimated values with the observed ones. The response to selection would be limited if the environment where the selection is made differs greatly from the one where the improved genotypes will be evaluated and produced. Although the values of narrow sense heritability obtained for NP and NS were high in both environments, there is a difference between years. In 2014, environmental conditions were less favourable for pea production, with temperatures higher than critical value during grain filling. Two hypotheses have been proposed to explain why unfavourable conditions decrease heritability. On the one hand, environmental variation is increased by stress conditions and, on the other one, genetic potential of organisms is not reached under poor nutrition (Hoffman and Merilla, Reference Hoffman and Merilä1999). In previous works, Timmerman-Vaughan et al. (Reference Timmerman-Vaughan, Mills, Whitfield, Frew, Butler, Murray, Lakeman, McCallum, Russell and Wilson2005) evaluated narrow sense heritability values from an F2 population and their F3 families derived from the cross between Primo and OSU442-15 lines in three environments. They obtained values of 95.7% for SW and 80.3% for NS. In the present study, the values obtained for SW were lower (38.1 in 2014 and 42.2% in 2015), whereas values obtained for NS were lower in 2014 (51.7%) and higher in 2015 (89.3%). On the other hand, Kosev et al. (Reference Kosev, Pachev, Angelova and Mikic2012) evaluated F1 and F2 populations generated from different crosses between three varieties, namely Usatii 90, Kamerton and Pleven 10, and obtained low narrow heritability values (between 0.01 and 44%) for PH, NP, NS, SW and SP.
BLUP is a standard method for the prediction of genotypic values free of any environmental effects. Its use is relatively limited in plant breeding compared to animal breeding, but has been used as a tool associated with progeny selection in several crops (Piepho et al., Reference Piepho, Möhring, Melchinger and Büchse2008) and has been used for the detection of transgressive segregants in peanuts (Pattee et al., Reference Pattee, Isleib, Giesbrecht, Cui, Rajasekaran, Jacks and Finley2002) and mungbean (Jambormias et al., Reference Jambormias, Sutjahjo, Mattjik, Wahyu, Wirnas, Siregar, Patty, Laisina, Madubun and Ririhena2015).
Since for improving any trait of interest the cross has to be superior as compared to their parents, heterosis values were estimated. For the cross Explorer x DDR14, high percentage of heterosis was observed for NP and NS (Table 2), characters that have a direct effect on yield (Espósito et al., Reference Espósito, Martin, Cravero, Liberatti, López Anido and Cointry2009; Rashwan and El-Shaieny Reference Rashwan and El-Shaieny2016). Previous studies have reported both positive and negative values for this trait in different crosses (Joshi et al., Reference Joshi, Ravindrababu, Patel and Chauhan2015). Other traits that exhibited heterosis were PL and SD. When type of gene action was examined (Table 5) it could be established that overdominance conditioned the heterosis of all these traits. Heterosis can be attributed to the superior fitness of heterozygous over homozygous genotypes at a single locus. DF is a measure of precocity and hence, negative heterosis is desired. In this case, the cross did not exhibit significant negative heterosis for DF, which is in line with the results obtained by Kumari et al. (Reference Kumari, Dikshit, Singh and Singh2015), who observed no heterosis for the trait.
Transgressive refers to the fraction of individuals belonging to segregating generations that exceed parental phenotypic values in either a negative or positive direction. Different percentages of transgressive segregants were found in F2 and F3 generation (Table 3). The shrinkage of the BLUPs values for F3 population toward the population average could be the reason for the reduction observed in transgressive segregants for most traits in F3 population as compared with F2 population. For NS, no transgressive segregants were observed in F2, which may be related to the high SP that DDR14 presented in 2013 (mean: 3.58) in comparison to F2 individuals (mean: 2.59). Because of this, although NV presented a medium value (43.75) and some transgressive segregants appear, NS is high (157.25) and there were no individuals beyond the limited value calculated.
The literature on transgressive segregation in Pisum sativum is scanty. Many studies evaluated the genetic variability of different genotypes to select dissimilar genotypes as parental of crosses in pea breeding programs or determined heterosis as a way to predict transgressive segregants, the most recent ones being Khan et al. (Reference Khan, Mahbub, Reza, Shirazy and Mahmud2016) and Kumar et al. (Reference Kumar, Jeberson, Singh and Sharma2017). However, there are not many studies that identified transgressive segregants in the following generations, and this information is most relevant for the production of new cultivars. Yadav et al. (Reference Yadav, Tyagi and Singh1998) predicted transgressive segregants in wheat using generation mean approach and variance test at the F2 and F3 progenies, and showed that variance tests at the F3 generation was more accurate than that of the generation mean approach. Chahota et al. (Reference Chahota, Kishore, Dhiman, Sharma and Sharma2007) studied the expected transgressive segregants for seed yield in the F1 generation and the observed transgressive segregants at F2, F3 and F4 generations of some lentil crosses. The prediction was effective for most of the crosses; moreover, the frequency of transgressive segregants in F3 and F4 generations in most of the crosses was similar, making the decision about promising crosses simpler. Recently, Shreya et al. (Reference Shreya, Ainmisha and Vashanti2017) evaluated four groundnut crosses and found transgressive segregants for total biomass, harvest index, shoot weight, root weight, shelling out-turn, mature pod weight and kernel weight per plant, indicating that the parents possess different alleles and genes governing respective characters.
According to Sarawat et al. (Reference Sarawat, Stoddard and Marshal1994), F1 generation can be used as a mean of determining the potential for the production of transgressive segregants in later generations. In the current study, F1 plants were superior to the best parent for NP and NS traits, and the cross showed high frequency of transgression for those characters in F3 population. However, the same relation has not been observed between heterosis and transgressive segregants in the F2 population. Each individual plant in F2 population is a unique genotype and cannot be replicated, instead F1 generation and F3 families were evaluated in different environments with replicates, so it was possible to establish the corresponding linear model and to calculate genotypic values.
Principal component analysis and cluster analyses of F3 families BLUP values allowed the identification of most promising families (Figures 1 and 2). Jambormias et al. (Reference Jambormias, Sutjahjo, Mattjik, Wahyu, Wirnas, Siregar, Patty, Laisina, Madubun and Ririhena2015) selected transgressive segregants for multiple traits in the F3 generation of a mungbean cross based on BLUP information. Using this method, they identified at least 18.90% transgressive families for seed weight and harvest index. In our study, 14 of the 110 families (12.73%) resulted transgressive for two or more characters.
Several explanations have been offered to justify the occurrence of transgressive phenotypes in segregating populations (Rieseberg et al., Reference Rieseberg, Archer and Waynw1999), including an elevated mutation rate in hybrids; reduced developmental stability; non-additivity of allelic effects between loci or epistasis; non-additivity of allelic effects within a locus or overdominance; the unmasking of rare recessive alleles that are normally heterozygous in the parental taxa; chromosome number variation; and the complementary action of additive alleles that are dispersed between the parental lines. The last explanation assumes that parental lines are often fixed for sets of alleles that have opposing effects within lines. Then, extreme phenotypes are the predicted result of recombination in segregating hybrid generations. By examining the parental and F1 data, we could determine that overdominance and partial dominance effects could be responsible for the occurrence of transgressive segregants in this population.
Success of any plant breeding program depends upon the selection of elite genotypes which, in turn, ultimately depends on the knowledge of variability of the germplasm. The results showed in this work indicated that the crossing between Explorer and DDR14 allowed to obtain individuals whose performance is superior to their parents and are plausible to be selected. Early generation selection could result in high-yielding progenies in later generations, but germplasm with desirable genes could be lost in this process. So, it is important to generate all the information necessary to make selection more efficient. Considering the high narrow sense heritability values obtained, early generation selection would be worthwhile for this population. Through the use of BLUP and according to principal component and cluster analysis, it was possibly to choose families with good performance. These promising transgressive segregants having a combination of desirable attributes must be included in breeding programs.
Acknowledgements
This research was supported by Consejo Nacional de Investigaciones Científicas y Técnicas (CONICET, Argentina), Instituto de Investigaciones en Ciencias Agrarias de Rosario (IICAR-CONICET) and Fondo para la Investigación Científica y Tecnológica (FONCyT, Argentina).