INTRODUCTION
Bambara groundnut is an African legume crop grown by farmers as local landraces. The plant can be bunched, semi-bunched or spreading-type, depending on the length of the internodes. Stem branching begins about one week after germination and as many as 20 branches may be produced. Flowers are born on short racemes and are yellow or cream in colour. Pods contain one or two seeds formed either underground or at ground level. One of the most important characteristics of bambara groundnut is its ability to produce some yield in soils which are too poor for cultivation of other, more favoured species such as groundnut (Arachis hypogaea) (Linnemann and Azam-Ali, Reference Linnemann, Azam-Ali and Williams1993). Bambara groundnut is a short day crop whereby landraces require a minimum daylength to initiate pod filling. The crop grows at elevations of up to 1600 m and the optimum temperature (T o) for bambara groundnut ranges from 20–28 °C (Linnemann and Azam-Ali, Reference Linnemann, Azam-Ali and Williams1993). The crop is usually harvested between 90 and 170 days after sowing (DAS (Linnemann and Azam-Ali, Reference Linnemann, Azam-Ali and Williams1993).
Studying the effect of environmental factors on the growth and development of bambara groundnut is essential to explore the potential production of bambara groundnut landraces in various agro-ecological regions and to assess the possibilities of transferring selections to other regions. In most crops, water stress and temperature stress can be limiting factors to growth and development. However, uncoupling the independent effects of drought and temperature stress in the field is difficult. Therefore, experiments in controlled environments that complement field studies can be used to identify the effects of each factor on growth and development.
Several plant processes are affected by drought and temperature, from the cell to the canopy. Vegetative growth rate under drought may be strongly restricted and consequently leaf area expansion will be reduced. Reduced total dry matter (TDM) accumulation due to drought is partly a consequence of reduced leaf area expansion of the plants, which in turn decreases light interception (Mwale et al., Reference Mwale, Azam-Ali and Massawe2007), and partly a direct effect of low photosynthesis due to stomatal closure. Under high temperature stress, plants will transpire more to cool their leaves. The respiration rate will also increase under high temperature stress, sometimes above the photosynthesis rate. This means the products of photosynthesis are being used more rapidly than they are being produced. In turn, dry matter allocation to pods will be reduced with more consequences on yield. Damage to the plants caused by exposure to high temperature differs from crop to crop, and depends on growth stage and type of plant tissue. Some growth stages are more sensitive to high stress than others. In pearl millet, for example, the seedlings are most vulnerable to heat during emergence because of the rise of soil surface temperature (Klueva et al., Reference Klueva, Mastri, Marmiroli, Nguyen and Basra2001). Plants under low temperature stress will also have slower photosynthesis, which means slower growth rate. Less available metabolic energy, limitation on water and nutrient uptake were observed at low temperature (Wang et al., Reference Wang, Chin and Chin1998).
Bambara groundnut is considered as a drought tolerant crop (Collinson et al., Reference Collinson, Berchie and Azam-Ali1999). However, there is limited evidence on how landraces from different regions may differ in their response to drought and temperature. In this regard, the specific vegetative and reproductive performances of different bambara groundnut landraces under drought and temperature stress have not been clarified.
As bambara groundnut is an underutilised crop grown from locally adapted landraces rather than true varieties, it is essential to quantify any genotypic variation in growth and development among the landraces before any breeding programme is carried out. It is essential to grow crop landraces in the field environments from which they have been developed, and to develop varieties that grow beyond their local environments. Also, because most of the field factors are uncontrolled, controlled environment studies are needed to assist breeding and modelling by quantifying the physiological and phenological aspects within landraces across controlled environmental gradients.
Previous studies on bambara groundnut coordinated by the University of Nottingham have been carried out on contrasting landraces because no varieties exist. The landrace S19-3 originates from a hot and dry environment (Namibia), and the landrace Uniswa Red originates from a wet and cool environment (Swaziland). Both have been extensively used for several studies at the Tropical Crops Research Unit (TCRU), School of Biosciences, Sutton Bonington Campus, University of Nottingham and in African field experiments.
The objective of the study reported here is to investigate the independent effects of drought and temperature on dry matter production, partitioning and yield of the two landraces of bambara groundnut to examine how any observed effects relate to their environmental origin.
MATERIALS AND METHODS
Site and glasshouse environment
The experiment was carried out in the five controlled environment glasshouses at the TCRU, University of Nottingham, Sutton Bonington, UK. The glasshouses are aligned in a north–south direction to prevent mutual shading. Each glasshouse measures 10.1 m long by 4.7 m wide, with height of 2.3 m at the eaves, reaching 3.5 m at the centre. Each glasshouse contains two separate plots, each measuring 4 m by 4 m. More details about the glasshouse structure are given in Clifford et al. (Reference Clifford, Stronach, Mohamed, Azam-Ali and Crout1993). Four profile probe (PR2 Delta-T Devices, UK) access tubes were located at least 1 m from the edges in each plot. The access tubes allow soil water content to be measured to a depth of 100 cm. The PR2 probe measures the soil moisture at 10, 20, 30, 40, 60 and 100 cm. The average of the access tube readings represents the mean amount of water in the soil for each plot.
Each house contains a gravelly sandy loam soil to a depth of 1.25 m with heavy-duty butyl liner installed to prevent vertical and lateral infiltration of water.
Monitoring and control of glasshouse environment
Copper constantan (38 swg) Type t thermocouples were used to monitor the wet and dry bulb temperature. The thermocouples were sited in an aspirated psychrometer unit mounted 2.3 m above the ground level. The temperature was recorded every two minutes for both bulbs. The values were used to compute the atmospheric saturation deficit (SD in kPa) in the glasshouses.
Air was drawn through the psychrometer at a rate of 3 ms−1. The wet bulb was supplied with deionised water using a peristaltic pump. Water was injected where required to maintain SD below 4 kPa. To maintain the air temperature at the required level, a gas-fired hot air blown boiler (Powermatic model CA-A9–150, UK) was used. Cooling and ventilation of the glasshouses was achieved through automatically controlled vents that run the full length of the glasshouses on either side of the central ridge.
In each house, there is a fitted trickle irrigation system with plastic pipes that can be directed to each crop row. On the same site as the glasshouses, there is a building which houses the central computer system used to control temperature, humidity, ventilation and CO2 in each glasshouse (Clifford et al., Reference Clifford, Stronach, Mohamed, Azam-Ali and Crout1993).
Thermal time (Squire, Reference Squire1990) accumulation on each day was computed from the air daily mean temperatures as follows:
Cumulative Θ was calculated as the sum of daily values of Θ (Squire, Reference Squire1990).
Experimental layout, treatments and crop management
The experimental design of each experiment was a complete randomised block, and the layout was a split plot with temperature as the main plot; three glasshouses with high temperature (33 °C), where temperature went up to 38 °C at midday and went down to 28 °C at night, and two glasshouses with low temperature (23 °C), with maximum of 28 °C at midday and minimum of 18 °C at night, and landrace (S19-3 and Uniswa Red) as the sub-plots. For each individual day, whenever the temperature went over the maximum or down the minimum targeted temperature, the daily temperature mean was automatically corrected. For example, at 23 °C, if the minimum temperature was 17 °C, the maximum temperature would go up to 29 °C to get a mean of 23 °C. The study was conducted as three experiments in the summers of 2006–2008. In 2006, soil moisture was non-limiting and the plots were irrigated weekly to field capacity. In 2007, drought was imposed at podding (77 DAS), and in 2008 at flowering (30 DAS). As temperatures and landraces were the same in all three years, this effectively allowed a comparison of the effect of water availability on crop growth and development with relatively non-limiting soil moisture in year one, late season stress in year two and prolonged stress from flowering in year three. All glasshouses received natural daylight, and because bambara groundnut requires short days for pod filling (Linnemann and Azam-Ali, Reference Linnemann, Azam-Ali and Williams1993), the day length was controlled by covering the crop stands in each plot with a black polythene screen at 2000 hours and uncovering at 0800 hours to maintain a 12-h photoperiod from 21 to 113 DAS. SD ranges from below 2 kPa in moist temperate climates to 4 kPa in semi-arid areas (Squire, Reference Squire1990). While it was not maintained at a fixed value, SD was set to range between 2 kPa and 4 kPa at 33 °C and not to exceed 2 kPa at 23 °C. The seeds were sown at 5 cm depth (one seed for each station) at a spacing of 10 cm between each station and 35 cm between rows. There were 12 rows in each plot and 36 stations, effectively 30 seeds m−2. At 26 DAS, the crops were thinned to 18 plants per row (approximately 20 cm between plants), which gave an established population of 15 plants m−2. This population was chosen to use the available space in the glasshouses efficiently, have enough plants to carry out the growth analysis and, at the same time, give enough space to the plants to grow without obstructing each other.
Measurements
In 2007 the soil moisture content in the soil profile was monitored in all plots using a PR2 probe (Delta T Devices, UK). Measurements were taken weekly starting from 55 DAS. Unfortunately the PR2 broke down after 119 DAS and the measurements were stopped between 119 DAS and 168 DAS. In 2008 the measurements were taken weekly starting from 5 DAS until 141 DAS. No soil moisture measurements were taken in 2006; however, since irrigation was applied weekly, water was unlikely to be limiting. After 26 DAS six plants were randomly selected and tagged in each plot and used for counting leaves and flowers twice a week until 151 DAS. The thermal time (Θ) requirement for leaf production was computed as the slope of regression of leaf numbers against cumulative Θ above T b = 10 °C.
Sequential growth analysis, at intervals of two to three weeks, was carried out on 10 plants per plot on eight occasions through the season in 2006 and nine occasions in 2007 and 2008. Plants to be harvested were pre-determined to avoid selecting plants adjacent to previous harvesting locations. No plants were taken from the two edge rows in each plot to avoid edge effects, nor from the central areas where light interception measurements and final harvest were taking place. Leaves and pods were counted at each growth analysis. Leaf, stem and pod dry weights were obtained after oven drying at 80 °C for 48 h. The mean of 10 plants for each variable was taken as a representative value for each replicate. Green leaf area was measured by using LI-1300 leaf area meter (LiCOR Instruments, USA).
Thirty plants were sampled from the central area in each plot at the final harvest, 10 were used for growth analysis, as described above, and the other 20 were used to measure the shoot weight and calculate harvest index (HI) as the fraction of pod weight to shoot weight. Pods were oven-dried for one week at 35 °C and shelled to get the fraction of shell/pod weight.
Data analysis
Growth analysis data were analysed statistically using the software package Genstat for Windows 12th edition (Lawes Agricultural Trust, Rothamsted Experimental Station, UK) by analysis of variance. The difference was considered significant when the probability was equal to or less than 0.05.
RESULTS
Growth environment and water use
Although it was difficult to maintain the targeted range of temperature (18–28 °C at 23 °C treatment and 28–38 °C at 33 °C treatment), the targeted daily and seasonal means were achieved as explained in the Experimental Layout section. SD was successfully kept within the targeted range of below 2 kPa at 23 °C and between 2 kPa and 4 kPa at 33 °C.
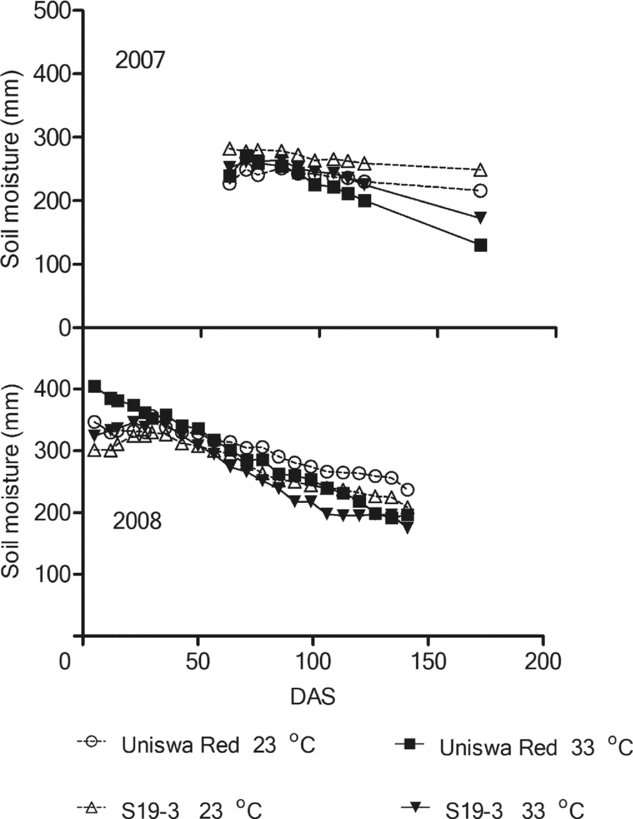
In 2006, water was assumed to be non-limiting. All treatments in 2007 and 2008 showed a steady decrease in soil moisture content (Figure 1). In 2007, soil moisture of S19-3 plots at 33 °C had the highest moisture content, with soil moisture decreasing from 282 mm at 62 DAS to 249 mm at 168 DAS. In 2008, Uniswa Red plots at 23 °C had the highest soil moisture content throughout the season, while S19-3 plots at 33 °C had the lowest soil moisture content.

Figure 1. Changes in the mean soil moisture content (mm) per treatment throughout the soil profile in the TCRU glasshouses during the experiment of two bambara groundnut landraces (Uniswa Red and S19-3) grown in 2007 (drought imposed at 77 DAS) and 2008 (drought imposed at 30 DAS). The arrows indicate the time when drought was imposed.
Leaf appearance
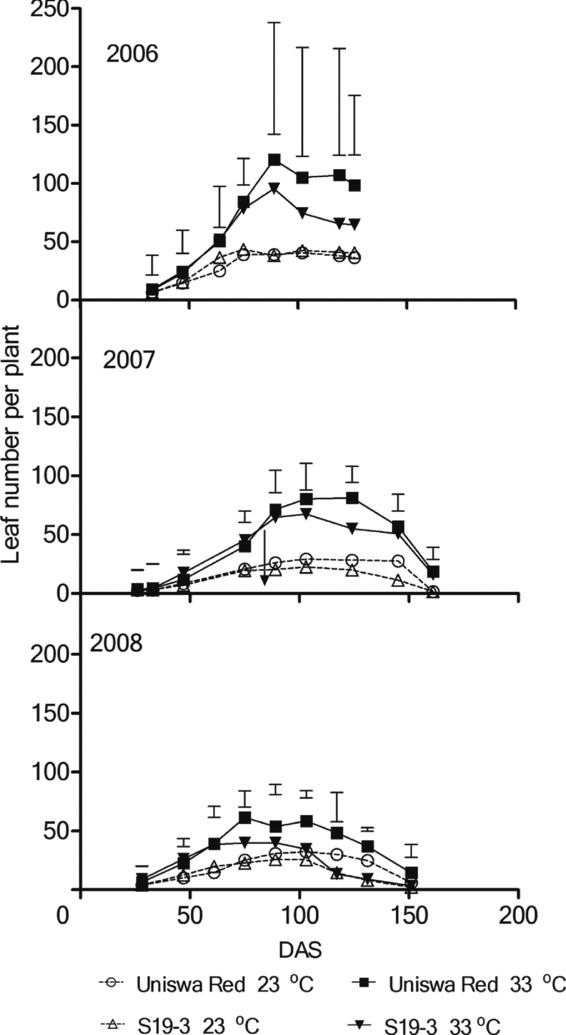
Uniswa Red at 33 °C produced the most leaves in all three experiments (Figure 2). Both landraces produced fewer leaves at 23 °C than 33 °C. Throughout the three seasons, and at both temperatures, leaf numbers of S19-3 started to decrease before Uniswa Red. However, despite this consistent trend, there were no significant differences between landraces.

Figure 2. The effect of temperature on the leaf number of two landraces of bambara groundnut (Uniswa Red and S19-3) grown at 23 °C and 33 °C in the TCRU glasshouses in 2006 (fully irrigated), 2007 (drought imposed at 77 DAS) and 2008 (drought imposed at 30 DAS). The arrows indicate the time when drought was imposed, and the vertical bars represent the standard error of difference (SED).
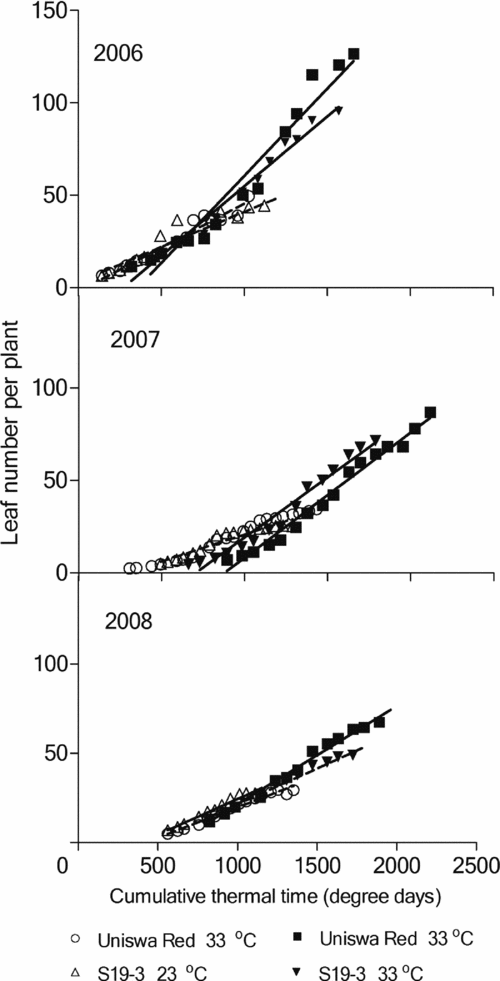
Linear regression of leaf numbers against cumulative thermal time is presented in Figure 3 for three seasons. Throughout each season, landraces at 23 °C always had a slower leaf appearance rate (LAR) than the landraces at 33 °C.

Figure 3. Regression of the leaf number against cumulative thermal time (degree days) for two bambara groundnut landraces grown at low temperature (23 °C) and high temperature (33 °C) in TCRU during the experiments in 2006 (fully irrigated), 2007 (drought imposed at 77 DAS) and 2008 (drought imposed at 30 DAS). For 2006, r2 = 87.1, for 2007, r2 = 90.1 and for 2008, r2 = 94.2. Slopes and constants are presented in Table 1.
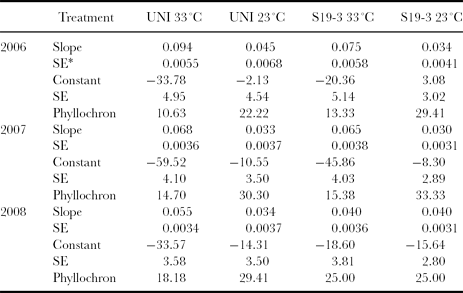
Wilhelm and McMaster (Reference Wilhelm and McMaster1995) defined the phyllochron as the interval between the formation of two successive stages of development as a reference point (such as initiation of leaf or bud). In this study the phyllochron of the landraces at 23 °C was higher than the phyllochron of the landraces at 33 °C (Table 1).
Table 1. Slopes, constants and phyllochron (°Cd leaf−1) obtained from the regression of the leaf number per plant against cumulative thermal time (degree days) for two bambara groundnut landraces (Uniswa Red (UNI) and S19-3) grown at low temperature (23 °C) and high temperature (33 °C) during the experiments in 2006, 2007 and 2008 in the TCRU glasshouses, University of Nottingham, UK.

Note: *Standard error.
Leaf area index (LAI)
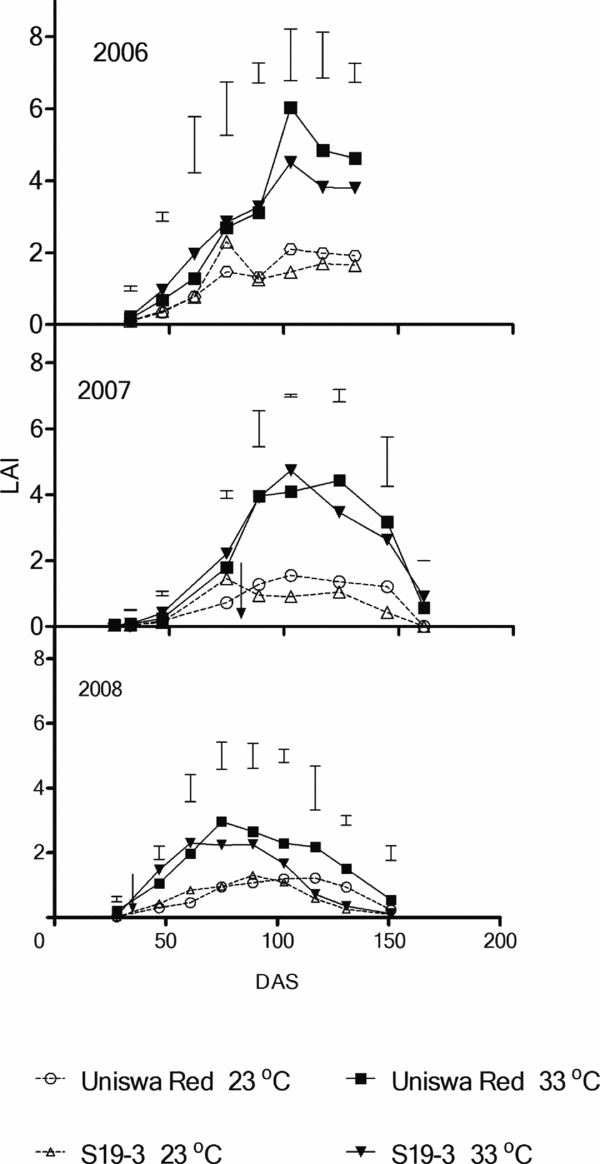
Maximum LAI was similar in 2006 and 2007, but was much lower in 2008 (Figure 4). Throughout the three seasons, both landraces gave higher LAI at 33 °C than at 23 °C. The statistical analysis showed no significant difference in terms of interaction between temperature and landraces at most of the growth analyses (p > 0.05), while the temperature always had significant effect (p < 0.05). In 2006, at 33 °C, both landraces had the same rate of increase in LAI until 89 DAS from when the increase in LAI was higher for Uniswa Red.

Figure 4. The effect of temperature on LAI in two bambara groundnut landraces (Uniswa Red and S19-3) grown at low temperature (23 °C) and high temperature (33 °C) in the TCRU glasshouses during the experiments in 2006 (fully irrigated), 2007 (drought imposed at 77 DAS) and 2008 (drought imposed at 30 DAS).
Pod number
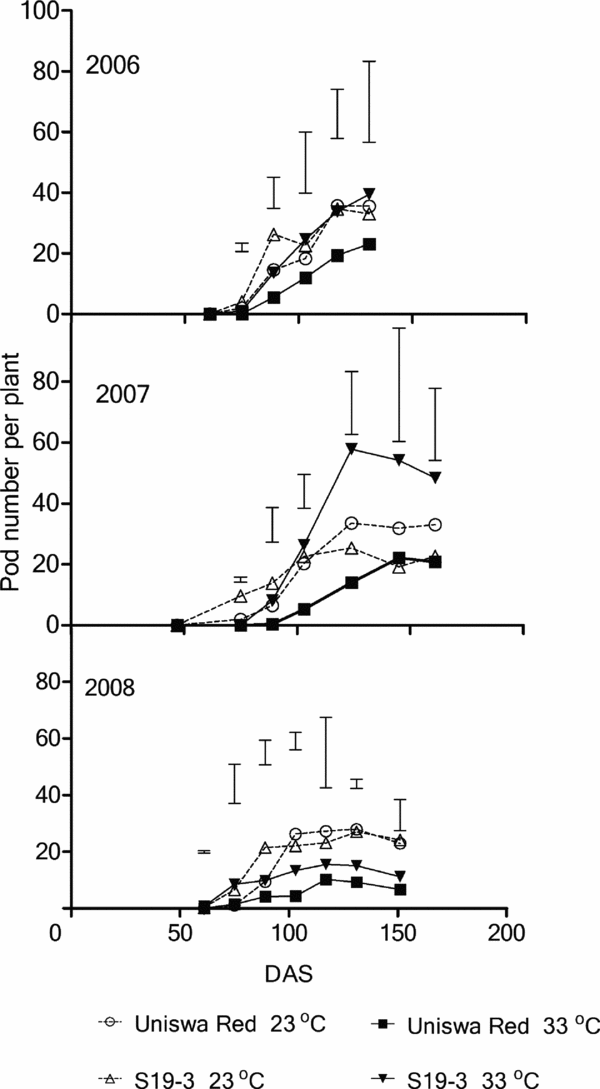
Throughout the three growing seasons, Uniswa Red produced the fewest pods at 33 °C. The highest pod number per plant (57.7) was produced by S19-3 at 33 °C in 2007 (Figure 5). In 2007, S19-3 at 23 °C initially had the most pods, but from 103 DAS S19-3 at 33 °C had the most pods, and difference increased with time until the end of the season (Figure 5). Statistical analysis of the three growing seasons showed no significant interaction between temperature and landrace on pod numbers.

Figure 5. The effect of temperature on the pod number of two landraces of bambara groundnut (Uniswa Red and S19-3) grown at 23 °C and 33 °C in the TCRU glasshouses in 2006 (fully irrigated), 2007 (drought imposed at 77 DAS) and 2008 (drought imposed at 30 DAS). The arrows indicate the time when drought was imposed, and the vertical bars represent the standard error of difference (SED).
Total dry matter (TDM)
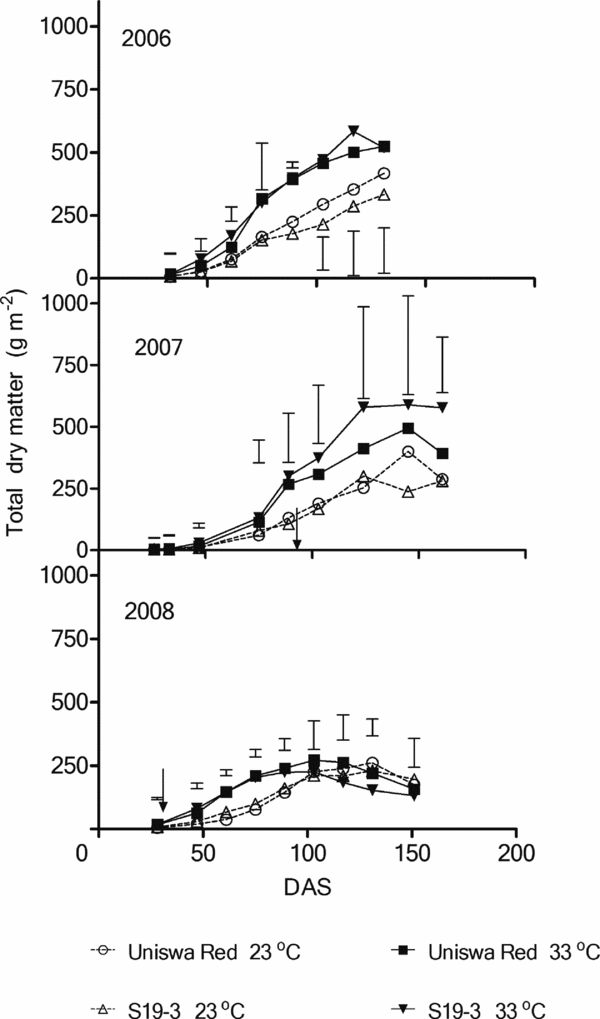
The TDM accumulation at 23 °C was always lower than that at 33 °C (Figure 6). In the third growing season, both landraces produced more at 33 °C until 117 DAS, where the amount of TDM started to decline. The statistical analysis showed no significant interaction effect, no landrace significant effect and no temperature significant effect in the three growing seasons (p < 0.05).

Figure 6. The effect of temperature on the TDM of two landraces of bambara groundnut (Uniswa Red and S19-3) grown at 23 °C and 33 °C in the TCRU glasshouses in 2006 (fully irrigated), 2007 (drought imposed at 77 DAS) and 2008 (drought imposed at 30 DAS). The arrows indicate the time when drought was imposed, and the vertical bars represent the standard error of difference (SED).
Pod dry matter (PDM)
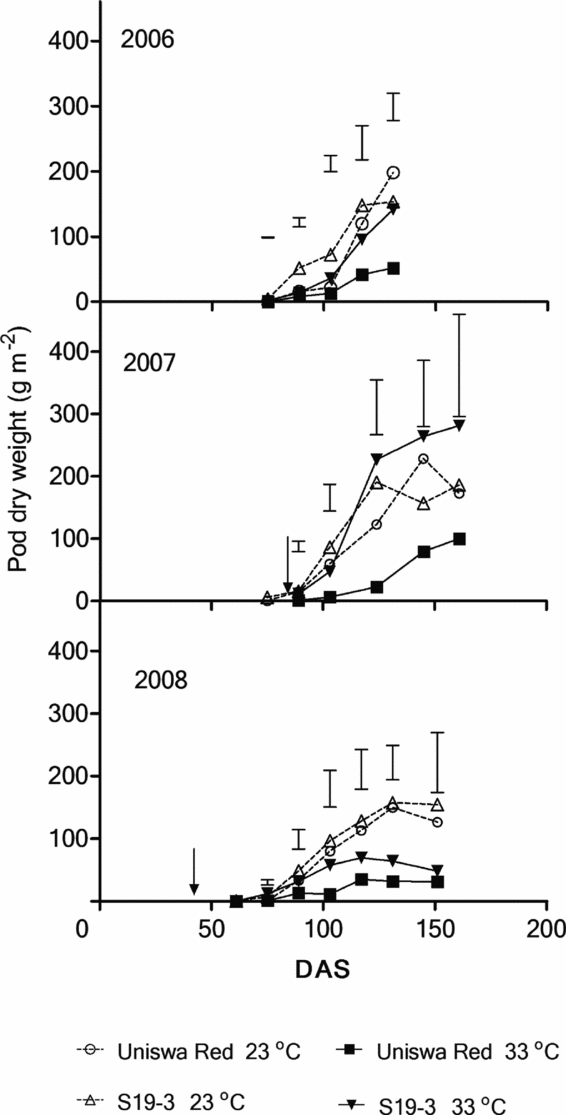
In 2006 the PDM production at 33 °C was significantly lower than the PDM production at 23 °C from 117 DAS (Figure 7; p < 0.05). The total PDM production of S19-3 at both temperatures was significantly higher than that by Uniswa Red at 75 DAS (p < 0.05). In 2007, temperature, landrace and the interaction were significant at 75 DAS (p < 0.05). No significant difference existed for the rest of the season. In 2008, both landraces at 23 °C consistently produced more PDM than at 33 °C but this was only significant at 124 DAS (p < 0.05).
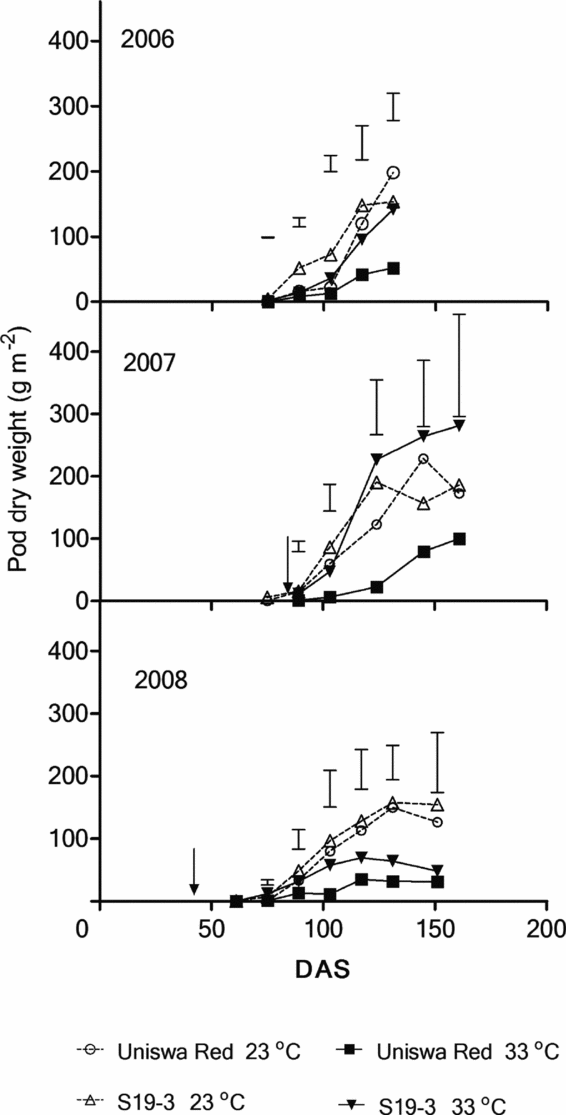
Figure 7. The effect of temperature on the PDM of two landraces of bambara groundnut (Uniswa Red and S19-3) grown at 23 °C and 33 °C in the TCRU glasshouses in 2006 (fully irrigated), 2007 (drought imposed at 77 DAS) and 2008 (drought imposed at 30 DAS). The arrows indicate the time when drought was imposed, and the vertical bars represent the standard error of difference (SED).
Yield and yield components
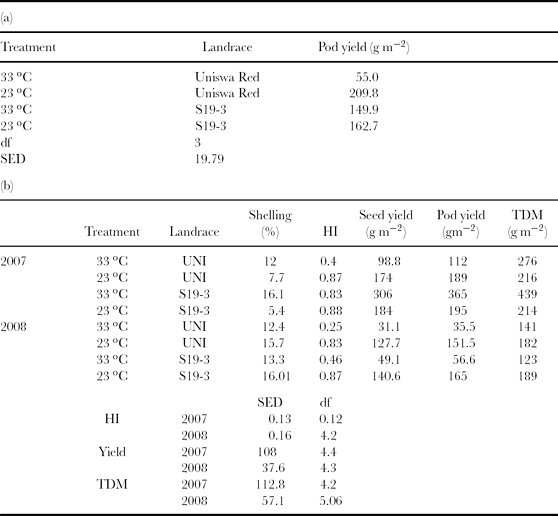
Table 2, part (a) and (b), show yield, shelling percentage and HI of the three growing seasons. The highest seed yield (306 g m−2) was produced by S19-3 in 2007 at 33 °C, while the lowest yield (31.1 g m−2) was produced by Uniswa Red in 2008 at 33 °C.
Table 2. Yield and yield components (shelling (%), HI, seed yield, pod yield and TDM) in two landraces of bambara groundnut (Uniswa Red (UNI) and S19-3) grown at low temperature (23 °C) and high temperature (33 °C) during the experiments in (a) 2006, (b) 2007 and 2008 in the TCRU glasshouses, University of Nottingham, UK.

In 2006, S19-3 produced similar pod yield at both temperatures, while Uniswa Red yield was reduced fourfold at 33 °C compared with 23 °C (p = 0.02). No significant effects were found in 2007. In 2008, yield was significantly lower at 33 °C than at 23 °C (p < 0.05) with both landraces responding similarly. A statistical analysis across 2007 and 2008 showed no significant effect, except for the difference between the total yield of 2007 and 2008 (p = 0.007).
Generally, shelling percentage (shell weight/pod weight × 100) was stable in 2007 and 2008 growing seasons, especially for Uniswa Red, while HI was highly reduced by drought in Uniswa Red at 23 °C and S19-3 at 33 °C.
DISCUSSION
The effect of water deficit on growth and development of bambara groundnut has been reported in a limited number of studies; Mwale et al. (Reference Mwale, Azam-Ali and Massawe2007) reported that drought decreased the production rate of leaves and the total leaf number produced. A reduction of 60% in leaf production and a reduction of 32% in LAI were reported by Collinson et al. (Reference Collinson, Berchie and Azam-Ali1999). Phenology was also reported to be affected by water deficit; Collinson et al. (Reference Collinson, Berchie and Azam-Ali1999) found that cumulative flower production was reduced by 50% due to drought, while Mwale et al., (Reference Mwale, Azam-Ali and Massawe2007) reported that pod numbers were reduced under drought.
The severity of stress that a crop experiences in water stress studies is critical to the interpretation of the results obtained. If water stress is significant for the purpose of the study, the stress should be enough to cause some physiological response in the crop (Mwale et al., Reference Mwale, Azam-Ali, Massawe and Roberts2003). The same reference emphasised that the drought should be severe enough to cause differences among varieties, landraces or species. The same concern was considered in this study. For that reason the severity of drought was increased progressively across the three years of glasshouse experiments (full irrigation 2006, drought imposed at 77 DAS in 2007 and at 30 DAS in 2008).
The soil moisture in the glasshouses decreased towards the end of the season in both years of measurements. However, the pattern of soil moisture in the four glasshouse treatments was different between 2007 and 2008. For example, in 2007 the highest moisture content was in S19-3 soil at 23 °C, but in 2008 it was in Uniswa Red soil at 23 °C. It is difficult to specify the reason for these differences, but it can be linked with TDM production, where the crops produced less TDM and therefore less transpiration under low temperature in both years. The other reason could be related to the root system (which has not been investigated in the present study). Root growth requires favourable temperature conditions. Better root growth improves the size of the root system and its capacity to provide the above ground parts of the plant with water and nutrients. The rate at which water, and at least some nutrients, is taken up by roots is also influenced by temperature. Indirectly, soil temperature influences plants through its impact on soil physical processes, particularly the rate of water loss through evaporation at the soil surface to the atmosphere (Gardner et al., Reference Gardner, Laryea and Unger1999). Alvarez-Uria and Korner (Reference Alvarez-Uria and Korner2007) reported that the low temperature could reduce water uptake rate. This could explain the higher soil water content at 23 °C in 2007 and 2008.
The difference between the leaf number at 33 °C and 23 °C is clear, especially in 2006 and 2007 when the soil moisture was not a limiting factor. The decrease in the difference between the leaf number at 33 °C and 23 °C in 2008 suggests that when crops are under temperature and water stress they respond to drought more than their response to temperature stress. That might lead to a conclusion that in the tropics crops can do better if they were under temperature stress only. For example, if a crop is under heat stress but with sufficient water supply, it will be able to transpire enough water to cool the leaves and keep a canopy temperature at the level where the crop can operate with less physiological stress, but this is not always the case. In 2006, although Uniswa Red had sufficient irrigation, it hardly produced any pods at high temperature, and most of the dry matter accumulated in the vegetative part. The loss of pollen viability under heat stress was reported to be the reason for lowered number of seeds produced in groundnut (Ong, Reference Ong1984).
Uniswa Red always gave the highest leaf number at 33 °C, and S19-3 had the lowest leaf number at 23 °C. Leaf numbers decreased with drought, it reached 120 per plant in 2006, and 81 in 2007 and a maximum of 60 in 2008. Leaf numbers in 2006 and 2007 were higher than the values reported by Mwale et al. (Reference Mwale, Azam-Ali and Massawe2007) for Uniswa Red and S19-3 at 28°C under non-limiting soil water. The decline in the leaf number always started at 33 °C before 23 °C. This pattern was reported by Squire (Reference Squire1990) where he indicated that leaves remained green at low temperature for longer period than the leaves grown at high temperature. He reported that leaves of cassava (Manihot esculenta) in Colombia remained on the plants for five months at 20 °C and for two months at 28 °C.
A number of environmental factors, such as temperature and drought, have been reported to affect the phyllochron (Wilhelm and McMaster, Reference Wilhelm and McMaster1995). The angular coefficient (slope) of the linear regression of the leaf number against the cumulative thermal time is the LAR (i.e. leaf per degree day, or leaf °Cd −1). In the present study, the phyllochron was estimated by the inverse of the slope of the linear regression of the leaf number against the thermal time (Mwale et al., Reference Mwale, Azam-Ali and Massawe2007). The thermal time requirements for leaf production (phyllochron) in the present study differed between temperatures and landraces. Throughout the three years of the glasshouse experiments, phyllochron at high temperature was always lower than the phyllochron at low temperature except for S19-3 in 2008 where phyllochron was similar at both temperatures. That is likely because of drought which slowed down LAR at 33 °C from 0.065 leaves °Cd−1 to 0.04 leaves °Cd−1. Drought reduced LAR for Uniswa Red at 33 °C from 0.094 leaves °Cd−1 under full irrigation to 0.055 leaves °Cd−1 at early season drought. Uniswa Red at 33 °C always had the highest LAR, which is consistent with the highest LAI and the highest leaf number Uniswa Red had throughout the seasons.
When calculating thermal time, a correction may be applied to the mean temperature if temperatures during part of a day fall below T b, which is defined as the lowest temperature at which development can occur, or rise above T o for rate of development or expansion (Squire, Reference Squire1990). In the present study, temperature rose above T o on several occasions during the period of glasshouse experiments at 23 °C and during all the period of growing seasons at 33 °C. That might be one of the reasons for the differences between the treatments, which had different patterns when the leaf number was plotted against the thermal time. The analysis of development in relation to thermal time is sometimes used indiscriminately and inappropriately. It needs knowledge of T b, which should ideally be measured in controlled conditions for at least one developmental process (Squire, Reference Squire1990). Massawe et al. (Reference Massawe, Azam-Ali and Roberts2003) studied T b for 10 landraces of bambara groundnut, but S19-3 and Uniswa Red were not included in his study. He found that the landraces had different T b ranging between 8.1 °C and 12 °C which in this study was assumed to be the same for both landraces (10 °C).This might be another reason for the differences in the relations between the leaf number and thermal time. Moreover, Squire (Reference Squire1990) reported that the attributes of a certain genotype are influenced by the environment from which the cultivars were obtained. Accordingly, the different origins of the landraces studied in the present study might have played a role in the differences in thermal time.
The onset of LAI decline differed between landraces, temperatures and years, especially in 2007 and 2008. The maximum LAI reached were 6.04, 4.7 and 2.9 for Uniswa Red at 33 °C, S19-3 at 33 °C and Uniswa Red at 33 °C in 2006, 2007 and 2008, respectively. Mwale et al. (Reference Mwale, Azam-Ali, Massawe and Roberts2003) reported that S19-3 at 28 °C did not reduce leaf area under drought, but in this study LAI of S19-3 decreased from 2.7 in 2006 to 1.2 in 2008 at 33 °C and from 1.2 in 2006 to 0.6 in 2008 at 23 °C. This disparity could be due to difference in temperature between the two studies. The highest (peak) LAI value of 6.4 in this study is higher than the values of Dip C reported by Mwale et al. (Reference Mwale, Azam-Ali, Massawe and Roberts2003).
In both temperature regimes, TDM was strongly affected by drought. The decrease in dry matter production as a result of drought is correlated with closure of stomata to save water (Mwale et al., Reference Mwale, Azam-Ali, Massawe and Roberts2003). CO2 fixation will decrease when stoma closes, which leads to reduction in dry matter production. Reduction in dry matter production under drought conditions was reported by several studies (Mwale et al., Reference Mwale, Azam-Ali, Massawe and Roberts2003).
Total dry matter was also affected by temperature. Throughout the three years of the glasshouse experiments, the TDM results showed that the accumulation was higher at 33 °C especially in 2006 and 2007. Because the plants used in this study were landraces that are, by definition, not genetically uniform, there was more variation within treatments (landraces) than would be expected in an experiment comparing varieties. This made it difficult to detect statistically significant differences. The other possible reason for the difficulty in detecting significant statistical differences is the limited number of treatment replicates (three glasshouses for 33 °C and two glasshouses for 23 °C). However, while statistical differences were rare, there were often consistent trends between treatments that are highlighted.
Mwale et al. (Reference Mwale, Azam-Ali and Massawe2007) reported that TDM of bambara groundnut reached 650 g m−2 at 28 °C and non-limiting soil moisture at the TCRU glasshouse. This value is higher than the values obtained in the experiments reported in this study (583 g m−2). However, the values obtained in the present study are higher than the values reported by Collinson et al. (Reference Collinson, Sibuga, Tarimo and Azam-Ali2000) from a field study in Tanzania, where the maximum TDM obtained from bambara groundnut was 422 g m−2. The results of the present study showed that TDM production was higher at 33 °C than at 23 °C. That might give an impression that high temperature increases the TDM production, but, in fact, the values of TDM obtained in this study at the two temperature regimes are both less than the values reported by Mwale et al. (Reference Mwale, Azam-Ali and Massawe2007) at 28 °C. That leads to the likelihood that temperatures above and below T o (28 °C) decreased TDM. This is supported by Gawronska et al. (Reference Gawronska, Thornron and Dwelle1992) who found in a study on potato (Solanum tuberosum L.) that increase in temperature caused reduction in dry matter production.
The consequences of drought on the developmental and physiological processes are more severe at high temperature than at low temperature. In a study on groundnut, Ong (Reference Ong1984) reported that the rate of foliage development increased to a maximum at 28–30 °C, whereas the rate of crop photosynthesis was remarkably conservative over a range of mean temperatures of 19–31 °C. The author reported that groundnut under high temperature stress produced fewer pegs and pods and that under high temperature the stem and leaf growth compete directly with reproductive organs for assimilates. This might be an explanation for the low pod production and high vegetative matter in Uniswa Red under high temperature in the present study. Ong (Reference Ong1984) also reported an effect of high temperature on pollen viability in groundnut.
The HI value of 0.46 reported by Mwale et al. (Reference Mwale, Azam-Ali and Massawe2007) as a mean of drought stressed and irrigated bambara groundnut is either comparable or less than the values obtained in the present study. Although the HI values presented in this study might be overestimated because of senescence, the statistical analysis showed no significant difference in 2007. Again, in 2008 the interaction effect was not significant, but in both landraces HI was significantly lower at 33 °C (p = 0.005). HI was reduced by drought except for S19-3 at 23 °C.
CONCLUSIONS
Both vegetative and reproductive growth were affected by drought and temperature stress. The landraces behaved similarly in some of their responses to temperature stress, but they differed in other responses. While high temperature encouraged greater leaf production and area, drought influences these trends. Uniswa Red gave very low yield at 33 °C compared with yield at 23 °C, whereas S19-3 yield was affected by high temperature only when drought became more severe. The study showed that high temperature with or without drought encourages vegetative growth at the expense of reproductive growth. HI was always higher at 23 °C in both landraces and years of glasshouse experiments. The landraces responded to severe drought by reducing canopy growth and yield. Under moderate drought, S19-3 at 33 °C gave the highest pod yield (365 gm−2) among the treatments throughout the three growing seasons. Under drought, S19-3 performed better than Uniswa Red, mainly because it had faster growth rate and shorter life cycle than Uniswa Red because of its natural environment and therefore it was able to complete its life cycle before the effect of heat and drought became significant.
Acknowledgements
This paper describes a series of experiments conducted at the University of Nottingham, UK that form part of an international research effort on bambara groundnut (BAMLINK) funded by the EU (contract INCO-CT-2005-015459). The scientific contribution with the experimental data of 2006 by Asha Karunaratne (University of Nottingham) is appreciated.


