


Introduction
Livestock production in Brazil is predominantly pasture-based and relies on tropical forage grasses. Despite their importance for nutrient cycling and nitrogen incorporation into the soil through biological N fixation, forage legumes still represent a small portion of cultivated species, especially due to low persistency when growing in mixtures with forage grasses (Gimenes et al., Reference Gimenes, Barbosa, Gerdes, Giacomini, Batista, Mattos, Premazzi and Miguel2017). Among the forage legumes, the pintoi perennial peanut (Arachis pintoi Krapovickas & Gregory) has been identified as promising, with potential for use under grazing due to its persistence when cultivated in low-fertility soils (Rincón et al., Reference Rincón, Cuesta, Perez, Lascano and Fergurson1992), shade tolerance (Cook, Reference Cook, Pengelly, Brown, Donnelly, Eagles, Franco and Schultze-Kraft2005), great herbage production and nutritive value (Valentim et al., Reference Valentim, Andrade, Mendonca and Sales2003), and great potential for biological N fixation (Miranda et al., Reference Miranda, Vieira and Cadisch2003) both as monoculture (Fernandes et al., Reference Fernandes, Ramos, Carvalho, Maciel, de Assis and Braga2017) or in mixed pastures (Jones, Reference Jones1993). However, information regarding plant responses and tolerance to grazing as well as grazing management guidelines are scarce, preventing its wider adoption in cultivated pastures.
Rotational stocking is extensively used in cultivated pastures and ideally characterized by the need to specify management targets at pre- and post-grazing conditions, taking into account the biological potential of forages while optimizing herbage intake of the grazing animals. For most tropical forage grasses under moderate defoliation severity (less than 60% removal of the pre-grazing height), the grazing frequency has been identified as an important factor as it determines competition for light during regrowth (Da Silva et al., Reference Da Silva, Sbrissia and Pereira2015). After grazing, forage accumulation is predominantly from leaves shifting to a predominance of stem and dead material when more than 95% of the incident light (LI95%) are intercepted by the canopy (Da Silva et al., Reference Da Silva, Sbrissia and Pereira2015). Such changes in morphological composition beyond the LI95% result in lesser herbage nutritive value (Trindade et al., Reference Trindade, Da Silva, Souza Júnior, Giacomini, Zeferino, Guarda and Carvalho2007) and also impose restrictions to herbage intake, with negative impact on animal performance (Fonseca et al., Reference Fonseca, Mezzalira, Bremm, Gonda and Carvalho2012).
The post-grazing condition defines the remaining herbage mass (HM), the vertical distribution of the morphological components and leaf area index (LAI), which will affect the plant reestablishment and regrowth (Da Silva et al., Reference Da Silva, Sbrissia and Pereira2015). Thus, post-grazing targets should favor rapid recovery after grazing and ensure great herbage production, persistence, and intake. For tropical forage grasses, these objectives have been achieved when grazing severities correspond to a range between 40 and 60% of the pre-grazing canopy height (CH) (Fonseca et al., Reference Fonseca, Mezzalira, Bremm, Gonda and Carvalho2012). Similar knowledge and information for tropical forage legumes are scarce, even though essential for their successful use in grazed pastures.
Before associating legumes with forage grasses in mixed pastures, we must know and understand how they grow, how herbage is accumulated during regrowth, and how plant persistence and productivity are affected by grazing. Assuming that the regrowth dynamics of the pintoi forage peanut is similar to those of forage grasses, the following hypotheses were tested: (i) the ideal time to interrupt regrowth of pintoi peanut is also at LI95%; (ii) grazing severities corresponding to the post-grazing heights ranging from 40 to 60% of the pre-grazing CH are also within the limits of grazing tolerance of forage peanut and would have only minor impacts on canopy structure and herbage accumulation. The objective of this study was to evaluate canopy characteristics and herbage accumulation of pintoi peanut subjected to strategies of rotational grazing management typical of those used for tropical forage grasses.
Material and Methods
Site, previous use, treatments, and experimental design
The experiment was carried out from November 2014 to April 2016 at Piracicaba SP, Brazil (22°42′S, 47°38′W and 546 m a.s.l.). The climate is a Cwa type according to Köppen classification, subtropical with dry winter, with an average annual rainfall of 1328 mm (CEPAGRI, 2016). To avoid water deficit during the experiment, an irrigation system was installed in the experimental area and weather conditions were monitored with a meteorological station located at 500 m from the experimental site. When irrigation was necessary, 15 mm equivalent rainfall were applied aiming at reaching 70% of soil field capacity (CEPLAC, 2011). The average daily air temperatures during the experimental period varied from 19.7°C in July 2015 to 27.7°C in January 2015 (Supplementary Material Figure S1). The average air temperatures and rainfall during the experimental period were higher than the historical average values (considering the last 100 years).
The experimental area of around 4000 m2 was established in November 2011, using stolon pieces of Arachis pintoi Krapovickas & Gregory cv. Belmonte. The soil is an Eutric Kandiudalf with high fertility. Average soil chemical characteristics for the 0–20 cm layer were pH CaCl2 = 5.85, organic matter = 41 g dm−3, P (resin) = 77 mg dm−3, Ca = 87.5 mmolc dm−3, Mg = 50 mmolc dm−3, K = 16.3 mmolc dm−3, H + Al = 26.5 mmolc dm−3, sum of bases = 146.3 mmolc dm−3, cation exchange capacity = 172.8 mmolc dm−3, and soil base saturation = 84%. These values were considered adequate for pintoi peanut (Rao and Kerridge, Reference Rao, Kerridge, Kerridge and Hardy1994) and no fertilization was applied.
After plant establishment, the area was divided into 16 paddocks (approximately 210 m2 each), which were used for a series of experiments mimicking contrasting intensities of continuous stocking management (swards maintained at 5, 10, 15, and 20 cm) through controlled grazing twice a week from November 2012 to March 2014 (Carvalho, Reference Carvalho2014). From April 2014 to November 2014, all paddocks were subjected to a common rotational grazing management to minimize possible carryover effects from previous experiments. Treatments corresponded to all possible combinations of two grazing frequencies (95% and maximum canopy light interception (LI) during regrowth – LI95% and LIMax, respectively) and two grazing severities (40 and 60% of the pre-grazing CH – R40% and R60%, respectively; Fonseca et al., Reference Fonseca, Mezzalira, Bremm, Gonda and Carvalho2012), and were allocated to experimental units according to a 2 × 2 factorial arrangement and a randomized complete block design, with four replications. Before the beginning of the experiment, paddocks were adapted to the defoliation treatments from November 2014 to February 2015 (adaptation period). Data collection started in late February 2015 and ended in April 2016, comprising two growing seasons (summer 2015 to autumn 2016, with no interruption). Holstein heifers were used to impose defoliation according to treatment specifications. The number of animals required to finish grazing in 10–12 h (day grazing only) was calculated using the ‘mob grazing’ method (Gildersleeve et al., Reference Gildersleeve, Ocumpaugh, Quesenberry and Moore1987).
Evaluations
The following response variables were evaluated at both pre- and post-grazing conditions: canopy LI, CH, HM, botanical and morphological composition of the HM, sward LAI and total herbage (HARs), leaflet (LARs), and stolon (SARs) accumulation rates.
Measurements of canopy LI and CH were taken continuously throughout the adaptation and experimental periods. Canopy LI was measured using a LAI-2000 canopy analyzer (LI-COR, Lincoln NE, USA). Measurements started at post-grazing and were taken on a weekly basis during regrowth until a reading of 90% was reached. After this point, measurements were taken every 2 days until the LI95% and LIMax targets were reached. Maximum canopy LI (LIMax) was reached when the measured value did not change over two consecutive evaluations. Readings were taken at eight random sampling areas per paddock that were representative of the mean canopy condition at the time of sampling (visual assessment of HM and CH). At each sampling area, 1 reading was taken above the canopy and 5 were taken at soil level, totaling 8 readings above the canopy and 40 readings at the ground level per paddock. Measurements of CH were taken at both post- and pre-grazing conditions. Fifty readings per paddock were systematically taken along four transect lines, using a sward stick (Bathram, Reference Barthram1985).
Measurements of HM and its botanical and morphological composition were made at post- and pre-grazing during one regrowth cycle every season (summer I, autumn/winter, early spring, late spring, and summer II). From each paddock, two samples were harvested at soil level using a 0.90 × 0.37 m guide at both post- and pre-grazing. After clipping, samples were weighed fresh and two subsamples were used to determine dry matter (DM) and evaluate the presence of weeds, leaflets (leaf laminae), petioles, stolons, and dead material. Leaflets were scanned in a LAI-3100 leaf area meter (LI-COR, Lincoln, NE, USA) and the data used to calculate sward LAI. After LAI evaluation, samples were dried in an oven at 65 °C until constant weight along with all the botanical and morphological components. The botanical and morphological composition of the HM were evaluated as percentage of the total dry weight. Rates of total herbage and botanical/morphological components accumulation were calculated as the difference between pre- and post-grazing taking into account the duration of the grazing interval.
Statistical analysis
The dataset was organized according to seasons as follows: adaptation period, summer I, autumn/winter, early spring, late spring, and summer II. The data were analyzed using the Mixed Procedure of SAS 9.3 (SAS Institute Inc., Cary, NC). Different structures of the variance–covariance matrices were tested and the Bayesian information criterion was adopted to select the best fit matrix. The percentage of weeds in sward HM at the beginning of the adaptation period was used as covariate. The sources of variation corresponded to LI pre-grazing (LI), grazing severity (GS), season and their interactions, which were considered fixed effects. Season was treated as repeated measure. When appropriate, means were calculated using the ‘LSMEANS’ statement and comparisons were made using the Student’s test (p < 0.05).
Results
The greatest number of grazing cycles was recorded when pastures were managed with the LI95% target: 8.80 ± 0.48, 10.80 ± 0.63, 8.00 ± 0.00, and 8.50 ± 0.29 grazing cycles for treatments LI95%/R40%, LI95%/R60%, LIMax/R40%, and LIMax/R60%, respectively. A statistical summary and the results from the analysis performed are shown in Supplementary Material Table S1. Longer grazing intervals were recorded during autumn/winter and shorter during late spring and summer. Pastures managed with the LIMax and/or R40% targets had longer grazing intervals than those managed with the LI95% and/or R60% targets (Supplementary Material Table S2).
Canopy structural characteristics at pre-grazing
Pre-grazing CH varied with LI (p < 0.0001) and season (p = 0.0012). The pre-grazing CH was higher on swards managed with the LIMax relative to those managed with LI95% (Table 1). The LAI varied with LI (p < 0.0001), season (p < 0.0001), and the LI × season interaction (p = 0.0348). For both LI targets, LAI was lower during the adaptation period and summer I, but it increased during early and late spring, decreasing slightly during summer II. Differences caused by LI targets on LAI were recorded only during summer I and autumn/winter, when higher values were recorded on swards managed with LIMax relative to those managed with LI95% (Figure 1).
Table 1. Pre-grazing canopy height (CH), herbage mass (HM), and percentage of leaflets (LE) of Arachis pintoi cv. Belmonte (mean ± standard error) subjected to strategies of rotational grazing management from November 2014 to April 2016. LI95% and LIMax are grazing frequencies corresponding to grazing at 95% and maximum canopy light interception during regrowth. R40% and R60% are grazing severities corresponding to post-grazing heights equivalent to 40 and 60% of the pre-grazing
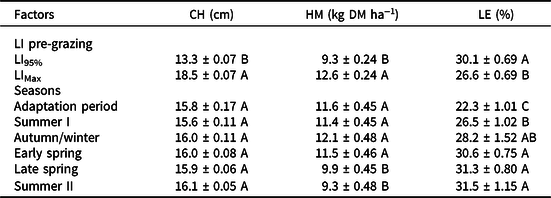
Adaptation period = November 10, 2014 to February 03, 2015; Summer I = February 04 to April 02, 2015; Autumn/winter = April 03 to September 22, 2015; Early spring = September 23 to November 5, 2015; Late spring = November 06 to December 20, 2015; and Summer II = December 21, 2015 to March 17, 2016. Means followed by the same uppercase letters in columns are not different (p > 0.05).

Figure 1. Pre-grazing leaf area index (LAI) of Arachis pintoi cv. Belmonte subjected to strategies of rotational grazing management from November 2014 to April 2016. LI95% and LIMax are frequencies of defoliation corresponding to grazing at 95% and maximum canopy light interception during regrowth. Bars represent the standard error of the means. Uppercase letters are comparing frequencies of defoliation within seasons of the year. Lowercase letters are comparing seasons of the year within frequencies of defoliation. Means followed by the same letter are not different (p>0.05). Adaptation period = November 10 2014 to February 03, 2015; Summer I = February 04 to April 02, 2015; Autumn/winter = April 03 to September 22, 2015; Early spring = September 23 to November 5, 2015; Late spring = November 06 to December 20, 2015; and Summer II = December 21, 2015 to March 17, 2016.
Pre-grazing HM was higher on swards managed with LIMax relative to LI95% (p < 0.001). During the experiment, HM remained stable from the adaptation period to early spring, decreasing during late spring and summer II (p = 0.001) (Table 1). More frequent grazing (LI95%) resulted in lower HM but higher leaflet percentage when compared with less frequent grazing (LIMax) (p = 0.0002) (Table 1). Higher leaflet percentage was recorded during early and late spring and summer II, followed by autumn/winter, summer I, and adaptation period (p < 0.0001) (Table 1). The percentage of stolons varied with LI (p < 0.0001), GS (p = 0.0136), season (p < 0.0001), and with the LI × season (p = 0.0041) and GS × season (p = 0.0453) interactions. Differences between LI were observed during the adaptation period, summer I and late spring, with the highest values recorded on swards managed with the LIMax target (Table 2).
Table 2. Percentage of stolons at pre-grazing in Arachis pintoi cv. Belmonte (mean ± standard error) subjected to strategies of rotational grazing management from November 2014 to April 2016. LI95% and LIMax are grazing frequencies corresponding to grazing at 95% and maximum canopy light interception during regrowth. R40% and R60% are grazing severities corresponding to post-grazing heights equivalent to 40 and 60% of the pre-grazing canopy height

Adaptation period = November 10, 2014 to February 03, 2015; Summer I = February 04 to April 02, 2015; Autumn/winter = April 03 to September 22, 2015; Early spring = September 23 to November 5, 2015; Late spring = November 06 to December 20, 2015; and Summer II = December 21, 2015 to March 17, 2016. Means followed by the same uppercase letters in columns and lowercase letters in rows are not different (p > 0.05).
GS did not affect the percentage of petioles and stolons throughout the experiment. The percentage of petioles varied with LI (p < 0.0041), GS (p = 0.026), season (p < 0.0001), and with the GS × season interaction (p = 0.0323). In relation to GS, similar values of petiole percentage were recorded on swards managed with the R40% and R60% targets, except during summer II, when R40% resulted in higher percentage of petioles than R60% (Table 3). When considering LI, higher values of petiole percentage were recorded on swards managed with LI95% (8.0 ± 0.2%) compared to those managed with LIMax (7.3 ± 0.2%). The percentage of dead material varied with season (p < 0.0001) and was also affected by the LI x season interaction (p = 0.0029). Differences in dead material percentage between LI targets were observed during the adaptation period and summer I, when higher values were recorded on swards managed with LI95% relative to those managed with LIMax. The opposite pattern happened during early spring. Regardless of LI pre-grazing, higher dead material percentage was recorded during autumn/winter relative to the remaining seasons (Table 3).
Table 3. Percentage of petioles and dead material at pre-grazing in Arachis pintoi cv. Belmonte (mean ± standard error) subjected to strategies of rotational grazing management from November 2014 to April 2016. LI95% and LIMax are grazing frequencies corresponding to grazing at 95% and maximum canopy light interception during regrowth. R40% and R60% are grazing severities corresponding to post-grazing heights equivalent to 40 and 60% of the pre-grazing canopy height

Adaptation period = November 10, 2014 to February 03, 2015; Summer I = February 04 to April 02, 2015; Autumn/winter = April 03 to September 22, 2015; Early spring = September 23 to November 5, 2015; Late spring = November 06 to December 20, 2015; and Summer II = December 21, 2015 to March 17, 2016. Means followed by the same uppercase letters in columns and lowercase letters in rows are not different (p > 0.05).
Canopy LI and structural characteristics at post-grazing
Post-grazing canopy LI was affected by GS (p < 0.0001), season (p < 0.0001), and the LI × season (p = 0.0356) and GS × season (p = 0.0021) interactions. Higher canopy LI was recorded during autumn/winter and early spring relative to summer II. Grazing frequency affected canopy LI post-grazing during autumn/winter and late spring only, with higher values recorded on swards managed with LIMax relative to those managed with LI95%. Except during the adaptation period, canopy LI was higher for R60% than R40% (Supplementary Material Table S3).
Post-grazing HM varied with LI (p < 0.0001), GS (p < 0.0001), season (p = 0.0031), and the LI × season interaction (p = 0.0044). The greatest post-grazing HM was recorded during autumn/winter (Supplementary Material Table S3). For R40%, post-grazing, HM remained stable from the adaptation period until early spring, when it decreased by approximately 20% during late spring and summer II. For R60%, post-grazing HM increased from the adaptation period to early spring, decreasing during late spring and summer II. Differences in post-grazing HM were recorded during autumn/winter, early and late spring, with values 37% higher for R60% than R40%.
Post-grazing canopy LAI was affected by LI (p = 0.0086), GS (p < 0.0001), and season (p = 0.0058), with higher values recorded for treatment LIMax/R60% relative to LI95%/R40%. The highest post-grazing LAI was recorded during autumn/winter and early spring (Table 4). Similar to LAI results, higher post-grazing HM was recorded on swards subjected to treatment LIMax/R60% relative to those subjected to LI95%/R40%.
Table 4. Post-grazing leaf area index (LAI) and percentage of leaflets (LE), stolons (S), petioles (PET), and dead material (DDM) of Arachis pintoi cv. Belmonte (mean ± standard error) subjected to strategies of rotational grazing management from November 2014 to April 2016. LI95% and LIMax are grazing frequencies corresponding to grazing at 95% and maximum canopy light interception during regrowth. R40% and R60% are grazing severities corresponding to post-grazing heights equivalent to 40 and 60% of the pre-grazing canopy height

Adaptation period = November 10, 2014 to February 03, 2015; Summer I = February 04 to April 02, 2015; Autumn/winter = April 03 to September 22, 2015; Early spring = September 23 to November 5, 2015; Late spring = November 06 to December 20, 2015; and Summer II = December 21, 2015 to March 17, 2016. Means followed by the same uppercase letters in columns are not different (p > 0.05).
Less severe defoliation (R60%) resulted in higher (p = 0.0005) leaflet percentage as compared to more severe defoliation (R40%), with the highest values recorded during autumn/winter and early spring (p = 0.0081) (Table 4). Similar results were found for petiole percentage. R60% resulted in greater petiole percentage relative to R40% (p = 0.0002), with the highest values recorded during autumn/winter and early spring (p = 0.0028) (Table 4). The percentage of stolons varied with LI (p < 0.0001), GS (p = 0.0016), and season (p < 0.0001), with higher values recorded on swards managed subjected to treatment LIMax/R40% relative to those subjected to LI95%/R60%. Higher stolon percentage was recorded during summer II followed by those during summer I, late spring, autumn/winter, and early spring (Table 5). More frequent grazing (LI95%) resulted in increased dead material percentage as compared to the less frequent grazing (LIMax) (p < 0.0002), with greater values recorded during autumn/winter, early and late spring (Table 4).
Table 5. Total (HARs), leaflet (LAR), and stolon (SARs) accumulation rates of Arachis pintoi cv. Belmonte (mean ± standard error) subjected to strategies of rotational grazing management from February 2015 to April 2016

Summer I = February 04 to April 02, 2015; Autumn/winter = April 03 to September 22, 2015; Early spring = September 23 to November 5, 2015; Late spring = November 06 to December 20, 2015; and Summer II = December 21, 2015 to March 17, 2016. Means followed by the same uppercase letters in columns are not different (p > 0.05).
The rates of total herbage and leaflet accumulation were only affected by season (p < 0.0001 for both), whereas rates of stolon accumulation varied with grazing frequency (p < 0.0301) and season (p < 0.0001). Higher rates of both total herbage and leaflet accumulation were recorded during summer I and summer II, followed by those in late and early spring, and autumn/winter (Table 5). The highest SARs were recorded during summer I, while the smallest were recorded during autumn/winter. Swards managed with LIMax showed greater rates of stolon accumulation than those managed with LI95% (37.0 ± 6.4 and 58.0 ± 5.9 kg DM ha−1 day−1 for LI95% and LIMax, respectively).
Discussion
Two patterns of response were identified in the pre-experiment and the experimental period; one during the adaptation period and summer I (first growing season) and other during late spring and summer II (second growing season). During the first growing season, rates of stolon accumulation (Table 5) and pre-grazing HM (Table 1) were higher, with higher percentage of stolons (Table 2), lower percentage of leaflets (Table 1), and lower LAI than during the second growing season (Figure 1). Stolon elongation during the beginning of the experiment indicates the colonization ability of Arachis pintoi, a well-known characteristic of stoloniferous species such as Glechoma hederacea L. (Birch and Hutchings, Reference Birch and Hutchings1999), Eichhornia crassipes (Mart.) Solms (Méthy et al., Reference Méthy, Alpert and Roy1990), Potentilla reptans L. and Potentilla anserina L. (Louâpre et al., Reference Louâpre, Bittebière, Clément, Pierre and Mony2012). The stolons, also called spacers, play an important role in space exploitation and resource capture (Ottaviani et al., Reference Ottaviani, Martínková, Herben, Pausas and Klimešová2017) in clonal plants such as Arachis pintoi. The ability to spread horizontally through spacers enables plants to colonize new sites in the environment (Chen et al., Reference Chen, Vermeulen, During and Anten2015). The colonization of new sites appears to follow a cyclic process comprising the production and maintenance of long clonal segments, which are subsequently fragmented in small physiologically autonomous units (Birch and Hutchings, Reference Birch and Hutchings1999). In several stoloniferous species, the survival of those fragmented segments is warranted by rooting of old nodes prior to fragmentation (Chen et al., Reference Chen, Vermeulen, During and Anten2015). Thus, stolon development during the adaptation period and the first summer suggests an adjustment phase for space occupation regardless of the defoliation regimes imposed (i.e., grazing treatments) (Table 2). This process is consistent with the differences in rates of total herbage and stolon accumulation observed between the first and second growing seasons (adaptation period and first summer vs late spring and second summer; Table 5). This is also consistent with the results of a previous series of experiments in the same experimental area, where Fialho (Reference Fialho2015) reported that increase in plant size, particularly bigger stolons, is prioritized under favorable growing conditions, most likely as a mean of maximizing resource capture. Conversely, when growth conditions become restrictive during autumn, the maintenance of large plants would be too costly. Then, plants begin to root on older nodes and then segment, forming small new autonomous plants (Thomas and Hay, Reference Thomas and Hay2004), increasing the probability of survival of individual plants until the beginning of the new growing season (Birch and Hutchings, Reference Birch and Hutchings1999).
There was a seasonal pattern of herbage accumulation, likely a consequence of seasonal variations in air temperature and solar radiation since the experimental area was irrigated. During the periods of active plant growth (first summer, late spring, and second summer) sward HM showed higher percentages of stolon at pre- and post-grazing than during periods of reduced plant growth (autumn/winter and early spring) (Tables 2 and 4). The percentage of leaflets and petioles and the post-grazing LAI, however, were higher during autumn/winter and early spring relative to late spring and second summer (Table 4). Additionally, the percentage of leaflets in the pre-grazing HM increased 15.5% from the first summer to early spring (Table 1). For the same period, the pre-grazing LAI increased 42.2% on swards managed with LI95% and 21.9% on those managed with LIMax (Figure 1). This conflicts with what is commonly described for seasonal change in morphological composition in perennial tropical forage grasses during the transition between two consecutive growing seasons (Carnevalli et al., Reference Carnevalli, Da Silva, Bueno, Uebele, Bueno, Hodgson and Morais2006; Da Silva et al., Reference Da Silva, Sbrissia and Pereira2015). The increasing percentage of leaf components (leaflets and petioles) during autumn/winter and early spring is most likely a consequence of the segmentation process of large clonal plants formed during periods of active plant growth being divided into a large number of small autonomous plants when climatic conditions start to become restrictive to plant growth in autumn (Fialho, Reference Fialho2015).
The natural segmentation, or programmed segmentation, appears to be modulated by the costs of maintenance of those long clonal systems (Birch and Hutchings, Reference Birch and Hutchings1999). For white clover, restrictive climatic conditions during autumn, such as decreased day length and low temperatures, increase the costs for maintenance of long stolons. Then, the death of the basal portion of older stolons induces the rupture of the vascular connections between ‘ramets’ and the rooting of nodes in old ‘ramets’ followed by physical disintegration of vascular connections can occur naturally as a mechanism that increases the probability of plant survival. The growth of new plants remains slow until the reestablishment of favorable conditions in late spring, when vegetative growth increases and a new cycle begins, with increased assimilate partitioning to stolon, petiole, and leaflets. Following the critical period, white clover renovates through reseeding but success is dependent on grazing management (e.g., grazing frequency and intensity) to enhance seedling survival (Brock et al., Reference Brock, Hyslop, Widdup and Moot2003). Thus, based on this natural vegetative cycle of growth and development, manipulation of grazing frequency and severity throughout the year must be careful. Severe or excessively frequent grazing during autumn may compromise the natural clonal segmentation, resulting in negative impacts on the establishment and persistence of plant population and herbage production in the following growing season.
GS defines the remaining structures for regrowth. Alonzo et al. (Reference Alonzo, Ferreira, Vaz, Costa, Motta and Brondani2017) reported negative impacts on regrowth of Arachis pintoi cv. Amarillo when defoliation removed more than 60% of the pre-grazing CH, which corresponded to 14 cm. In this study, the R60% target resulted in increased percentage of leaflets (Table 4) and sward HM (Table S3) and, as a result, high post-grazing LAI (Table 4). However, grazing severity had only minor impact on canopy structural characteristics (e.g., LAI and HAR) at the pre-grazing condition, confirming our second experimental hypothesis that defoliation severities within the range of 40 to 60% of the pre-grazing height are not severe enough to impair sward structure and herbage accumulation. When considering the shoot traits and the rates of herbage accumulation, grazing severities corresponding to a removal of up to 60% of the pre-grazing CH (R40%) seem to be adequate for Arachis pintoi, as there were no negative impacts on regrowth and herbage accumulation (Table 5).
Canopy LI, defined in this experiment as targets of LI pre-grazing, also affected canopy structural characteristics at post-grazing. Swards managed with LI95% had similar percentage of leaflets to those managed with LIMax, but a lower percentage of stolons, lower HM, and lower LAI. Conversely, the LI95% target resulted in a greater percentage of leaflets and petioles, shorter CH at pre-grazing (13.3 and 18.5 cm for LI95% and LIMax, respectively) and shorter grazing intervals. The greater pre-grazing HM and LAI of swards managed with LIMax are certainly consequence of the longer regrowth periods compared to LI95% (Table S2). The longer grazing intervals favored shoot vegetative growth and stolon elongation. Stolons play an important role for storage of organic reserves besides acting as resource-acquiring structures through foraging (Hutchings, Reference Hutchings1988), particularly in dense canopies or at the end of regrowth. Similar to grass stems, stolon elongation can be considered as one typical response to shade that allows the increase in the horizontal canopy profile and exploitation of patches with higher availability of resources. Structures such as petioles explore the vertical canopy profile, positioning leaves in the upper canopy layers (Hutchings and Kroon, Reference Hutchings and Kroon1994). The ability to alternate between horizontal and vertical growth maximizes the efficiency of the photosynthetic process when plants are subjected to environments with low availability of resources or in situations of competition for light (Holmes et al., Reference Holmes, Farmer and Bartley1983). Several experiments described this growth pattern for temperate forage grasses (Parsons and Penning, Reference Parsons and Penning1988; Korte et al., Reference Korte, Watkin and Harris1982) and this was also observed in tropical grass species (Carnevalli et al., Reference Carnevalli, Da Silva, Bueno, Uebele, Bueno, Hodgson and Morais2006; Da Silva et al., Reference Da Silva, Sbrissia and Pereira2015; Trindade et al., Reference Trindade, Da Silva, Souza Júnior, Giacomini, Zeferino, Guarda and Carvalho2007). In tropical perennial forage grasses, a common pattern of growth has been described and is characterized by the decrease in leaf accumulation and an increase in stem and dead material accumulation after 95% interception of the incident light is reached during regrowth (Da Silva et al., Reference Da Silva, Sbrissia and Pereira2015).
Despite the low HM at pre-grazing, frequent grazing associated with LI95% target resulted in high percentage of leaflets in Arachis pintoi. The LIMax target resulted in higher SARs when compared to LI95%. Similar rates of total herbage and leaflet accumulation were found for both grazing frequencies determined by LI95% and LIMax. The negative impacts of the stolon elongation in pintoi forage peanut appear to be less detrimental to the short-term herbage intake than stem elongation in tropical forage grasses after canopy reaches 95% interception of the incident light (Silva et al., Reference Silva, Fialho, Carvalho, Fonseca, Carvalho, Bremm and Da Silva2018). For forage production, shorter grazing intervals and consequently more grazing cycles in swards managed at LI95% ensure high nutritive value forage as well as a better supply and distribution of the produced herbage. Thus, the response patterns of Arachis pintoi to the defoliation regimes studied are analogous to those described for tropical forage grasses, partially validating our first hypothesis. However, since there was no reduction in total herbage and leaflet accumulation (Table 5), the increased stolon accumulation in swards managed with the LIMax target may not represent a real constraint to herbage intake and animal performance as stolons are usually positioned at the bottom of the sward.
Conclusions
As conclusion, Arachis pintoi is a very flexible forage plant. Under rotational grazing, targets of pre-grazing height may vary from 13 to 18 cm, with post-grazing heights equivalent to 40–60% of the pre-grazing height.
Supplementary material
To view supplementary material for this article, please visit https://doi.org/10.1017/S0014479720000113
Acknowledgements
The authors would like to thank the Coordenação de Aperfeiçoamento de Pessoal de Nível Superior (CAPES) for the PhD scholarship of the first author, to Prof. Carlos Guilherme Silveira Pedreira for the valuable comments and suggestions and Bia Anchão Oliveira and Luiz Henrique Goulart Bernardes for their help during the experiment.


