INTRODUCTION
Irrigation covers 20% of all cultivated land and accounts for about 40% of agricultural production (Molden, Reference Molden2007). Irrigation accounts for ~70% of all the world's freshwater withdrawals. Rapidly increasing non-agricultural demands for water, changing food preferences and global climate changes have placed increasing pressure on scarce water resources (Rosegrant et al., Reference Rosegrant, Ringler and Zhu2009). In order to sustain the rapidly growing world population, agricultural production need to increase (Howell, Reference Howell2001), although the portion of freshwater currently available for agriculture is decreasing (Cai and Rosegrant, Reference Cai, Rosegrant, Kijne, Barker and Molden2003). The problem of ensuring an adequate supply of agricultural products and protecting water resources is particularly acute in arid regions where water is the most limiting factor for crop cultivation.
The Indian hot arid region covers 31.7 million ha. About 62% of the total hot arid region is located in the state of Rajasthan, India. The arid Rajasthan is divided into the following four agro-climatic zones: (i) arid western plain, (ii) irrigated north-western plain, (iii) transitional plain of inland drainage and (iv) transitional plain of luni basin (Kathju et al., Reference Kathju, Joshi, Rao, Parveen, Faroda and Singh1998). Of those, arid western plain is the largest (12.37 million ha). It is primarily a rainfed crops (pearl millet, cluster bean, moth bean, sesame) growing area. Rainfed crop production is low, unstable and risky in this region (Rathore et al., Reference Rathore, Singh and Beniwal2009). With the creation of irrigation facilities, the traditional rainfed crops, such as Pennisetum typhoides, Vigna aconitifolia, Cyamopsis tetragonoloba and Sesamum indicum, have been replaced with Arachis hypogaea, Gossypium hirusutum, Triticum aestivum and Brassica juncea (Joshi and Saxena, Reference Joshi, Saxena, Singh and Kar1997). Irrigation water is a critical scarce resource in the state of Rajasthan, particularly in western arid and semi-arid regions (Singh et al., Reference Singh, Rao and Regar2010). Groundwater, which constitutes 52.3% share in the total irrigated area in north-western Rajasthan, is depleting at an alarming rate (Rathore, Reference Rathore2003). Groundnut (GN)–wheat (W) is a common cropping system in groundwater-irrigated area (Rathore et al., Reference Rathore, Singh, Soni, Yadava and Beniwal2010). Both these crops have high water requirement. The continuous cultivation of groundnut–wheat cropping system poses a serious threat to the sustainability of groundwater resource. Identification of suitable cropping systems that make the best use of water resources and provide higher yields and returns is important if the diverse needs of farming communities and environmental sustainability in arid regions are to be catered (Joshi et al., Reference Joshi, Dayal, Saxena, Kumawat, Singh, Bhati, Burman, Rao, Regar, Tanwar, Singh, Singh, Kar, Garg, Singh and Kathju2009). Management inputs interact with cropping systems and dictate their efficiencies (Riedell et al., Reference Riedell, Schumacher, Clay, Ellsbury, Pravecek and Evenson1998). Inherent poor soil fertility, particularly soils low in nitrogen, phosphorus and sulfur content, are another major factor responsible for low productivity of crops in hot arid regions. Therefore, simultaneous optimization of nutrient application and cropping systems will provide optimum yield and water use efficiency (WUE).
Most of the previous works on cropping systems in this region have focused on component crops of cropping systems; and further focused on a narrow range of criteria, e.g. yields, returns and the effect on soil properties of different cropping systems (Rao et al., Reference Rao, Tarafdar, Sharma, Kumar and Aggarwal1995; Saxena et al., Reference Saxena, Singh and Joshi1997; Singh et al., Reference Singh, Singh and Patidar2008a). To date, very little information is available regarding the productivity, profitability and WUE of contrasting irrigated cropping systems in the hot arid region of India. This assessment is needed for understanding option for diversification in the region.
The present experiment was conducted with the objective of assessing yields, returns, and WUE of five cropping systems. This paper reports the results of field experiment that tested the hypothesis that a diversified rotation could provide yields (Y), WUE and net returns (NR) that matched or exceeded those from groundnut–wheat. Crop yields are reduced by nutrient deficiencies in Indian hot arid region (Faroda et al., Reference Faroda, Joshi, Singh and Saxena2007), so this study also tested the hypothesis that nutrient management could also improve crop yields, profit and WUE. The results from this study facilitate the selection of efficient cropping systems and nutrient management options in iso-agroclimatic regions of the world.
MATERIALS AND METHODS
Study environment
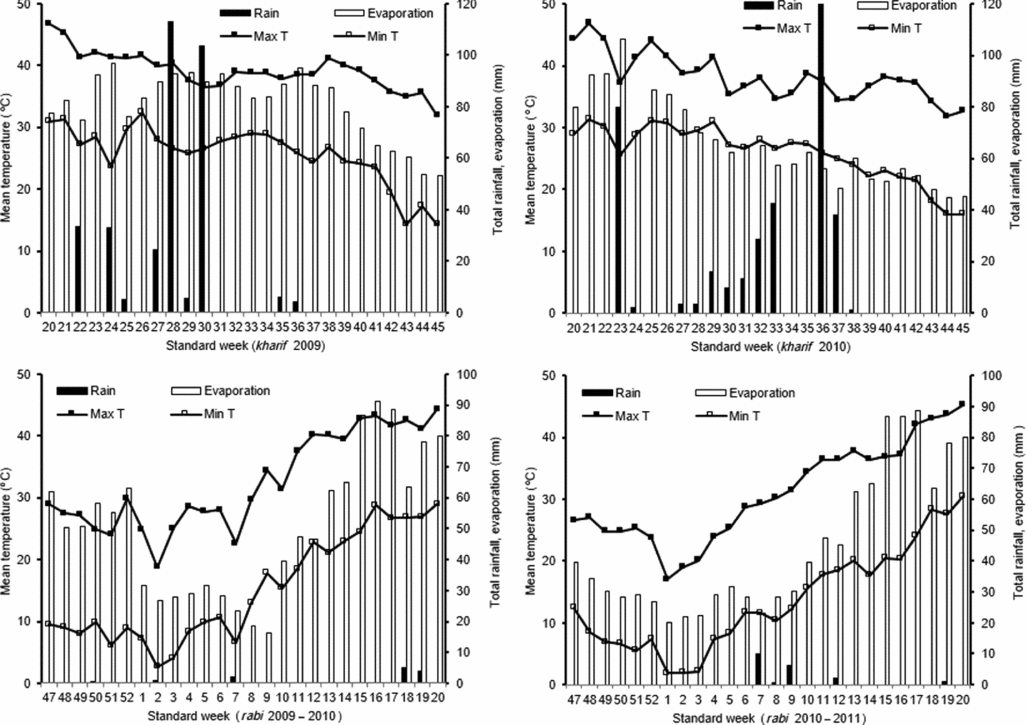
This study was conducted over a two-year period (2009–2010 to 2010–2011) at CAZRI, Regional Research Station, Bikaner, India, FPARP's site Geegasar (27º9’N; 73º4’E; alt. 238.3 metres above sea level (masl)) in north-western Rajasthan, India. The climate of experimental site is hot arid with an average annual precipitation of 287 mm and an average air temperature of 25.1 ºC. More than 85% of the total annual rainfall is received during the south-west monsoon season (July to September). The weather data for the crop growing seasons during the two-year experiment are presented in Figure 1. The soil was Torripssamentes typic with the following key properties for the 0- to 20-cm layer: pH (soil/H2O, 1:2.5): 8.4, organic carbon: 1.1 g kg −1 (the Walkley–Black method), available Phosphorus: 4.7 mg kg −1 (Olsen) and available potassium: 100.5 mg kg −1 (1 N NH4 acetate), available sulfur: 3.3 mg kg −1; texture was loamy sand, with sand (2000–50 μm), silt (50–2 μm) and clay (<2 μm) content: 854, 51 and 95 g kg−1 respectively.

Figure 1. Weekly rainfall, evaporation and temperatures over the two-year study period at Bikaner, India.
Treatments and experimental design
There were two factors in the experiment. The first factor was cropping systems (CS). The five cropping systems tested used six crops: GN (Arachis hypogaea L.), mung bean (Vigna radiata (L.) Wilczec) (hereafter MB), cluster bean (Cyamopsis tetragonoloba (L.) Taub.) (hereafter CB), wheat (Triticum aestivum L.), isabgol (Plantago ovata Forsk.) (hereafter IG) and chickpea (Cicer arietinum L.) (hereafter CP). The rotations followed were: GN–W, GN–IG, GN–CP, CB–W and MB–W. The second factor was nutrient application rate (NAR) with six treatments: 0, 25, 50, 75, 100% of recommended N and P (NP) dose and 100% of NP + S for each crop grown in rotation (hereafter 0, 25, 50, 75, 100% NP and 100% NP + S respectively). The experimental design was a split-plot with three replications. Cropping systems was assigned to main plot and nutrient application rates to sub plot.
Size of main plot was 100.0 × 9.0 m whereas that of sub-plot was 15.0 × 9.0 m with 2-m gap in-between. Each sub-plot was bordered with an earth dike of 30 cm in height. Overall, six sub-plots were randomly laid out in each main plot, which resulted into a total of 90 sub-plots for the whole experiment. Main plots and sub-plots were randomly assigned during the first year of the study. Thereafter, individual sub-plot with particular CS × NAR combinations was assigned with the same experimental unit during successive year.
Crop management practices and yield measurements
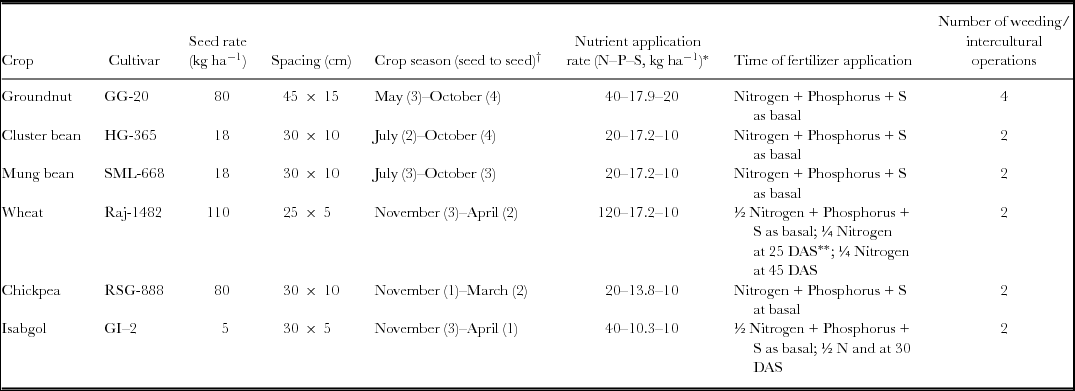
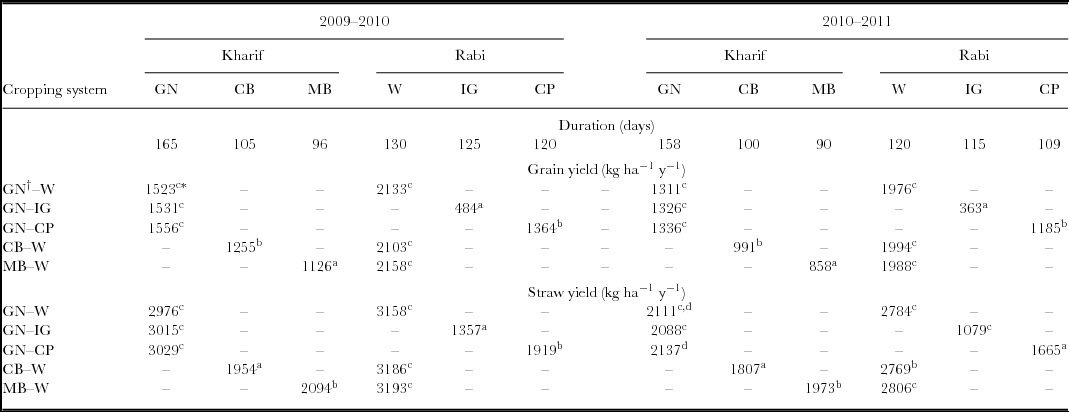
Crop cultivars, planting time, seeding rates, spacing and fertilizer application rates are shown in Table 1. The land was prepared by a tractor-drawn disc harrow. Urea and di-ammonium phosphate fertilizers were used to supply nitrogen and phosphorus respectively. Irrigation was applied via sprinkler method. The water was applied at the rate of 500 m3 ha−1 per irrigation. Application of water is measured with water meter. Crop yields of grain (in case of groundnut pod) and straw were determined at the physiological maturity stage from each sub-plot. Grains/pods were separated manually after harvesting. Sub-samples of main yield (grain/pod) and by-products (straw) were oven-dried to a constant weight at 70 °C and expressed as kg ha−1 (Table 2).
Table 1. Management practice for individual crops grown in field experiment.

†Figure in parenthesis indicate week of the month.
*Nitrogen and phosphorus were applied as urea and di-ammonium phosphate respectively. The fertilizers were applied as per treatment.
**DAS: days after sowing.
Table 2. Duration and yields of crops in different cropping systems during two cropping years at Bikaner, India.

†In each cropping system the first crop is grown in kharif season and the second crop is grown in rabi season.
*Values are mean yield averaged across nutrient application rate; in case of groundnut, the pod yield is mentioned instead of grain yield. Mean values within each cropping season in particular year followed by different superscript alphabets are significantly different at p ≤ 0.05 according to least significant difference (LSD).
Determination of productivity and profitability
Total biomass yields (BY) were measured by totalling the grain/(pod in case of groundnut) and straw yields (SY) of the individual crops. Yields (grain yield (GY) and biomass yield (BY)) of each cropping system were measured by totalling yields of kharif and rabi seasons crops of rotation in the year:
where GY and BY are in kg ha−1 and subscripts ‘1’ and ‘2’ represent the kharif and rabi seasons crops respectively.
Costs of cultivation (CC) and returns of crops were calculated on the basis of prevailing market prices for inputs and outputs. Net returns were calculated by subtracting production costs from the gross value of the produce (main and by-products) for each of the crops:
where SY is the straw yield (kg ha−1), Pg is the price of grain (in Rs. kg −1), Ps is the price of straw (in Rs. kg −1) and CC is also in Rs ha−1. Net returns on the rotation basis were calculated as follows:
where subscripts ‘1’ and ‘2’ represent the kharif and rabi seasons crops respectively.
Return on investment (RI) for each crop was calculated as follows:
where RI is expressed in percentage, NR in Rs. ha−1 and CC is expressed in Rs. ha−1. We also evaluated economic performance of the cropping systems for a range of product prices (representing two standard deviations lower to two standard deviations higher than their respective mean values) to test the sensitivity of net returns to changes in selected price conditions according to the procedure followed by Zentner et al. (Reference Zentner, Campbell, Selles, Jefferson, Lemke, McConkey, Femandez, Hamel, Gan and Thomas2006).
Determination of water use efficiency
Soil water content was measured gravimetrically down to 1.25-m depth. Soil samples were taken with a tube auger. Evapotranspiration (ET) values were used to compute the water use. ET was estimated using a standard water balance equation:
where, P = precipitation (mm), I = amount of irrigation (mm), U = upward flux (mm), R = surface runoff (mm), D = water lost by deep percolation (mm), ∆W = change in soil water storage between planting and harvesting of the crop.
It was assumed that there was negligible upward flux beyond the measured depth. This is because the level of the water table near the experimental field was never closer than 3.0 m. Surface runoff (R) was assumed to be zero as the soil at the experimental site was loam sandy, had a good infiltration rate and each sub-plot was protected by a 35-cm bund. Deep percolation (D) was assumed to be negligible since the water storage capacity of soil at the experimental site was high. Therefore, U, R and D were taken as zero. Thus, Eq. (6) reduces to the following form for calculating ET:
The value of ET was considered to be equivalent to the volume of water used (WU) by the crops.
Water use efficiency was calculated for both individual crops and rotation system as a whole. For individual crop, WUE was determined by dividing yields (GY, BY) and returns by ET as follows:
where Y is the yield (GY or BY in kg ha−1) and ET is the water use (mm) of crop. The WUE on the rotation system basis was total yield (GY or BY) or total return for a rotation cycle of the system divided by the sum of the ET of each crop (Peterson et al., Reference Peterson, Schlegel, Tanaka and Jones1996):
where subscripts ‘1’ and ‘2’ represent the kharif and rabi crops respectively.
Data analysis
All the measured parameters under the various treatments were tested for significant differences using analysis of variance (ANOVA) for a split-plot in Randomized Complete Block Design (RCBD), where significant separation of treatment means was achieved by the procedure of Fisher's least significant difference (F-LSD); p = 0.05 was used as a critical limit for distinguishing the degree of variance between means.
RESULTS
Climatic condition
Annual precipitation totalled 333.8 mm and 412.5 mm in the 2009–2010 and 2010–2011 cropping years, compared with historical average of 287 mm (1901–1998). However, the rainfall pattern showed monthly variability between the two growing years (Figure 1). In 2009–2010 about 95% of seasonal rain occurred between May and July. In 2010–2011, about 88% of rain occurred between June and September. In July, rain was above the long-term average in 2009–2010, but it was below the long-term average in 2010–2011.
Productivity
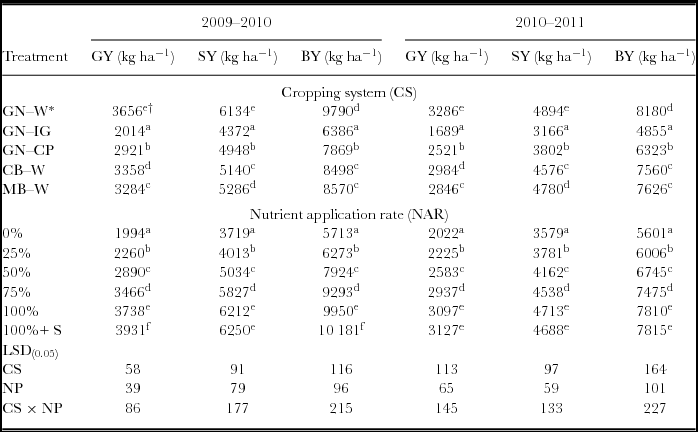
The yields of crops were higher in 2009–2010 than 2010–2011. The GY of crops varied from 363 kg ha−1 to 2158 kg ha−1. The SY varied from 1079 kg ha−1 to 3193 kg ha−1 (Table 2). Among kharif season crops, groundnut gave higher yields (both GY and SY) compared with cluster bean and mung bean during both years. In the rabi season, wheat had the highest yields followed by chickpea and isabgol (Table 2). Cropping systems, nutrient application rate and their interaction (CS × NAR) had significant effects (p ≤ 0.05) on yields during both years (Table 3). The GY was significantly different (p ≤ 0.05) between the cropping systems. Averaged across NAR treatments and years, mean annual GY were the highest for GN–W (3471 kg ha−1) followed by CB–W (91% of GN–W), MB–W (88% of GN–W), GN–CP (78% of GN–W) and GN–IG (53% of GN–W). The GY increased linearly with an increase in NAR. Averaged across the years and cropping systems, application of 25, 50, 75, 100% NP and 100% NP + S gave 12, 36, 59, 70 and 76% higher GY compared with no application of nutrients. The CS × NAR interaction was significant for GY in both years (Table 3). The GN–W system with 100% NP + S and 100% NP had higher GY than other systems. The SY of cropping systems varied from 3166 kg ha−1 to 6134 kg ha−1. The GN–W system had significantly higher (p ≤ 0.05) SY than other cropping systems. The mean annual SY, averaged across all NAR treatments and years, was the highest for GN–W (5514 kg ha−1), which yielded 9, 12, 21 and 32% more SY compared with MB–W, CB–W, GN–CP and GN–IG systems respectively (Table 3). Averaged across cropping systems and years, application of 25, 50, 75, 100% NP produced 7, 26, 42 and 50% higher SY than 0% NP. The response to NAR was higher in 2009–2010 compared with 2010–2011. Averaged across the cropping systems, the economic yields of the cropping systems with application of 25, 50, 75, 100% NP and 100% NP + S were 2, 11, 15, 17 and 20% lower in 2010–2011 than in 2009–2010.
Table 3. Main effects of cropping systems (CS) and nutrient application rates (NAR) on grain yield (GY), straw yield (SY) and biomass yield (BY) during two cropping years at Bikaner, India.

†Mean values within cropping systems and nutrient application rates followed by different superscript alphabets in each column are significantly different at p ≤ 0.05 according to least significant difference (LSD).
*GN–W: groundnut–wheat; GN–IG: groundnut–isabgol; GN–CP: groundnut–chickpea; CB–W: cluster bean–wheat; MB–W: mung bean–wheat.
The BY was significantly different (p ≤ 0.05) between CS and NAR for both years (Table 3). The mean annual BY ranged between 4855 kg ha−1 y−1 and 9790 kg ha−1 y−1. The GN–W rotation had the highest BY, and this system yielded 888, 957, 1890 and 3356 kg ha−1 y−1 higher BY than MB–W, CB–W, GN–CP and GN–IG systems respectively. The CB–W and MB–W systems recorded higher BY compared with the GN–IG and GN–CP systems in both years. The BY increased linearly with an increase in NP rates. The interaction effect of CS and NAR was significant (p ≤ 0.05) for BY (Table 3). The GN–W system had higher BY compared with other systems at 75, 100% NP and 100% NP + S either year; differences in BY between GN–W and other systems were greater at higher NAR. The differences in BY between CB–W and MB–W at different -NAR were non-significant in both years.
Profitability
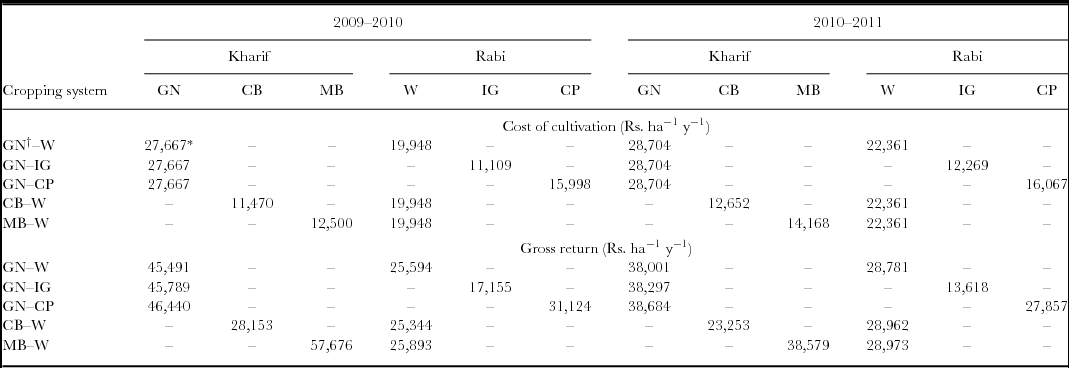
The CC and NR varied substantially between tested crops in the present study. In the kharif season, mean annual CC was higher for groundnut (Rs. 28,186 ha−1) than mung bean (Rs. 13,334 ha−1) and cluster bean (Rs. 12,061 ha−1). In the rabi season, mean annual CC was highest for wheat (Rs. 21,155 ha−1) followed by chickpea (Rs. 15,699 ha–1) and isabgol (Rs. 11,689 ha−1) (Table 4). The mean annual NR (mean gross return (GR) – mean CC) was highest for mung bean (Rs. 34,794 ha−1) followed by groundnut (Rs. 13,932 ha–1), chickpea (Rs. 13,792 ha−1), cluster bean (Rs. 13,642 ha−1), wheat (Rs. 6103 ha−1) and isabgol (Rs. 3698 ha−1).
Table 4. Cost of cultivation and gross returns (Rs. ha−1) of crops in different cropping systems during two cropping years at Bikaner, India.

†In each cropping system the first crop is grown in kharif season and the second crop is grown in rabi season.
*Values are mean, averaged across nutrient application rate.
Selling price of groundnut, cluster bean, mung bean, wheat, chickpea and isabgol was Rs. 24.00, 18.20, 48.90, 9.80, 20.00 and 34.10 per kg respectively during 2009–2010. The selling price of groundnut, cluster bean, mung bean, wheat, chickpea and isabgol was Rs. 24.00, 18.00, 42.00, 11.80, 20.00 and 36.00 per kg respectively during 2010–2011. The selling price of straw of groundnut, cluster bean, mung bean, wheat, chickpea and isabgol was Rs. 3.00, 2.75, 1.25, 1.50, 2.00 and 0.50 per kg respectively during 2009–2010. The selling price of straw of groundnut, cluster bean, mung bean, wheat, chickpea and isabgol was Rs. 3.10, 3.00, 1.30, 2.00, 2.50 and 0.50 per kg respectively during 2010–2011.
1 US$ = Indian Rupees (Rs.) 52.00.
The CC differed considerably between the cropping systems. The mean annual CC of the cropping systems varied from Rs. 33,216 to Rs. 49,340 ha−1. The GN–W systems incurred the highest CC, and the mean annual CC for GN–CP, GN–IG, MB–W and CB–W were 10, 19, 30 and 33% respectively that of GN–W.
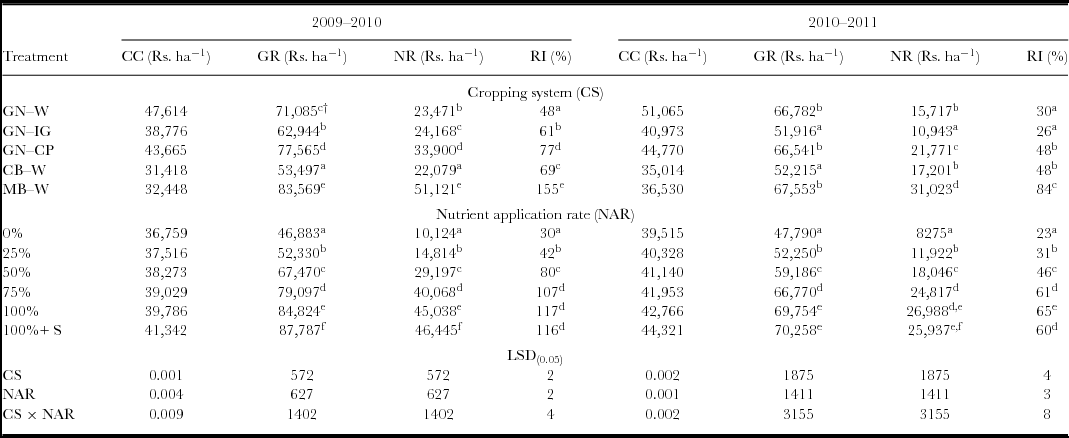
Cropping systems, NAR and their interaction (CS × NAR) had significant effects (p ≤ 0.05) on returns and RI in both years (Table 5). The returns and RI for all CS were higher in 2009–2010 than 2010–2011. The GR varied significantly (p ≤ 0.05) among the cropping systems, and averaged across NAR and years, the annual mean GR was highest for MB–W (Rs. 75,561 ha−1) and this system earned Rs. 3508, 6628, 18,131 and 22,705 ha−1 higher annual GR than GN–CP, GN–W, GN–IG and CB–W cropping systems respectively. The mean annual NR was highest for MB–W (Rs. 41,072 ha−1), and lowest for GN–IG (Rs. 17,556 ha−1). The MB–W system earned Rs. 13,237, 21,432, 21,478 and 23,517 ha−1 higher annual NR than GN–CP, CB–W, GN–W and GN–IG systems respectively. Thus, the MB–W earned 1.5 to 2.3 times higher NR than other cropping systems. The RI of cropping systems varied from 26% to 155%, being highest for MB–W and lowest for GN–IG. The MB–W recorded significantly higher (p ≤ 0.05) RI than other systems in both years. Nutrient application improved returns and RI (p ≤ 0.05) of cropping systems. The 100% + S recorded the highest NR in 2009–2010. In 2010–2011, the 100% NP had the highest NR and RI. Application of NP @ 25, 50, 75 and 100% gave 1.1, 1.5, 2.7 and 3.9 times higher NR, respectively, compared with no application of nutrients. Averaged across years and NAR, application of 25, 50, 75 and 100% NP recorded 1.4, 2.4, 3.2 and 3.4 times higher RI than the control.
Table 5. Main effects of cropping systems (CS) and nutrient application rates (NAR) on cost of cultivation (CC), gross return (GR), net return (NR) and rate on investment (RI) during two cropping years at Bikaner, India.

†Mean values within cropping systems and nutrient application rates followed by different superscript alphabets in each column are significantly different at p ≤ 0.05 according to LSD.
GN–W: groundnut–wheat; GN–IG: groundnut–isabgol; GN–CP: groundnut–chickpea; CB–W: cluster bean–wheat; MB–W: mung bean–wheat.
The CS × NAR interaction was significant (p ≤ 0.05) for returns and RI in both years (Table 5). MB–W had higher GR compared with other systems at higher NP rates. The GN–W had lower GR compared with GN–CP at lower rate of NP, but at higher levels of NP, the GN–W had higher (p ≤ 0.05) GR compared with GN–CP. The GN–W had lower NR compared with CB–W and GN–IG at lower NP rates, but at 100% NP rate GN–W recorded higher NR compared with the CB–W and GN–IG systems. The MB–W system recorded higher RI compared with other cropping systems at all NAR, and the differences increased at higher NAR.
Water use and water use efficiencies
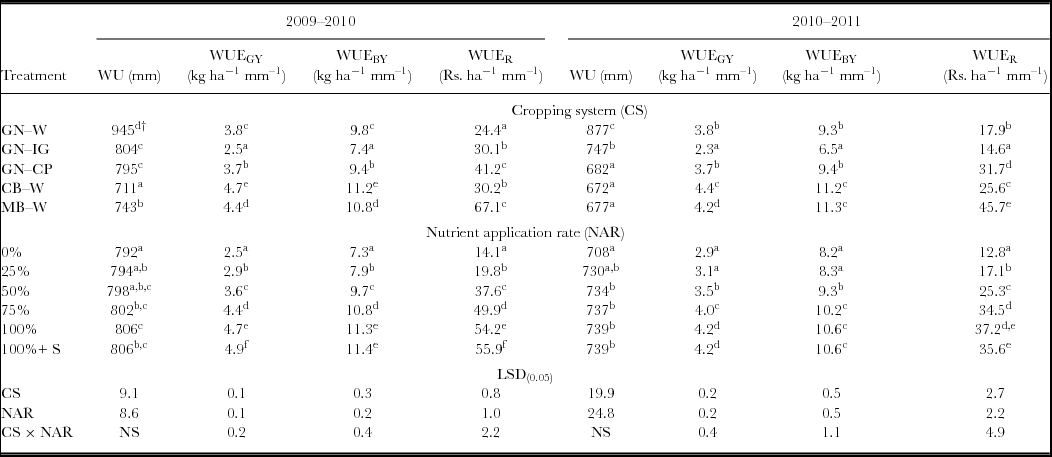
The WU and WUE values were different between CS and NAR (Table 6). The WU of cropping systems varied from 672 to 945 mm y−1. The GN–W had the highest WU (p ≤ 0.05), and CB–W recorded the lowest WU in both years. The CB–W, MB–W, GN–CP and GN–IG systems used 76, 78, 81 and 86% of WU used by GN–W. In general, groundnut-based cropping systems (GN–W, GN–IG and GN–CP) had higher WU compared with other cropping systems (MB–W and CB–W). Application of nutrients increased WU. The differences in WU between 0% and 50% NP were non-significant.
Table 6. Main effects of cropping systems (CS) and nutrient application rates (NAR) on water use (WU), water use efficiency (WUE) in terms of grain yield (WUEGY), biomass yield (WUEBY) and net return (WUER) during two cropping years at Bikaner, India.

†Mean values within cropping systems and nutrient application rates followed by different superscript alphabets in each column are significantly different at p ≤ 0.05 according to LSD.
GN–W: groundnut–wheat; GN–IG: groundnut–isabgol; GN–CP: groundnut–chickpea; CB–W: cluster bean–wheat; MB–W: mung bean–wheat.
Water use efficiency values were higher in 2009–2010 compared with 2010–2011 (Table 6). The WUEGY of cropping systems varied from 2.3 to 4.7 kg ha−1 mm−1. Averaged across NAR and years, the CB–W system had the highest WUEGY (4.6 kg ha−1 mm−1), and GN–IG had the lowest WUEGY (2.4 kg ha−1 mm−1). WUEBY varied from 6.5 to 11.3 kg ha−1 mm−1. The CB–W and MB–W systems had 1.2 times higher WUEBY compared with the GN–W system. The MB–W and CB–W systems had higher (p ≤ 0.05) WUEBY compared with other systems in both years (Table 4). The MB–W and CB–W systems were more water use efficient systems in term of yields (WUEGY and WUEBY) compared with the GN–W system. The MB–W had higher (p ≤ 0.05) WUER compared with other systems in both years. Averaged across NAR and years, MB–W recorded 1.5, 2.0, 2.5 and 2.7 times higher WUER compared with GN–CP, CB–W, GN–IG and GN–W respectively.
Nutrient application showed significant improvement (p ≤ 0.05) in WUEs in both years. In 2009–2010, WUEs (WUEGY, WUEABY and WUER) increased with an increase in NAR and 100% NP + S had higher WUEs compared with all other NAR (Table 6). Averaged across CS and years, the application of 100% NP recorded 66% and 41% higher WUEG and WUEBY, respectively, than 0% NP. The effect of NAR was more pronounced on WUER than effects on WUEGY and WUEBY; and application of 100% NAR recorded 3.4, 2.5 and 1.5 times higher WUER compared with 0, 25 and 50% NAR.
The CS × NAR interaction was detected significant for WUEs (Table 6). The CB–W system had higher WUEs compared with other systems at all NAR tested. At 0% NAR, the differences in WUEGY between MB–W, GN–W and GN–CP were non-significant. The GN–W had lower WUEGY and WUEBY compared with GN–CP at 0, 25 and 50% NAR, however at higher NAR (75, 100, 100% NP + S) the GN–W system recorded significantly higher WUEGY and WUEBY compared with GN–IG in both years. The GN–IG system had the lowest WUEGY compared with other cropping systems at all NAR.
DISCUSSION
An appropriate cropping system is critical to maintaining/enhancing agronomic sustainability (Joshi et al., Reference Joshi, Dayal, Saxena, Kumawat, Singh, Bhati, Burman, Rao, Regar, Tanwar, Singh, Singh, Kar, Garg, Singh and Kathju2009). Numerous studies have demonstrated that diversification of cropping systems improves productivity and profitability (Gangwar et al. Reference Gangwar, Katyal and Patel1999; Singh et al., Reference Singh, Gill, Nag and Singh2008b); but the choices to be made require integrated assessment of various cropping systems (Biswas et al., Reference Biswas, Ghosh, Dasgupta, Trivedi, Timsina and Doberman2006; Gangwar and Prasad, Reference Gangwar and Prasad2005). In our study area, where GN–W is a common cropping sequence, the incorporation of alternative crops, such as mung bean, cluster bean, isabgol and chickpea, into the rotation was studied. Mung bean, cluster bean and chickpea were chosen for their lower water requirement, and isabgol for its potential in the medicinal market. Relative performances of five cropping systems were assessed in terms of productivity, profitability and WUEs.
In this study, yields of crops were higher in 2009–2010 compared with 2010–2011 (Table 2). Year-to-year variability in crop yields is mainly influenced by environmental factors, pest pressures and management (Grover et al., Reference Grover, Karsten and Roth2009). Higher yield of crops in 2009–2010 than in 2010–2011 observed in the present study might have been due to longer crop duration in 2009–2010 compared with that in 2010–2011 (Table 2). Furthermore, lower yield of kharif season crops in 2010–2011 could possibly be attributed to higher pest and disease incidences due to higher relative humidity during post-flowering stage (Figure 1) in 2010–2011. Rabi season crops experienced heat stress during the later stage during 2010–2011 (Figure 1), which probably reduced yields of crop in the rabi season of 2010–2011 than in 2009–2010. Decrease in yields of crops, including wheat and chickpea, due to heat stress has been reported in other studies (Sharma et al., Reference Sharma, Pannu, Behl and Singh2005; Summerfield et al., Reference Summerfield, Hadley, Roberts, Minchin and Rawsthane1984). Temporal variability of yield of crops measured in terms of coefficient of variation (CV) ranged from a low of 5% for wheat to a high of 25% for mung bean. Among the studied crops, yield reduction in 2010–2011 compared with 2009–2010 was highest for mung bean among the kharif season crops, and for isabgol among the rabi season crops. These results indicate relatively higher risk associated with the cultivation of mung bean and isabgol compared with other crops. Producers who are generally risk averse will typically avoid crops that have higher production variability. The high risk associated with mung bean and isabgol is a possible explanation for avoiding their cultivation by producers in the study region.
In terms of yields (both GY and BY), GN–W was the most productive system in the present study (Table 3). Higher BY of GN–W is due to higher BY of both groundnut and wheat than other crops in respective seasons (Table 2). Higher BY of groundnut and wheat might be explained by longer duration coupled with higher radiation use efficiency (RUE) compared with other crops in respective seasons. Higher BY of systems involving wheat (GN–W, MB–W and CB–W) compared with the systems that involve chickpea and isabgol (GN–IG and GN–CP) observed in the present study might be explained by the higher BY of wheat relative to chickpea and isabgol. In the present study, GN–W yielded the highest GY. This could possibly be attributed to higher BY and HI of groundnut and wheat compared with other crops in respective seasons. Better BY and HI for wheat relative to chickpea and isabgol is a possible explanation for higher GY of cropping systems involving wheat (GN–W, CB–W and MB–W) compared with the systems that not included wheat (GN–CP and GN–IG). Our finding that GN–W gave the highest yields is consistent with the studies of Ghosh et al. (Reference Ghosh, Dayal, Mandal, Wanjari and Hati2003) and Jat et al. (Reference Jat, Meena, Mann, Chand, Chander and Sharma2011). Ghosh et al. (Reference Ghosh, Dayal, Mandal, Wanjari and Hati2003) found that GN–W gave 0.4 to 0.8 t ha−1 higher GY than the GN–GN, GN–CP, GN–M (mustard) and GN–SF (sunflower) systems in Gujarat, India. Jat et al. (Reference Jat, Meena, Mann, Chand, Chander and Sharma2011) showed that GN–W produced 2.4, 2.6 and 3.0 times higher GY than the PM (pearl millet)–CP, GN–M and S (sorghum)–CP systems, respectively, in Rajasthan, India.
Mixed crop–livestock systems are the dominant forms of agricultural production in many regions of the world. Crop residues constitute 40–60% of animals’ total dry matter (DM) intake in Asia and Africa (Rao and Hall, Reference Rao and Hall2003). Therefore, yield and quality of crop residues are important criteria used to assess the performance of cropping systems. Groundnut straw contains 94% DM, and 9% crude protein (CP). The cluster bean straw contains 93% DM, and 7% CP (Gupta et al., Reference Gupta, Roy, Tiwari, Dhuria and Garg2012). Mung bean straw contains 88% DM and 10% CP (Khatik et al., Reference Khatik, Vaishnava and Gupta2007), and is generally fed after mixing with straw of other palatable crops. Wheat straw is the most common source of roughage for cattle, and it contains 90% DM and 3% CP (Ranjhan, Reference Ranjhan1991). Chickpea straw contains 90% DM and 10.5% protein (Ranjhan, Reference Ranjhan1991), and is a common feed for camel, sheep and goat. Considering the feeding value of straw (excluding SY of isabgol as it is not used as fodder), GN–W yielded the greatest quantity of fodder followed by MB–W, CB–W, GN–CP and GN–IG. Considering the quality of fodder in terms of CP (calculated by multiplying CP content of straw with SY of respective crops), mean annual CP yields were highest for GN–CP, intermediate for GN–W and MB–W, and lower for CB–W and GN–IG . Therefore, GN–W, GN–CP, MB–W and CB–W were better systems for livestock feeding considering both DM and CP yields. GN–IG was the least efficient system with respect to dry matter and protein yields for feeding livestock.
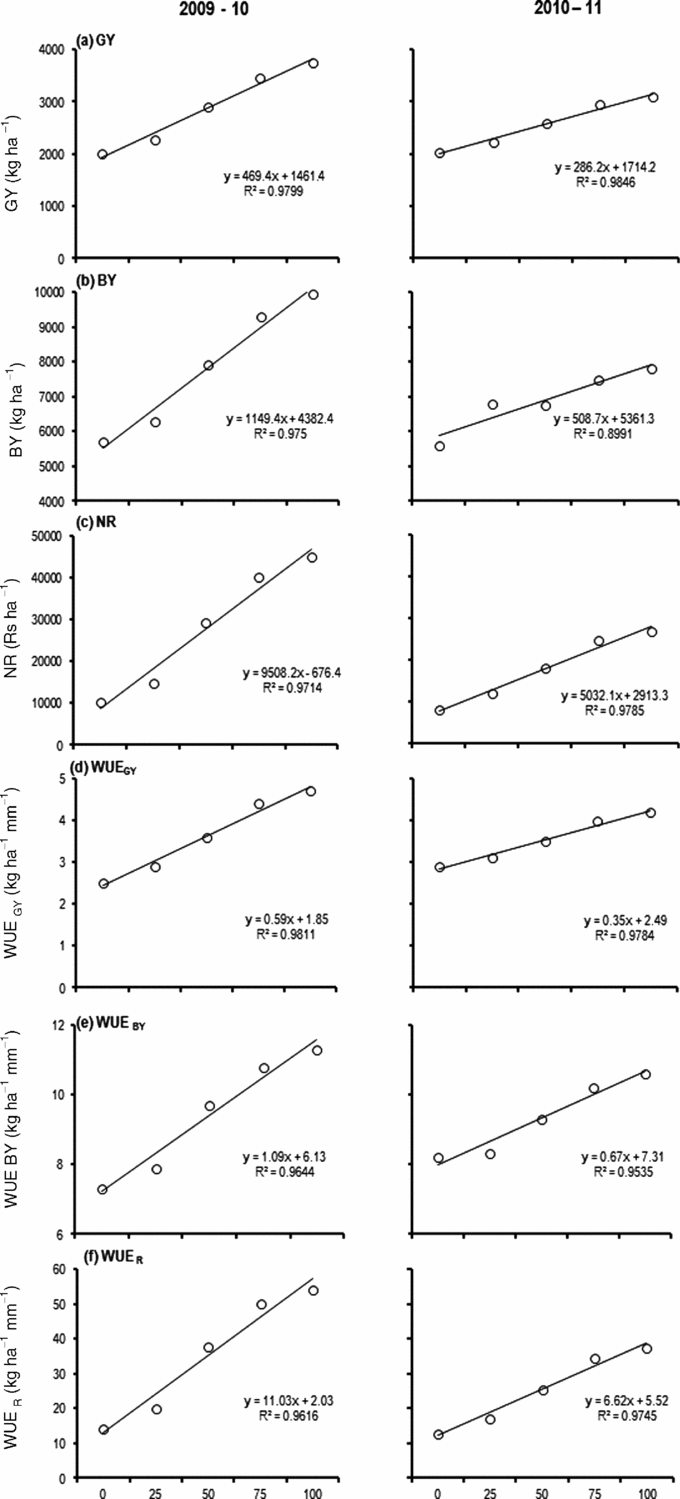
Our results demonstrated that application of nutrients increased yields of cropping systems (Table 3, Figure 2). This could possibly be attributed to increased availability of nutrients to crops due to application of fertilizers. Our findings are in agreement with other studies where application of 100% NP increased the productivity of pearl millet–cumin, pearl millet–Indian mustard and fallow–wheat (Yadav and Poonia, Reference Yadav and Poonia1996), CB–M and CB–IG (Saxena et al., Reference Saxena, Singh, Singh and Patidar2003) cropping systems in Rajasthan, India. Our study showed that S-application with 100% NP gave higher yields than 100% NP. Dayanand and Meena (Reference Dayanand and Meena2002), Sharma and Singh (Reference Sharma and Singh2005) and Singh et al. (Reference Singh, Sharma and Man2005) have demonstrated that S-application increased crops (cluster bean, wheat and groundnut) yields in the arid regions of Rajasthan. Furthermore, yield and return responses to fertilizer application was lower in 2010–2011 compared with 2009–2010. The lower responses in 2010–2011 might be attributed to unfavourable weather conditions in this year compared with 2009–2010. In addition, inter-annual variability of responses to nutrient application increased with an increase in NAR. This indicates risk associated with use of high fertilizer rates, and explains reason for avoiding use of higher rates of fertilizers by producers. Decision-making in a risky or uncertain environment usually requires making a trade-off between increases in net returns and increases in income variability (Zentner and Campbell, Reference Zentner and Campbell1988). Often producers may increase their expected net earnings by choosing higher fertilizer application rates, but only at the expense of having accepted higher income variability or financial risk. The extent of this trade-off depends on the risk preference held by individual producers. Producers who are risk averse will typically avoid high fertilizer rates that provide not only higher net returns but also higher income variability.

Figure 2. Response functions of (a) grain yields, (b) biomass yield, (c) net returns, (d) WUE in terms of grain yield, (e) WUE in terms of biomass yield and (f) WUE in terms of return of cropping systems to NAR at Bikaner, India.
In the present study, differences in profitability of cropping systems reflected variations in differences between GR (depending on yield and selling prices) and CC (depending on cultural and input requirements) among component crops of the cropping systems. Groundnut incurred the greatest CC among the kharif season crops due to higher labour, irrigation, seed and plant protection chemical requirements relative to cluster bean and mung bean (Table 4). Wheat had the highest CC among the rabi season crops, mainly due to higher labour and irrigation costs compared with chickpea and isabgol. Costs of cultivation for the systems that included GN (GN–W, GN–CP and GN–IG) tended to be higher than for systems that included cluster bean (CB–W) and mung bean (MB–W) (Table 5) due to higher CC of groundnut (Table 4). Similarly, CC for groundnut-based systems that included wheat (GN–W) is higher than the systems that included chickpea (GN–CP) and isabgol (GN–IG) due to higher CC of wheat. This indicates that substitution of groundnut by cluster bean and mung bean, and that of wheat by chickpea and isabgol, requires fewer resource expenditures (labour, seed and pesticides).
In the present study, MB–W was the most profitable system, and it earned the highest NR and RI (Table 5). The Highest profit for MB–W cropping systems is attributed to higher selling prices and lower CC of mung bean than groundnut and cluster bean coupled with better yield of wheat than chickpea and isabgol. In spite of 12% less GY, MB–W earned two-fold higher NR than GN–W due to ~30% less CC and ~60% higher selling prices of mung bean compared with groundnut. These results are in contrast to the study by Jat et al. (Reference Jat, Meena, Mann, Chand, Chander and Sharma2011), who showed that GN–W was profitable than MB–W. This difference from earlier report is mainly due to higher selling price of mung bean coupled with higher CC of groundnut than mung bean in the present study. In spite of ~33% less CC for CB–W than GN–W, both these systems earned almost similar NR due to ~10% less yield and 25% less selling price for cluster bean than for groundnut. In spite of better GY, GN–W was less profitable than GN–CP, and this is attributed to lower CC (~10% less than wheat) and higher selling price (~45% higher than wheat) of chickpea than wheat. Notwithstanding better selling price and lower CC of isabgol, its extremely low GY compared with wheat (~47% less than wheat) is responsible for lower profitability of GN–IG than GN–W. We found that nutrient applications increased profitability of the cropping systems (Table 5), which might be attributed to more increase in returns (due to higher yields) relative to cost incurred in nutrient applications. Increase in returns of crops due to fertilizer applications in arid region of India have been reported in other studies (Rathore et al., Reference Rathore, Singh, Soni, Yadava and Beniwal2007; Singh et al., Reference Singh, Singh and Patidar2008a).
Changes in expected product prices influenced level of net earnings of the cropping systems (Table 7). The net returns of groundnut -based cropping systems were more sensitive to change in price of groundnut than change in prices of the rabi season crops (wheat, isabgol and chickpea). The change in prices for groundnut had the highest effects on net earnings of GN–IG followed by the GN–W and GN–CP cropping systems, directly reflecting differences in yields of the rabi season crops. The GN–CP remained the most profitable among groundnut-based cropping systems at both lower prices and higher prices of groundnut. The MB–W system remained the most profitable cropping system at most of the expected price change scenarios, and its net earnings were more sensitive to change in price for mung bean than for change of prices for wheat. It was profitable to grow groundnut than mung bean when the ratio of groundnut price to mung bean price exceeded 0.8. Producers will find the GN–W rotation economically attractive than MB–W when ratio of groundnut price to mung bean price rose up to 0.8, possibly because of higher groundnut or lower mung bean prices. It was profitable to substitute cluster bean for mung bean when the cluster bean/mung bean price ratio exceeded 0.8; and at this price ratio CB–W was the most profitable cropping system. The price ratios of cluster bean to mung bean ranged from 0.4 to 1.1 for 2001–2010, thus indicating that growers will find cluster bean more profitable under higher cluster bean or lower mung bean prices. It was profitable to grow wheat than chickpea when the ratio of wheat price to chickpea price exceeded 0.7. It was profitable to produce isabgol than wheat and chickpea when the isabgol/wheat and isabgol/chickpea price ratios were greater than 5.4 and 2.9 respectively. The recent historical (2001–2010) isabgol/wheat and isabgol/chickpea price ratios have ranged from 3.1 to 3.9 and 1.5 to 2.0 respectively, thus indicating that area producers will not likely find isabgol rotation economically attractive in foreseeable future, except possibly by those with a specialized need for isabgol (e.g. pharmaceutical industry).
Table 7. Effects of price change on mean net returns of cropping systems at Bikaner, India.

*High prices reflect two standard deviations above the respective base price of crops, and low prices reflect two standard deviations below the respective base prices of crops.
**GN: groundnut; W: wheat; IG: isabgol; CP: chickpea; CB: cluster bean; MB: mung bean.
We explored the profitability of cropping systems under irrigation water pricing. The ‘in-kind contract’ is a common water pricing system, and 20 to 40% of crop output has been charged as water price in the study region. At water price @ 20% of GR of crops, all cropping systems remained profitable (NR ranged from Rs. 6128 to 25,820 ha−1); and at this price of water, reduction in NR compared with free water was higher (65–70%) for GN–W and GN–IG, intermediate (50–55%) for GN–CP and CB–W and lowest (37%) for MB–W. At water price @ 30% of GR of crops, the MB–W system was non-profitable. All the systems lost returns and were non-profitable when water is charged @ 40% of GR of crops. Our analysis indicated that area producers would find the MB–W, CB–W and GN–CP rotations economically attractive than GN–W and GN–IG under water pricing scenarios.
Differences observed in WU of cropping systems reflected differences in WU of component crops of the cropping systems. Higher WU for groundnut observed in the present study might be attributed to longer duration and early planting time during the period of higher evaporative demand than other crops in the kharif season. Other studies demonstrated that WU for groundnut was higher (716–796 mm; Patel et al., Reference Patel, Patel and Patel2008) than cluster bean (425–654 mm; Rao and Singh, Reference Rao, Singh, Faroda and Singh1998), and mung bean (293–404 mm; Rao, Reference Rao, Kar, Garg, Singh and Kathju2009). Higher WU of wheat compared with isabgol and chickpea is possibly explained by longer duration of wheat. The highest WU for GN–W observed in the present study is attributed to higher WU of groundnut and wheat compared with other crops in respective seasons. Considering WUE in yield (GY and BY) terms, the CB–W and MB–W were more water use efficient systems than the GN–W system (Table 6). The following three principal explanations likely contributed to higher WUEs in terms of yields for mung bean and cluster bean compared with groundnut in the present study: (i) The short duration of mung bean and cluster bean decreases the total ET; (ii) they develop canopy quickly than groundnut, leading to decreased share of evaporation (E) in the total ET, and hence increased share of transpiration (T) in total ET and (iii) they produced higher grain and biomass yields per day compared with groundnut. GN–IG was the least efficient system with respect to WUEs in terms of yields. Extremely low yields of isabgol might be responsible for the lowest WUEs of the GN–IG system. In contrast to yields and WUE in yield terms, the MB–W system was the most water use efficient system in economic terms (WUER; returns per unit of water used). The higher WUER of MB–W is attributed to lower WU and higher NR (due to higher selling price and lower CC) of mung bean than cluster bean and groundnut. In spite of the highest selling price for isabgol, the GN–IG was the least water use efficient system in terms of WUER due to the lowest GY of isabgol in the present study. Nutrient application improved WUE of all the cropping systems (Table 6) in the present study. Our findings are consistent with the studies of Garg et al. (Reference Garg, Kathju, Vyas and Lahiri1993), Rathore et al. (Reference Rathore, Singh, Soni, Yadava and Beniwal2007) and Singh et al. (Reference Singh, Rao and Regar2010), who found that nutrient application improved WUEs of crops in arid region. Nutrient application has been shown to increases the share of T in total ET via early canopy growth, and thus improves yield and WUE without affecting total ET to any great extent (Gregory et al., Reference Gregory, Shepherd and Cooper1984).
Our results indicate that tested cropping systems varied significantly in terms of productivity, profitability and WUEs, and support our hypothesis that diversified crop rotations have higher returns and WUEs than the GN–W system. At current price levels, the MB–W system with the highest profits and WUER, and the second highest WUEGY, WUEBY and yields (BY) seems to be the most efficient system compared with other systems for hot arid region of India.
CONCLUSIONS
The tested cropping systems varied considerably with respect to agronomic, economic and water use performances. Under the seasonal conditions and crop product prices that occurred during this experiment, the substitution of groundnut by short duration legumes, i.e. mung bean and cluster bean, resulted in higher returns and WUEs. The MB–W rotation resulted in the highest returns and WUEs due to lower cost of cultivation, better selling prices and less water use by mung bean than groundnut. Lower production cost and water use of mung bean and cluster bean compared with groundnut has an extra appeal to producers in that it entails low capital and water requirements. Producers must remain flexible in their choice of crop so as to respond appropriately to changing market conditions. It was generally more profitable to produce groundnut and cluster bean than mung bean when the groundnut/mung bean and cluster bean/mung bean price ratios exceeded 0.8. Further, it was more profitable to produce wheat than chickpea when the wheat/chickpea price ratio exceeded 0.7. Enhanced yields and profits under the application of 100% NP is a pointer to the superiority of 100% recommended dose of N and P over other rates of nutrient application. Our results suggest that substitution of groundnut-based rotation by short duration, low input (water, nutrient and labour) requiring crops, i.e. mung bean- and cluster bean-based rotations with 100% NP be adopted in this environment to get higher returns and WUE. Long-term studies may be further needed to ascertain performances of various cropping systems with regard to soil quality and returns under price fluctuations.
Acknowledgements
Bherun Singh and other staff attached to the Regional Research Station of the CAZRI assisted during the field phase of this research. The project was funded by the Ministry of Water Resources, Government of India.


