


INTRODUCTION
Agriculture both affects and is affected by climate change and no other sector is more climate sensitive than agriculture. Food production and agriculture in developing countries will be adversely affected by climate change, especially in countries that are already climate-vulnerable and that have low incomes and high incidence of hunger and poverty (FAO, 2009). The International Food Policy Research Institute (IFPRI) predicts climate change will alter the planting date in some locations, shifting the month in which a crop can be safely planted forward or back. Furthermore, in some locations crops can be grown in 2000 but not in 2050, or vice versa (Nelson et al., Reference Nelson, Rosegrant, Palazzo, Gray, Ingersoll, Robertson, Tokgoz, Zhu, Sulser, Ringler, Msangi and You2010).
The high diversity of geographical and climatic features and the development and socio-economic conditions of various regions of Pakistan suggest that the impact of climate change is not likely to be uniform across these regions (Malik et al., Reference Malik, Awan and Khan2012). The threats to food security from climate change will come from a variety of sources including faster than average glacier melt in the Himalayas, rising temperatures and changing precipitation patterns. Pakistan commands the highest ratio of irrigated cropland in the region with four-fifths of its total cropland being currently irrigated and the remainder being rain-fed. Rain-fed agricultural areas are likely to suffer even more than irrigated areas as there are few coping mechanisms for increased variability in natural precipitation (MHHDC, 2005, 2010). However, in the irrigated areas of Pakistan, the inequitable distribution of canal water supplies and inefficiency of the system require that farmers must rely on timely precipitations.
Pimental (Reference Pimentel1993) has concluded that in addition to the magnitude and pace of climate change, the stage of growth during which a crop is exposed to drought or heat is important as temperature and seasonal precipitation patterns vary from year-to-year and region-to-region, regardless of long-term trends in climate.
Chaudhari (Reference Chaudhari1994) has reported that the annual mean precipitation is considerably low in most parts of the arid and semi-arid region of Asia. Moreover, temporal variability is quite high: occasionally, as much as 90% of the annual total is recorded during just two months of the year at a few places in the region. Precipitation observations during the past 50 years in some countries in the northern parts of this region have shown an increasing trend on an annual mean basis. The precipitation in spring, summer and autumn, however, has shown slight increasing trends. In Pakistan, 7 of 10 stations have shown a tendency toward increasing precipitation during monsoon season. Due to the low technological and scientific base of agriculture in Pakistan, there is a low capacity to adapt to changes related to climate change (Malik et al., Reference Malik, Awan and Khan2012).
Water availability is a world-wide constraint to agricultural productivity (Fereres and Gonzalez-Dugo, Reference Fereres, González-Dugo, Sadras and Valderini2009). The productivity variation within a crop is due to variation in genotype, growing period, agricultural practices, meteorological and soil conditions. Length of crop growth period will depend on time of sowing and prevailing meteorological conditions (Bastidas et al., Reference Bastidas, Setiyono, Dobermann, Cassman, Elmore, Graef and Specht2008). Phenological development is the single most important attribute of crop adaptation to shifting climates. Climate change may alter the rate of phenological development and the amount and distribution of precipitation during the growing season. These changes may in turn result in mismatch between water demand by crops and water availability from precipitation. Climate change may result in changes in the temporal distribution of meteorological variables during the crop growing season. One particular concern is that crop phenological development, which is largely determined by temperature and photoperiod, may be out of phase with precipitation and hence water availability during critical periods of grain yield determination (Huda et al., Reference Huda, Sadras, Wani and Mei2011).
Many researchers (Huda et al., Reference Huda, Sadras, Wani and Mei2011; Jalota et al., Reference Jalota, Kaur, Ray, Vashisht and Bal2012; Sacks et al., Reference Sacks, Deryng and Foley2010; Tingem et al., Reference Tingem, Rivington, Bellocchi and Jeremy2008; Vom Brocke et al., Reference Vom Brocke, Trouche, Weltzien, Kondombo-Barro, Sidibe, Zougmoré and Gozé2014; Vyas et al., Reference Vyas, Nigam and Patel2013) have evaluated changes in sowing dates as an adaptation options in different parts of the world. Sultana et al. (Reference Sultana, Ali, Iqbal and Khan2009) has tested shifts in sowing date of wheat as an adaptation option in different agro-climatic zones of Pakistan using CSM-Cropsim-CERES-Wheat model under scenarios of increased temperature and atmospheric carbon dioxide concentration (CO2) along with two scenarios of water management. The results depict that there is high probability of increased yield in later sowing dates compared to earlier ones under climate change. This implies that the sowing date of wheat in arid, semi-arid, sub- humid and humid zones will shift towards cooler months with climate change. In analogous study, Nkomozepi and Chung (Reference Nkomozepi and Chung2012) have assessed maize net irrigation water requirement estimated from climate change projections for Zimbabwe. The study has assessed the trends and uncertainty of the GCM derived net irrigation water requirement predictions estimated by the Food and Agriculture CROPWAT model for Natural Agro-ecological Region II in Zimbabwe and implies that CROPWAT model can be used for predicting CWR and irrigation scheduling in future time steps. In this backdrop, this paper presents assessment of climate change scenarios and predicts the variation in climatic parameters for future time step of 30 years. It also evaluates shift in sowing dates of the two major crops as an adaptation option under the projected climate changes. For this evaluation, potential evapotranspiration (ETo) and crop water requirement is used as an indicator.
MATERIALS AND METHODS
The study area
Pakistan is highly vulnerable to climate change due to its geographic location, high dependence on agriculture and water resources, low adaptive capacity of its people and weak system of emergency preparedness (Malik et al., Reference Malik, Awan and Khan2012). The country can be classified into nine agro-climatic zones based upon an Asian Development Bank study on agricultural growth and rural poverty in Pakistan (ADB, 2005). A map of these agro-climatic zones along with associated meteorological stations is shown in Figure 1(a). The present study focused on the Cotton/Wheat Punjab zone which is ranked in the middle among all the agro-climatic zones on the basis of the climate change vulnerability index (VI) as suggested by Malik et al. (Reference Malik, Awan and Khan2012). The index is based upon three parameters of Exposure; Sensitivity and Adaptive Capacity to the changing climates. The most critical parameter in the Cotton/Wheat Punjab zone is lack of adaptive capacity. This lack of adaptive capacity is the basis of the selection of this zone for detailed analysis. This selected zone lies in the Punjab province of the country and is constituted of nine districts with an approximate area of 66,724 km2 and a population of over 20 million.
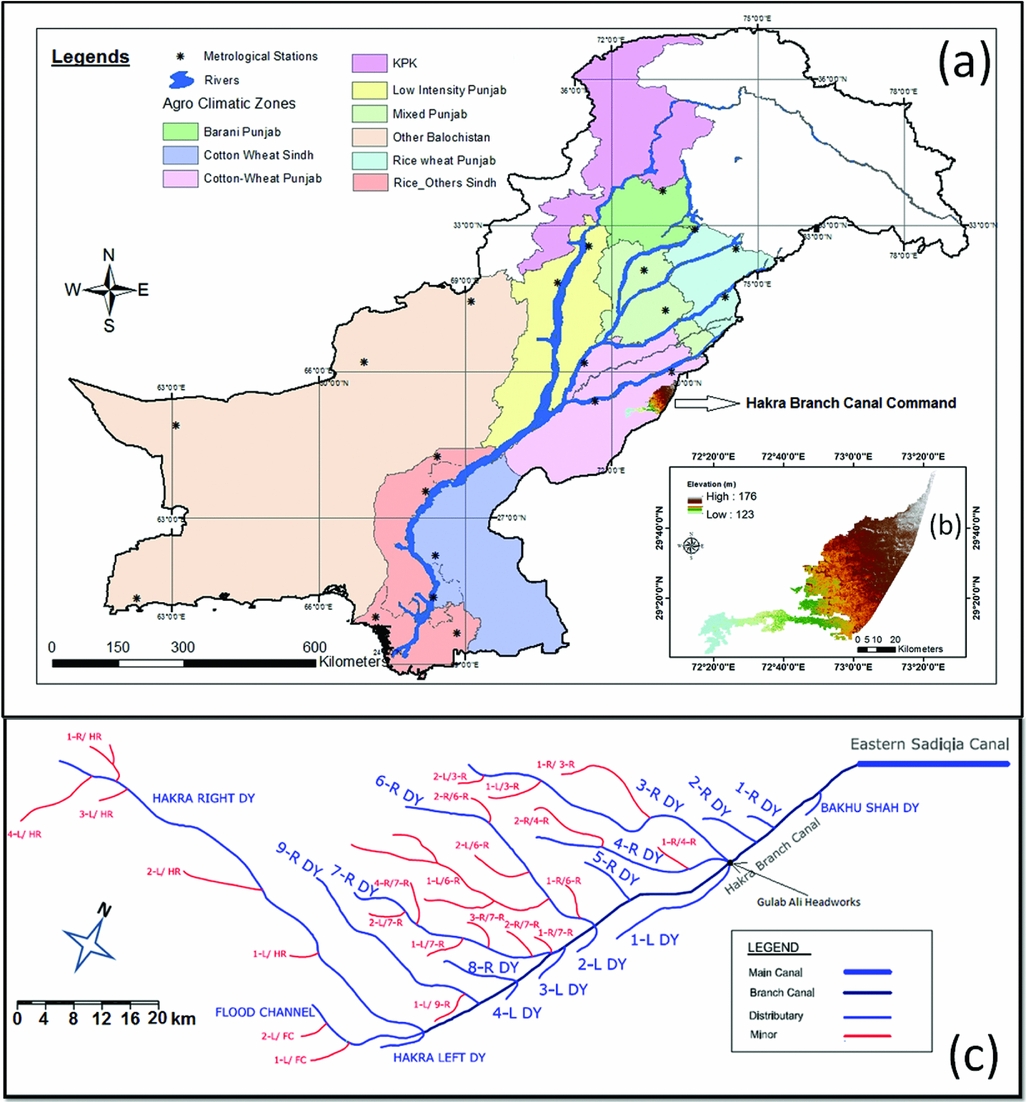
Figure 1. Location of the study area: (a) map of agro-climatic zones of Pakistan, (b) digital elevation model of HBCC and (c) Schematic of the canal system in HBCC.
Detailed analysis has been carried out for Hakra branch canal (HBC) irrigation system to simulate the shift in sowing dates as a climate change adaptation option. HBC is a perennial irrigation channel which is located in south eastern Punjab and which irrigates over 200,000 ha of agricultural land. The network of distributaries (secondary irrigation channels) and watercourses (tertiary irrigation channels) in HBC irrigation system is shown in Figure 1(c). The irrigation system is community-managed by Farmer Organizations (FOs) which are responsible for irrigation operation and management.
The study area is mainly semi-arid with an average annual rainfall ranging from 125 mm to 250 mm. The yearly variation on the cropping pattern is generally non-existent. During the Kharif (summer season), cotton is the most popular cash crop while wheat is mostly grown during the Rabi (winter season). A hot and dry climate, low rainfall and unfit groundwater require ensured and regular surface irrigation water supplies. However, shortage, inequity and unreliability of canal water supplies compel farmers to rely on timely precipitation during different phonological phases of the crops.
Climate change impact
For climate change downscaling, three GCM data sets were used as detailed in Table 1. Predictor variables (max-min temperatures, wind speeds, relative humidity and precipitation) with daily time scale were used as input to the model. The observed records were collected for the base period of 1980 to 2004 from the respective government agencies and departments. The three selected predictands (with daily time scale) were Tmax (maximum temperature); Tmin (minimum temperature); and P (precipitation).
Table 1. GCM models, source and data resolution.

The predictions were based upon outputs of three GCMs obtained from IPCC AR5 CMIP5 database as detailed in Table 1. A2 emission scenario was selected from Special Report on Emissions Scenarios (SRES) characterized by heterogeneity of world development in the 21st century. The A2 scenario does not rank the highest but lies at the higher end of the SRES emissions scenarios assuming continuously increasing population and a technologically fragmented economic development in future. The predicted changes in climate using A2 scenario are generally higher than future averages. The GCM data was downscaled to each climate station through a bias correction (BC) process.
The BC method is used to develop a statistical relationship or transfer function between the GCM outputs and historical observed values and then apply the transfer function to GCM future projections in order to eliminate the possible systematic errors in GCM outputs (Ines and Hansen, Reference Ines and Hansen2006; Piani et al., Reference Piani, Haerter and Coppola2010). One simple BC method is pattern scaling (Santer et al., Reference Santer, Wigley, Schlesinger and Mitchell1990). Various pattern scaling techniques have been used in constructing climate change scenarios (Diaz-Nieto and Wilby, Reference Diaz-Nieto and Wilby2005; Hanssen-Bauer et al., Reference Hanssen-Bauer, Forland and Haugen2003; Widmann, et al., Reference Widmann, Bretherton and Salathé2003). For the simplest pattern scaling method, a rescaling (multiplicative) factor during the baseline period was calculated to correct the bias of the mean monthly GCM precipitation. Rescaling or quantile-based mapping is another BC method (Law and Kelton, Reference Law and Kelton1982; Panofsky and Brier, Reference Panofsky and Brier1968) which has been employed in this study. Typically the procedure is used to map the cumulative distribution function (CDF) of GCM daily data in a specific month onto that of observed data. Traditionally the corrected GCM data on day i during the GCM baseline period can be calculated using equation 1:
 $$\begin{equation}
x_i^{\prime} = F_{obs}^{ - 1}({F_{sim\_B}}({x_i})),
\end{equation}$$
$$\begin{equation}
x_i^{\prime} = F_{obs}^{ - 1}({F_{sim\_B}}({x_i})),
\end{equation}$$
where F(•) and F −1(•) denote the CDF and its inverse of either the daily observations (obs) or daily GCM results (sim) of baseline (_B). In this study, an equal distance-based CDF mapping method (EDCDF) was adopted to correct the GCM daily precipitation and temperature. This method was different from the above traditional method in that the information from the CDF of the GCM was also incorporated into the BC procedure. For a given percentile, it was assumed that the difference between the GCM and observed value during the baseline period also applies to the future period. Thus, the corrected GCM data ‘x’ on day i for the future period can be calculated by equation 2.
 $$\begin{equation}
x_i^{\prime} = {x_i} + F_{obs}^{ - 1}({F_{sim\_F}}({x_i})) - F_{sim\_B}^{ - 1}({F_{sim\_F}}({x_i})),
\end{equation}$$
$$\begin{equation}
x_i^{\prime} = {x_i} + F_{obs}^{ - 1}({F_{sim\_F}}({x_i})) - F_{sim\_B}^{ - 1}({F_{sim\_F}}({x_i})),
\end{equation}$$
where B and F denote the GCM baseline and the future simulated period.
To perform a BC operation, the observed precipitation was firstly truncated using a threshold value of 0.1mm
 $\bar x$
(0.1) to obtain an ideal frequency distribution. Then the GCM daily precipitation of baseline period was fitted into an empirical frequency distribution. By finding a threshold
$\bar x$
(0.1) to obtain an ideal frequency distribution. Then the GCM daily precipitation of baseline period was fitted into an empirical frequency distribution. By finding a threshold
 $\ {\bar x_{sim}}$
this distribution was truncated so as to ensure that its frequency above the threshold would approximate the observed precipitation frequency (Ines and Hansen, Reference Ines and Hansen2006). The threshold
$\ {\bar x_{sim}}$
this distribution was truncated so as to ensure that its frequency above the threshold would approximate the observed precipitation frequency (Ines and Hansen, Reference Ines and Hansen2006). The threshold
 ${\bar x_{sim}}$
was calculated from the empirical observed and GCM cumulative precipitation distribution (equation 3):
${\bar x_{sim}}$
was calculated from the empirical observed and GCM cumulative precipitation distribution (equation 3):
 $$\begin{equation}
{\bar x_{sim}} = F_{sim\_B}^{ - 1}\left( {{F_{obs}}\left( {\tilde x} \right)} \right),
\end{equation}$$
$$\begin{equation}
{\bar x_{sim}} = F_{sim\_B}^{ - 1}\left( {{F_{obs}}\left( {\tilde x} \right)} \right),
\end{equation}$$
where
 $\tilde x$
represents the truncated observed time series at a threshold
$\tilde x$
represents the truncated observed time series at a threshold
 $\bar x = 0.1$
. The
$\bar x = 0.1$
. The
 ${\bar x_{sim}}$
was then used to truncate the GCM precipitation during the future period.
${\bar x_{sim}}$
was then used to truncate the GCM precipitation during the future period.
The BC procedure was performed on monthly basis and all evaluations were carried out in a seasonal style. Apart from the percentage difference of simulated values from observed values, R2 (coefficient of determination) was used as statistical criteria for model validation. The value for the R2 ranges from zero to one, for good model performance it should approach unity.
Crop water requirement
Crop water requirement of the Hakra canal command area was calculated using CROPWAT 8.0. CROPWAT was designed for the calculation of potential ETo and CWR from soil, climate and crop data and has been appropriately used as a tool for testing the effect of changes in sowing dates under projected climate change on CWR. The Food and Agriculture Organization Penman-Monteith (FAO-PM) method is used in the model to determine the reference ETo from climatic data (FAO, 1992).
In the water balance calculation, the intake of rain into the soil was determined on a daily basis (for baseline and projected precipitation data) and precipitation losses due to deep percolation and surface runoff were estimated according to actual soil moisture content in the root zone. Total rainfall – and not effective rainfall – was therefore used for calculation of water balance (FAO, 1998).
The CWR defined as the depth of water needed to meet the water loss through ETo (FAO, 1998), were calculated by CROPWAT as a three-stage procedure. First, the effect of climate given by the ETo; second, the effect of the crop characteristics given by the crop coefficients (Kc) values varied with the kind of crop, its phonological stages (initial- mid- and late-season stages), and prevailing weather conditions, and; third, the effect of local conditions and agricultural practices (Doria, Reference Doria2010). The Kc values used in the simulation of CROPWAT were taken from Ullah et al. (Reference Ullah, Habib and Muhammad2001) and adjusted to the actual climatic condition of the sites. CWR is calculated by multiplying crop coefficient (Kc) with potential crop ETo in mm/day. In addition, for the CWR and rainfall data, crop rooting depth, allowable depletion and yield response factor were required which were adopted from literature for the baseline period and assumed to remain same in the future simulations.
Adaptation scenarios
The long-term (1980–2004) solar radiation, maximum and minimum temperature, and precipitation at the selected site were used as baseline climatic data to the CROPWAT model. Only two major crops (i.e. wheat and cotton) were modelled. Crop water scheduling was set in the model by considering the existing sowing and harvest dates in the study area as a baseline. The model was run for each year from 2013 to 2042. The weather series for simulations in the changed climate was obtained by a downscaling exercise of climate change scenarios through the BC method. Shifts in the hydrological regimes in which crops grow are likely to change along with the changing climate. The crop water regime may be further affected by changes in seasonal precipitation, within-season pattern of precipitation and inter-annual variation of precipitation (O'Brien, Reference O'Brien and Leichenko2000).
Alterations in the current baseline sowing dates were also considered to determine whether the sowing date as an adaptation option would offset the likely impacts of climate change. Based on this purpose, for each crop the model was run for baseline sowing dates and six sowing dates (each with five days difference) to consider both early and late sowing options. For wheat crop the iterations included 01-Nov, 05-Nov, 10-Nov, 15-Nov, 20-Nov, 25-Nov and 30-Nov, and for cotton crop the iterations included 05-Apr, 10-Apr, 15-Apr, 20-Apr, 25-Apr, 30-Apr, 05-May. It was assumed that in future the baseline soil condition and canal water supplies will remain the same. The simulated results are presented as cumulative probability functions.
RESULT AND DISCUSSION
Simulated predictants’ data (averaged on monthly time scale) for the baseline period was compared with the observed data (Figure 2). The value of R2 remained greater than 0.96 in which suggest a reasonable estimate of all predictands by the model. For future predictions the Canadian GCM (CAN ESM2) was preferred due to highest value of R2 (0.99) for all three predictands.
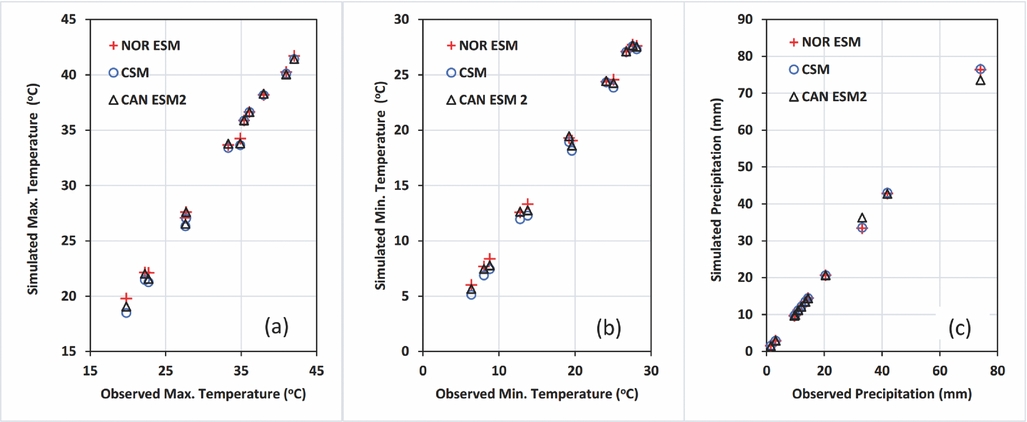
Figure 2. Scatter plots showing observed and simulated (a) Max. Temperature; (b) Min. Temperature; (c) Precipitation; of the study area using NOR ESM, CSM and CAN ESM2 general circulation models.
Temperature is an important determinant of the rate at which a plant progresses through various phenological stages towards maturity. Sultana et al. (Reference Sultana, Ali, Iqbal and Khan2009) have reported that a rise in temperature reduced the length of wheat crop life cycle under different climates of Pakistan. Hussain and Mudasser (Reference Hussain and Mudasser2007) have similarly reported that increased temperatures correspond to an increase in Growing Degree Days (GDDs) and a decrease in crop life cycle. Predictions of Tmax, Tmin and P are shown in Figure 3. The predictions are presented as variations from the baseline and arranged in a monthly and seasonal fashion for a thirty-year period from 2013 to 2042. The figure shows that a positive shift in average annual Tmin and Tmax is expected in the next thirty years with magnitudes of 22.35 % and 9.45% respectively from the baseline.

Figure 3. Prediction of climatic parameters for future time step (2013–2042).
Precipitation is likely to be reduced by 16.79% from the baseline. Both maximum and minimum temperatures show an increasing trend throughout all months as well as all seasons. More interesting results are of the precipitation variability within different seasons, as an erratic trend is shown. This variation has a direct connection with phenology as it may affect the availability of water at different crop stages. A profound decrease in precipitation is expected during October and November (by 83% and 171% respectively) which are essentially the sowing months of the Rabi crops. A small decrease is expected during April and May (18% and 6% respectively) which are the sowing months of the Kharif crops. The monsoon precipitation is likely to be decreased by approximately 3% during July and August, but this percentage accounts for a substantial decrease in total annual precipitation because of the fact that approximately 70% of the total downpours are received during the three monsoon months in the study region.
The primary source of irrigation in HBC is undoubtedly the canal water supplies. Still, the variation in the precipitation and temperature patterns necessitates the alteration in agricultural and irrigation practices in the study area. Alteration in the timing of crop sowing may be a better adaptation option. This is tested through modelling and results are presented in Figure 4.

Figure 4. Cumulative probability function plots of crop water requirement for different sowing dates under climate scenarios (a) wheat crop and (b) cotton crop.
The results in Figure 4(a) depict that there is high probability of decreased crop water requirement of the wheat crop in early sowing dates compared to later ones under climate change. The figure also reveal that the probability lines of early sowing dates are showing distinct tendency of reduced crop water requirement from the baseline sowing dates. In the selected study area, the existing time of wheat sowing is around mid-November. In order to reduce the vulnerability and variation in climatic parameters sowing of wheat crop in early November will be beneficial.
Figure 4(b), on the other hand, does not show any clear trend of reduced crop water requirement by altering the sowing dates of cotton. However, in the high probability zone (>0.4), there exists a tendency of reduced crop water requirement from the baseline sowing dates in case of late sowing dates. Although the results presented in Figure 4(b) partially support the late sowing of cotton as a beneficial adaptation option, the erratic trend of probability lines reduces any confidence in suggesting the alteration of cotton sowing dates as an option to offset the likely impacts of climate change.
IPCC (Reference Parry, Canziani, Palutikof, van der Linden and Hanson2007) has highlighted that ‘in the European Mediterranean region, increases in the frequency of extreme climate events during specific crop development stages (e.g. heat stress during flowering period, rainy days during sowing time), together with higher rainfall intensity and longer dry spells, are likely to reduce the yield of summer crops (e.g. sunflower)’. Shifting crop plantation dates as a climate change adaptation option is thus not a new proposal when viewed in the global context. Many researchers (Jamieson and Cloughley, Reference Jamieson, Cloughley, Warrick, Kenny and Harman2001; Evans, Reference Evans, Evans and Jinapala2010; Huda et al., Reference Huda, Sadras, Wani and Mei2011; D'Orgeval et al., Reference D'Orgeval, Boulanger, Capalbo, Guevara, Penalba and Meira2010; Tingem et al., Reference Tingem, Rivington, Bellocchi and Jeremy2008) have suggested this option on the basis of their analyses elsewhere.
In Pakistan, however, few studies are available in the literature which have addressed the scientific basis of this adaptation option. Remarkably, Sultana et al. (Reference Sultana, Ali, Iqbal and Khan2009) have used a decision system (CSM-Cropsim-CERES-Wheat model) to model scenarios for four climatic zones of Pakistan. The authors have assessed different alterations in the sowing date as an adaptation option to offset the likely impacts of climate change. The results of their analysis support the findings of the present study as they conclude that wheat yield is expected to decline in arid and semi-arid zones of Pakistan. In order to reduce these losses, changes in sowing from mid-December to late December in arid zone while changes in sowing from late November (current practice of sowing) to earlier December in semi-arid zone will be beneficial. Similarly, Shah et al. (Reference Shah, Akmal, Asim, Farhatullah, Raziuddin and Rafi2012) have investigated maize growth and yield under changing climate by setting up field experiments in Peshawar. The authors concluded that climate change has an adverse effect on crop growth and development and hence results in losses of dry matter and yield. A reduction in productivity of maize by delaying sowing is the consequence of adverse weather effects on the growth of maize in total and post-anthesis stage of the crop.
In this study, however, wheat and cotton were cultivated with rotation. Therefore, while adapting altered sowing dates it should be cautioned that each recede in sowing date will increase the length of the growing season and vice versa. In the crop scheduling option in CROPWAT (results not shown), this fact is considered with care so that any alteration in sowing date of one crop does not interfere with other crops grown during the remainder of the year.
CONCLUSIONS AND RECOMMENDATIONS
Irrigated agriculture systems are considered less vulnerable to climate change compared to rain-fed systems. However, lack of farmers' adaptive capacity emphasizes the likely adverse consequences of this moderate vulnerability. Based on climate change VI, Cotton/Wheat Punjab zone is ranked in the middle of nine agro-climatic zones of Pakistan. The semi-arid climate and inherent inefficiency of supply based canal irrigation system are the features of this zone which exacerbate the situation and call for scientifically tested adaptation options for sustainable agriculture.
Increase in maximum and minimum temperature is expected in the next thirty years (2013–2042) but the precipitation will behave erratically. Shifts in the precipitation pattern among different seasons will also disturb the crop-calendar of the study area. The timing of precipitation matters a lot in this agro-climatic zone with high seasonality and inter-annual variability of precipitation. This variation in precipitation timing will impact the water availability at different stages of the crops.
The response of crops to elevated temperatures (owing to increased life cycle length of the crops) will be relatively greater when precipitation is taken as a limiting factor compared to regular supply of canal water. This suggests that variability in precipitation pattern can change the crop water requirement.
Evaluation of sowing date shifts as an adaptation option depicts that there is a high probability of decreased crop water requirement for wheat in early sowing dates compared to baseline period under climate change. For cotton, however, late sowing can be beneficial due to relatively reduced crop water requirement compared to the baseline date. This implies that alteration in the sowing date of wheat and cotton in a semi-arid environment can be used as an effective adaptation option to climate change.
Acknowledgements
Part of this work was undertaken at Centre of Excellence in Water Resources Engineering (CEWRE), Pakistan which was supported by the Abu Dhabi Dialogue Knowledge Forum (ADDKF) under the South Asia Water Initiative (SAWI), a programme of the World Bank with support from the governments of the United Kingdom, Australia, and Norway. The authors also acknowledge with thanks King Abdulaziz University represented by the Center of Excellence in Desalination Technology and Faculty of Meteorology, Environment and Arid Land Agriculture for their collaboration and technical support. The study design, data collection, analysis, interpretation, views and opinions are exclusively those of the authors.


