


Introduction
Atmospheric concentrations of the greenhouse gases (GHGs) methane (CH4) and nitrous oxide (N2O) have rapidly increased from preindustrial levels of 722 and 270 ppb to the current levels of 1830 and 324 ppb, respectively (Myhre et al., Reference Myhre, Shindell, Bréon, Collins, Fuglestvedt, Huang, Stocker, Qin, Plattner, Tignor, Allen, Boschung, Nauels, Xia, Bex and Midgley2013). About one-fifth of global GHGs derive from agricultural emissions (FAO, 2016), with rice paddy fields being major contributors. For example, 30 and 11% of agricultural emissions of CH4 and N2O, respectively, are derived from rice fields (Linquist et al., Reference Linquist, Adviento-Borbe, Pittelkow, Kessel and Van Groenigen2012). In China, the second largest global producer of rice by land area, CH4 and N2O emissions during the growing season are approx. ∼7.4 Tg and ∼50.3 Gg, respectively, equating to 2.7% of total anthropogenic and 29.2% of agricultural soil GHG emissions (Cai, Reference Cai2012; Chen and Zhang, Reference Chen and Zhang2010; Yan et al., Reference Yan, Akiyama, Yagi and Akimoto2009). There is an urgent need to minimize CH4 and N2O release from rice paddy fields while safeguarding crop yields, and sustainable agricultural practices may offer a potential solution (Smith et al., Reference Smith, Martino, Cai, Gwary, Janzen, Kumar and Smith2008; Wu et al., Reference Wu, Ata-Ul-Karim, Singh, Wang, Wu and Liu2019).
Several factors affect GHG emissions from soils, including physicochemical properties, microbial community characteristics, and soil carbon (C) and nitrogen (N) pools (Behnke et al., Reference Behnke, Pittelkow, Nafziger and Villamil2018; Bhattacharyya et al., Reference Bhattacharyya, Nayak, Mohanty, Tripathi, Shahid and Kumar2013; Galvez et al., Reference Galvez, Sinicco, Cayuela, Mingorance, Fornasier and Mondini2012; Wang et al., Reference Wang, Lai, Sardans, Wang, Zeng and Penuelas2017). Soil microbial biomass C (MBC), labile organic C (LOC), soil ammonium N (NH4 +-N), and nitrate N (NO3 −-N) are important indicators of soil active organic C components and soil unstable N pools, respectively, because their decomposition and turnover are closely related to soil C and N cycles (Singh et al., Reference Singh, Tiwari, Gupta and Singh2018). Changes in the concentration of these soil labile C and N forms are closely related to variations in GHG emissions (Case et al., Reference Case, Uno, Nakajima, Jensen and Akiyama2018; Shen et al., Reference Shen, Tang, Liu, Wang, Li and Ge2014; Wang et al., Reference Wang, Zhang, Xiong, Liu and Pan2011; Wang et al., Reference Wang, Wang, Sardans, Singla, Zeng and Lai2019a,b; Zhang et al., Reference Zhang, Cui, Pan, Li, Hussain and Zhang2010). Biochar produced from agricultural waste increases carbon (C) sequestration and mitigates against GHG emissions (Chen et al., Reference Chen, Meng, Han, Lan and Zhang2019; Stewart et al., Reference Stewart, Zheng, Botte and Cotrufo2013; Woolf et al., Reference Woolf, Amonette, Street-Perrott, Lehmann and Joseph2010), with the effects of biochar type on agricultural soils and C storage documented in several studies (El-Naggar et al., Reference El-Naggar, Lee, Rinklebe, Farooq, Song and Sarmah2019; Mukome et al., Reference Mukome, Six and Parikh2013; Singla and Inubushi, Reference Singla and Inubushi2013). When applied as an amendment, the impacts of biochar on crop yield and GHG emissions were found to be largely dependent on application rate (Chen et al., Reference Chen, Meng, Han, Lan and Zhang2019; Singla et al., Reference Singla, Dubey, Singh and Inubushi2014). However, optimum biochar treatment rates for reducing GHG emissions and maximizing yields in subtropical rice paddy fields in China are ambiguous and undefined (Wang et al., Reference Wang, Lai, Li, Kim, Zeng and Li2014).
Thus, the aim of this field study was to quantify the optimal application rate of biochar to achieve a balance between rice grain yields and reducing GHG emissions. Specifically, the objectives of our field experiment were to quantify the effects of biochar application rate on a subtropical double-cropping rice system on: (1) GHG emissions; (2) global warming potential (GWP) and GHG emission intensity (GHGI) in early and late growing seasons; (3) soil physicochemical properties; and (4) the relationship between GHG emissions intensity and soil physicochemical properties.
Materials and Methods
Study area
The field experiments were carried out in two consecutive rice crops, from April to November 2016 (early and late rice), at the Wufeng Agronomy Field. This plot of land is located within the Fujian Academy of Agricultural Sciences (26.1°N, 119.3°E), in the southeastern province of Fujian, China, and is known for its subtropical monsoon climate. The early rice growing season extended from April 21 to July 6, 2016, and the late rice growing season from July 26 to October 31, 2016. The air temperature and humidity were recorded throughout the study period and were shown in Figure S3. In the initial stage of the experiment, the 0–15 cm soil layer comprised a bulk density of 1.01 g m−3, pH (1:5 with H2O) of 7.1, and organic C, total N, and total phosphorous (P) concentration of 18.1, 1.2, and 1.1 g kg−1, respectively. Paddy soils were moist and poorly drained and comprised 28, 60, and 12 % sand, silt, and clay fractions, respectively. Water levels in the paddy field was maintained at 5–7 cm above the soil surface during the rice growth periods using an automatic water-level controller, and the field was drained 2 weeks prior to each harvest.
Experimental design
Three replicates of four treatments (10, 20, and 40 t ha−1 of broadcast-applied biochar, and an untreated control) applied to 2 × 4-m plots were arranged in a randomized complete block design. Polyvinyl chloride (PVC) baffle boards (0.5 cm thick, 30 cm high) were installed along the margins of each plot to prevent the exchange of water and nutrients across different treatment plots. The field was plowed to a depth of 15 cm with a moldboard plow and was leveled 2 days before rice transplantation and immediately after plowing. Clumps of 1-month-old seedlings (three plants per clump) of early rice (‘Hesheng 10’) and 15-day-old seedlings of late rice (‘Jiafuzhan’) were transplanted by hand at a spacing of 14 × 28 cm on April 26 and July 26, 2016, respectively. Considering the influence of early rice planting residues (such as straw and roots) and biochar residues, the in situ experiments of the late rice season were carried out in different locations on the same plot (with the same light and water and fertilizer conditions).
Before transplanting rice seedlings in the early and late rice seasons, biochar was applied to each experimental plot only once in each rice season. In this study, biochar was produced from corncob in a biogas energy pyrolysis furnace using anoxic carbonization technology, at a maximum pyrolysis temperature of 500 °C and a retention time of 2 h. The composition of biochar used in this study contained 422.53 g C kg−1, 10.49 g N kg−1, 1.56 g P kg−1, and 4.82 g Fe kg−1, with a pH (H2O) of 9.29. Prior to soil application, the biochar was sieved through a 2-mm mesh. Biochar application involved removing and mixing ploughed surface soil with biochar in a large plastic box container, transferring the mixed topsoil back to the sample plot and leveling it off. In order to prevent the biochar from floating up onto water’s surface, we manually pressed the biochar into the surface soil. All plots were managed with local conventional practices, including mineral fertilization which comprised of a compound fertilizer (48% of total nutrients and consisting of N, P, and K at 16%, respectively) and urea (total N 46% with a particle size 2–4.75 mm). Basal fertilizer (45 kg of N ha−1, 40 kg of P2O5 ha−1, and 40 kg of K2O ha−1) was applied 1 day prior to rice seedling transplantation, the second application of fertilizer (35 kg of N ha−1, 20 kg of P2O5 ha−1, and 20 kg of K2O ha−1) was broadcast during the tiller initiation stage at 7 days after transplanting (DAT), and the third application (18 kg of N ha−1, 10 kg of P2O5 ha−1, and 10 kg of K2O ha−1) was broadcast during the panicle initiation stage at 56 DAT.
Greenhouse gases
Static closed chambers were used to measure CH4 and N2O gas emissions (Datta et al., Reference Datta, Yeluripati, Nayak, Mahata, Santra and Adhya2013). The PVC chambers consisted of an upper transparent compartment (100-cm high × 35-cm wide and 35-cm long) placed on a permanently installed basal collar (30-cm high × 35-cm wide and 35-cm long). The chamber base was embedded horizontally into the soil and the upper base section grooved to facilitate sealing with water during gas collection. Gases were sampled weekly – ensuring that the upper chamber enclosing the rice plants was sealed with water prior to sample collection – by extracting 40 ml of gas and injecting into aluminum foil gas sampling bag (Delin Gas Packaging Co., Ltd. Dalian, China) three times at 15-min intervals and then sealed with a butyl rubber septum. Samples were immediately transported to the laboratory for CH4 and N2O analysis. During gas sampling, a portable thermometer (SmartAR807, Hong Kong, China) was used to measure the temperature in the static closed chamber, and a portable conductivity meter (MEET-1000+, China) was used to measure soil temperature and salinity.
CH4 and N2O concentrations in the headspace air samples were determined by gas chromatography (Shimadzu GC-2010 and Shimadzu GC-2014, Kyoto, Japan) using a stainless steel Porapak Q column (2 m length, 4 mm OD, 80/100 mesh). A methane conversion furnace, flame ionization detector, and electron-capture detector (ECD) were used for the determination of the CH4 and N2O concentrations, respectively. The operating temperatures of the column, injector, and detector for the determination of the CH4 and N2O concentrations were adjusted to 45, 100, and 280 °C, to 70, 200, and 200 °C, and to 70, 200, and 320 °C, respectively. Helium (99.999% purity) was used as a carrier gas (30 ml min−1), and a make-up gas (95% argon and 5% CH4) was used for the ECD. The gas chromatograph was calibrated before and after each set of measurements using 1.01, 7.99, and 50.5 μl CH4 l−1 in He and 0.2, 0.6, and 1.0 μl N2O l−1 in He (CRM/RM Information Center of China) as standards. Three injections were used for each analysis. One sample was injected into the gas chromatograph for each analysis. The detection limits of the instrument for CH4 and N2O were 0.1 and 0.05 ppm, respectively. CH4 and N2O fluxes were then calculated as the rate of change in the mass of CH4 and N2O per unit of surface area and per unit of time.
Cumulative gas emissions were calculated according to Eq. 1:
 $$CE = \sum\nolimits_{i = 1}^n {({F_i} + {F_{i = 1}}2)} \times \left( {{t_{i + 1}} - {t_i}} \right) \times 24$$
where n is the number of gas-measuring days, CE is cumulative emissions (kg ha−1), F is gas emission flux (mg m−2 h−1), and t i+1 -t i is the interval between the ith and (i + 1)th measuring days. There were 77 and 98 cumulative days in the early and late paddy seasons, respectively.
Global warming potential (GWP) and greenhouse gas intensity (GHGI)
CO2 is typically used as the reference gas in the estimation of GWP, where changes in the emission of CH4 and N2O are converted to CO2 equivalents (Myhre et al., Reference Myhre, Shindell, Bréon, Collins, Fuglestvedt, Huang, Stocker, Qin, Plattner, Tignor, Allen, Boschung, Nauels, Xia, Bex and Midgley2013). Based on a 100-year time horizon, we assumed that the GWP for CH4, CO2, and N2O was 34, 1, and 265, respectively (IPCC, 2014). Therefore, the GWP of combined CH4 and N2O emissions was calculated using the equation:
 $${\rm{GWP}} = {\rm{cumulative\;C}}{{\rm{H}}_4}{\rm{emission}} \times {\rm{cumulative\;}}{{\rm{N}}_2}{\rm{O\;emission}} \times 26$$
Greenhouse gas emission intensity (GHGI) was calculated using the following equation (Islam et al., Reference Islam, Gaihre, Islam, Akter, Al Mahmud, Singh and Sander2020):
 $${\rm{GHGI}} = {\rm{ }}\left( {{{{\rm{GWP}}} \over {{\rm{Rice}}\;{\rm{yield}}}}} \right)$$
where GHGI is the greenhouse gas emission intensity of rice yield (CO2-eq kg ha−1). GWP is the greenhouse warming potential of GHGs.
Soil properties
Soil samples from the top plowed layer (0–10 cm) were collected from each plot using a small core soil sampler (length and diameter of 0.5 and 0.1 m, respectively) and immediately placed in a portable incubator and transport back to the laboratory. Following removal of plant material and residual roots, soil samples were stored in a refrigerator at 4 °C prior to analysis.
Soil bulk density, pH, and total soil iron (Fe), Fe3+, Fe2+, and Fe3+ content were measured on a weekly basis, following gas collection. The cutting ring method was used to measure soil bulk density, and pH was measured using a pH meter (Orion PHS-3C, China) in a 1:5 (v/v) soil: water slurry ratio. For the determination of Fe2+ concentration, 2 g of fresh soil was extracted using 5 ml of 0.5 M HCl for 24 h, shaken at 250 rpm for 15 min, and centrifuged at 4000 × g min−1 for 15 min, before 1 mL of the extract was mixed with 5 ml of sodium acetate (1 mol L−1) and 4 mL of color reagent (1 g L−1 ferrozine); the solution was diluted to 50 ml in a volumetric flask, and absorbance at 510 nm was measured (UV2450, Shimadzu Corporation, Kyoto, Japan) (APHA, 2005). Total soil Fe was reduced to Fe2+ using hydroxylamine hydrochloride (2%), and then Fe2+ was extracted and measured as described above. The Fe3+ concentration was calculated by subtracting Fe2+ from the total Fe concentrations (Yin et al., Reference Yin, Peñuelas, Sardans, Xu, Chen, Fang, Wu, Singh, Tavakkoli and Wang2021).
The content of NH4 +-N, NO3 −-N, dissolved organic carbon (DOC), LOC, and MBC in soils was measured at the rice tillering, jointing, flowering stage, and at maturity. Following the extraction of soil with KCl, NH4 +-N and NO3 −-N were determined using a sequence flow analyzer (SAN++, SKALAR Corporation production, Breda, The Netherlands). Soil MBC was measured by the chloroform fumigation-extraction method (Vance et al., Reference Vance, Brookes and Jenkinson1987), and MBC was calculated as the difference between the DOC value in fumigated and unfumigated soil. A total organic carbon (TOC) analyzer (TOC-VCPH, Shimadzu Corporation, Kyoto, Japan) was used to measure DOC in K2SO4 extracts, and a conversion factor (kec) of 0.45 was used to determine the MBC. Soil LOC was determined using the 333 mmol L−1 KMnO4 oxidation method (Chung et al., Reference Chung, Ngo, Plante and Six2010; Xu et al., Reference Xu, Lou, Sun, Wang, Baniyamuddin and Zhao2011).
Measurement of rice biomass and rice yield
Mature rice plants were counted and collected from 1 × 1-m sampling quadrat in the study plots at harvest stage. Entire plants were cleaned of soil and dried in an oven at 75 °C until a constant temperature was reached and weighed to determine above- and belowground biomass. Rice yields (t ha−1) were determined by harvesting all the rice grains from replicate treatment plots, weighing them and then dividing the total weight by the area of the plots. The rice harvest index is calculated by dividing the weight of the rice harvested per unit area by the weight of the total rice dry matter.
Statistical analysis
Data were checked for normality and homogeneity of variance, and where necessary, were log-transformed. Pearson correlation analysis was carried out using corrplot software package in R to determine the relationship between GHG fluxes and soil physical and chemical properties and soil carbon and nitrogen nutrients. Difference of treatments, sampling time, and the interaction effects on GHG and soil properties were determined by repeated-measures analysis of variance (RM-ANOVA). Statistical analyses were performed using SPSS Statistics 18.0 (SPSS Inc., Chicago, IL, USA).
Results
GHG emissions
In early rice, effects of biochar application rate on flux in CH4 varied throughout the growth period (p < 0.01) (Figure 1a, Table 1). Mean CH4 fluxes during the growth season in the control and 10, 20, and 40 t of biochar ha−1 treatments were 0.5 ± 0.1, 0.4 ± 0.1, 1.0 ± 0.0, and 1.50 ± 0.2 mg m−2 h−1. Peak fluxes were noted on April 30 for the 20 t ha−1 treatment (3.33 ± 0.01mg m−2 h−1), on May 14 in the control, 10, and 40 t ha−1 treatments (3.0 ± 0.9, 1.3 ± 0.1, and 6.0 ± 0.3 mg m−2 h−1, respectively). During the growth period, the mean CH4 flux under 10 t biochar ha−1 treatment declined by 26% compared to the control, while the 20 and 40 t biochar ha−1 treatments increased by 102% and 200%, respectively (Figure 1a). Although the 10 t biochar ha−1 had no significant effect on cumulative CH4 emissions, it levels were 27.8% lower than the control (Figure 2a). Conversely, cumulative CH4 emissions for 20 t and 40 t biochar ha−1 treatments significantly (p < 0.05) increased by 103% and 202%, respectively, relative to the control treatment plot (Figure 2a).

Figure 1. Temporal effects of biochar application rate on (a) CH4 and (b) N2O emissions from early and rice cropping systems. Vertical lines represent SE.
Table 1. Summary of the RM-ANOVAs for GHG fluxes from paddy fields in the different studied periods and for the different biochar application rates

ns, not significant.
* Significant at p < 0.05 level.
** Significant at p < 0.01 level.

Figure 2. Temporal effects of biochar application rate on accumulated CH4 and N2O emissions in early (a, c) and late (b, d) rice cropping systems. Vertical lines represent SE.
In late rice, mean seasonal fluxes in the control and 10, 20, and 40 t of biochar ha−1 treatments (5.2 ± 0.6, 3.9 ± 0.7, 4.5 ± 0.2, and 3.9 ± 0.6 mg m−2 h−1, respectively) were higher than the respective treatments in early rice. This is mainly attributed to higher CH4 emissions during the first 30 days (i.e., the early stage of rice growth) for each individual treatment including the control (Figure 1a). Compared to the control, the 10 t, 20 t, and 40 t biochar ha−1 treatments decreased cumulative CH4 emissions by 26.6, 27.2, and 14.3%, respectively. However, individual biochar treatments failed to show a significant (p > 0.05) effect on CH4 emissions throughout the late rice growing season (Figures 1a and 2b).
The N2O emission flux during the early rice growing season was relatively variable with irregular absorptions and emissions (Figure 1b). Peaks emissions for the 10 and 20 t of biochar ha−1 treatments occurred on May 7 (204.5 ± 50.5 and 216.9 ± 43.4 µg m−2 h−1, respectively), and on May 20 for the control and 40 t of biochar ha−1 treatment (419 ± 61.1 and 230 ± 34.0 mg m−2 h−1, respectively) (Figure 1b). Compared to the control (38.9 ± 26.4 µg m−2 h−1), the mean N2O fluxes for 10 t, 20 t, and 40 t biochar ha−1 treatments were 48.8, 85.7, and 90.0 % higher, respectively, thorough the growth season. The cumulative N2O emissions from early rice increased with rising levels of biochar application. Although the 10 t, 20 t, and 40 t biochar treatments were 13.1%, 45.3%, and 56.9% higher than the control, these differences were not significant (Figure 2c). In the late rice trial, N2O emissions in the 10 t and 20 t of biochar ha−1 treatments were relatively constant through the growing season (Figure 1b). Overall, the mean N2O fluxes during the growth season for the control, 10, 20, and 40 t of biochar ha−1 treatments were 11.1 ± 10.9, 18.3 ± 16.1, 23.9 ± 12.9, and 10.8 ± 12.1 µg m−2 h−1, respectively (Figure 1b). This corresponded to a 63.8 and 114% increase but 3.32% decline in mean N2O fluxes for 10, 20, and 40 t biochar ha−1 treatments, respectively, in comparison to the control.
Rice yield, GWP, and GHGI
Biochar application affected rice yield, GWP, and GHGI (Table 2). Compared to the nil-biochar application, biochar application at varied rates did not affect rice yield. However, compared to 10 t biochar ha−1, increasing biochar application rate to 40 t ha−1 significantly decreased total rice yield (sum of early and late cropping). The application of 40 t of biochar ha−1 in early rice and 20 and 40 t of biochar ha−1 in late rice trails reduced rice yields by 20.9, 13.7, and 4.1%, respectively (Table 2). Generally, the results revealed differences in total rice yield between respective treatments over the two seasons. For example, compared to the control, rice yield from the 10 t ha−1 treatment plots was not only the highest but significantly (p < 0.05) produced more rice than the 40 t ha−1 biochar treatment. Total GWP and GHGI were consistently greater in late rice than in early rice, regardless of treatment. All biochar treatments were revealed to have no significant effect on total GWP or GHGI in late rice. Conversely, total GWP and GHGI increased by 87.0 and 80.6% with 20 t of biochar ha−1, respectively, and by 144 and 189% with 40 t of biochar ha−1, respectively, in early rice plots (Table 2). Over the two growing seasons, total GWP and GHGI decreased by 21.9 and 33.5% in the 10 t of biochar ha−1 treatment, respectively, while no significant differences were found between the control, 20, and/or 40 t biochar ha−1 treatments in total GWP and GHGI. Finally, the aboveground biomass and total biomass were significantly increased at 10 t ha−1 for early and late rice (p < 0.05), and overall, biomass and harvest indexes for early rice were higher than those for late rice crops, but no significant difference in underground biomass and harvest index between early and late rice treatments was evident (Table 3).
Table 2. Effects of biochar application rate to paddy soils on global warming potential (GWP), rice yield, and greenhouse gas intensity (GHGI)
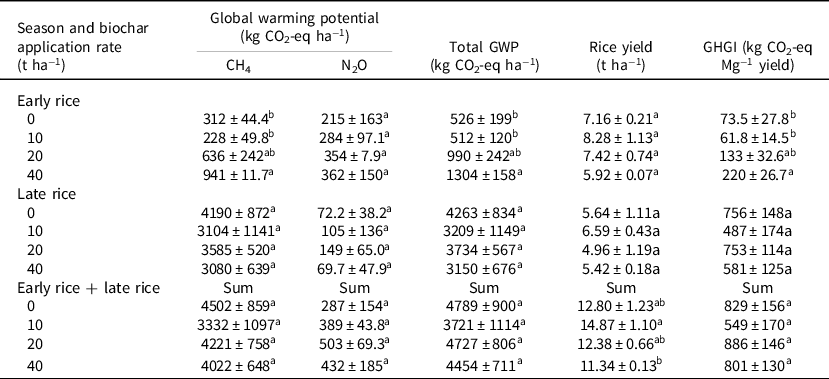
Different letters within a column indicate treatment differences (p < 0.05).
Table 3. Effects of biochar application rate on above- and belowground biomass

Different letters within a column indicate treatment differences (p < 0.05).
Soil physicochemical factors
Biochar treatment had some effects on soil temperature during the early rice growing season and on salinity during the early and late rice growing seasons (p < 0.01) (Table S1, Figure 3). And salinity tended to be greater in biochar-treated soils. Soil temperature was lower in treated soil on April 30 and October 10, but there were no differences compared to the control treatment (Figure 3d). In general, treatment effects on soil pH through the rice growing seasons were variable with levels fluctuating around neutral in early rice, irrespective of treatment, and peaking at c. pH 7.5 across all treatments in mid-October for the late rice season. In addition, in the later stages of the two rice growing seasons, the soil bulk density of the three biochar treatments was lower than that of the control treatment, especially in early rice.

Figure 3. Temporal effects of biochar application rate on (a) soil salinity, (b) pH, (c) bulk density, and (d) temperature in early and late rice cropping systems. Vertical lines represent SE.
Biochar treatment had some effects on Fe2+ and Fe3+ in the latter stages of early rice and throughout the entire late rice growing season (p < 0.01) (Table S1). Content of Fe2+ in early and late rice tended to be greater in soils treated with biochar. In the middle and late stages of each rice growing season, the Fe2+ content increased with the increase in biochar application rates (Figure 4b).

Figure 4. Temporal Effects of biochar application rate on (a) soil total Fe, (b) Fe2+, and (c) Fe3+ concentrations in early and late rice cropping systems. Vertical lines represent SE.
Soil carbon and nitrogen nutrients
ANOVA revealed within-treatment temporal changes in soil NH4 +-N content during the late rice growing season and in LOC and NO3 −-N levels during the early and late rice growing seasons (p < 0.01, Table S1). There were within-season treatment effects on LOC (positive in early season jointing stage; negative in late season tillering stage), NH4 +-N (negative in early season tillering and jointing and late season mature stages; positive in late season tillering and jointing stages), and NO3 −-N (negative in late season tillering, jointing, and mature stages; positive in late season flowering stage). However, no effects on MBC were evident (Figure 5b).

Figure 5. Effects of biochar application rate on soil concentrations of (a) LOC, (b) MBC, (c) NH4 +-N, and (d)NO3 −-N in the main rice growth stages. Vertical lines represent SE.
Correlation between GHG fluxes and soil physicochemical properties
In early season rice, CH4 flux was positively associated with soil salinity in all treatments (p < 0.01), negatively correlated with soil temperature for the 20 and 40 t of biochar ha−1 treatments (p < 0.01 and p < 0.05, respectively), and LOC in the 20 t ha−1 treatment (p < 0.05). N2O flux in the 20 t of biochar ha−1 treatments was negatively correlated with NO3 −-N and soil temperature (p < 0.01) but positively correlated with soil salinity (p < 0.05) (Figure S1; Tables S2 and S3).
In late season rice, CH4 flux was positively correlated with: soil salinity, temperature, and NH4 +-N content across all treatments (p < 0.01); soil temperature and Fe2+ in the 10 t of biochar ha−1 treatment (p < 0.01); soil temperature and pH in the 20 t of biochar ha−1 treatment (p < 0.05); soil Fe2+ in the 20 t of biochar ha−1 treatment (p < 0.01); and content of NO3 −-N and MBC in the 40 t of biochar ha−1 treatment (p < 0.05) (Tables S2 and S3). Flux in N2O was positively associated with soil temperature in the 20 t of biochar ha−1 treatment (p < 0.01) and soil bulk density in the 40 t of biochar ha−1 treatment (p < 0.05) but negatively correlated with soil total Fe and Fe2+ across all treatments (p < 0.05) (Figure S2; Tables S2 and S3).
Discussion
Effects of biochar application on GHG emissions
Methanogenesis results from the degradation of organic matter in anoxic environments like paddy fields (Liu et al., Reference Liu, Yang, Wu, Wang, Chen and Wu2011), and biochar provides many organic carbon substrates. Literature searches regarding the impacts of biochar application on CH4 emissions from rice fields is somewhat conflicting; for example, Knoblauch et al. (Reference Knoblauch, Maarifat, Pfeiffer and Haefele2011) and Wang et al. (Reference Wang, Ma, Shan, Xia, Lin and Yan2019b) reported increased emissions, while Liu et al. (Reference Liu, Yang, Wu, Wang, Chen and Wu2011) and Zhang et al. (Reference Zhang, Bian, Pan, Cui, Hussain and Li2012) described contradictory reductions. In this study, we found that the application of 40 t biochar ha−1 to early rice increased cumulative CH4 emissions (p < 0.05) which are in full agreement with Knoblauch et al. (Reference Knoblauch, Maarifat, Pfeiffer and Haefele2011) findings, but incongruous with Shen et al. (Reference Shen, Tang, Liu, Wang, Li and Ge2014) results. Our results showed that lower application rates of biochar to early rice (10 t ha−1) and all rates applied to late rice reduced the cumulative CH4 emissions of the rice season, indicating that the application of 10 t of biochar ha−1 may be an effective way to reduce CH4 emission from double-cropping rice systems. This may be related to the increase in soil Fe2+ content in biochar-added paddy soils compared to the control. The study found that the addition of Fe2+ inhibited the channels of acetic acid production (Chidthaisong and Conrad, Reference Chidthaisong and Conrad2000). Acetate/acetate is an important methane-producing substrate in paddy fields (Electron acceptors), used for the anaerobic degradation of organic matter, and the lack of methane-generating substrates will cause a relative reduction in methane emissions (Wang et al., Reference Wang, Lai, Li, Kim, Zeng and Li2014). In addition, at this level, low-dose biochar treatments produced a significant increase in rice yield and biomass (Tables 2 and 3) – especially in the early rice – consistently with previous studies (Singh et al., Reference Singh, Tiwari, Gupta and Singh2018; Singla and Inubushi, Reference Singla and Inubushi2014).
Cumulative emissions of CH4 from late rice were greater than from early rice, regardless of treatment, possibly due to the higher soil temperatures recorded in late rice at first 30 days (Figure 3). Presumably, this has increased the decomposition of organic matter in the soil and biochar and led to an increase in CH4 production and emissions (Chen et al., Reference Chen, Meng, Han, Lan and Zhang2019; Deng et al., Reference Deng, Van Zwieten, Lin, Liu, Sarmah and Wang2017). Knoblauch et al. (Reference Knoblauch, Maarifat, Pfeiffer and Haefele2011) reported that additional residues from early harvested rice increases CH4 emissions during late rice cropping. We found that the CH4 emission fluxes of early and late rice peaked during the tillering stage (< 30 DAT), suggesting that this was possibly due to decomposition of unstable biochar components which would serve as substrate for methanogens – especially pertinent during the early growth stages of rice (Chen et al., Reference Chen, Meng, Han, Lan and Zhang2019) when paddy flooding creates reducing environmental conditions (Wang et al., Reference Wang, Lai, Li, Kim, Zeng and Li2014). Moreover, the study revealed that the effects of biochar addition on CH4 emission in early rice and late rice differed, whereby addition to early rice mainly promoted CH4 emissions, while diminishing methane release in late rice cultivation.
Although previous studies have shown that application of biochar to rice paddy soils reduces N2O emissions (Cayuela et al., Reference Cayuela, Sánchez-Monedero, Roig, Hanley, Enders and Lehmann2013; Singla and Inubushi, Reference Singla and Inubushi2014; Wang et al., Reference Wang, Zhang, Xiong, Liu and Pan2011; Zhang et al., Reference Zhang, Bian, Pan, Cui, Hussain and Li2012), no reductions in N2O emissions were generally evident in either early or late rice, with the exception of biochar applied at 40 t ha−1 in late rice. Even though the early rice season in this study was 21 days shorter than the late rice season, N2O accumulated emissions during the early rice season were greater than the late rice season, regardless of biochar application (Figure 2). This indicates that more biochar N was converted into N2O in the early versus late rice season, probably because the late rice was submerged under water for longer periods. Under those conditions, complete reduction would have proceeded to N2 via denitrification (Shen et al., Reference Shen, Tang, Liu, Wang, Li and Ge2014; Zhang et al., Reference Zhang, Bian, Hussain, Li, Pan and Zheng2013). That is, greater reducing conditions in late rice soils facilitated by longer-term flooding has inhibited the nitrification process (across all treatments) thereby triggering CH4 emissions but diminishing N2O emissions. We found that the average cumulative N2O emissions of all the biochar treatments in early rice were higher than the control (Figure 2), in agreement with previous studies (Shen et al. Reference Shen, Tang, Liu, Wang, Li and Ge2014; Liu et al. Reference Liu, Shen, Li, Su, Ge, Jones and Wu2014). This increase in N2O emissions was consistent with noted higher soil content of NH4+-N and NO3 −-N as a result of biochar application. In contrast, cumulative N2O emissions in late rice decreased with increasing biochar application rate for reason mentioned above and or possibly as a consequence of gradually declining soil temperature directly affecting microbial activity. In essence, the study’s findings demonstrate that high levels of biochar addition exert greater inhibitory effects on N2O emissions and in agreement with those reported by Chen et al. (Reference Chen, Meng, Han, Lan and Zhang2019).
Effects of soil physicochemical properties on GHG emissions
Biochar is characterized by high levels of alkalinity, large particle surface area, and strong adsorption and stability properties that improve soil acidity, fix soil nutrients, and reduce GHG emissions (Antonangelo et al., Reference Antonangelo, Zhang, Sun and Kumar2019; Gul et al., Reference Gul, Whalen, Thomas, Sachdeva and Deng2015). However, in this study, biochar did not affect soil pH regardless of dosage rate. This is consistent with previously reported studies located with the same geographical area (Wang et al., Reference Wang, Lai, Li, Kim, Zeng and Li2014; Wang et al., Reference Wang, Sardans, Lai, Wang, Zeng and Tong2015). We found that biochar application increased soil salinity and total Fe and Fe2+ content and reduced soil bulk density in early and late rice cropping systems, all of which are consistent with results reported by Zhang et al. (Reference Zhang, Bian, Pan, Cui, Hussain and Li2012). The loose porous structure of biochar increases soil aeration and creates an aerobic environment conducive to methane-oxidizing bacteria proliferation, but hostile for denitrification with consequences of lower non-CO2 GHGs emissions (Van Zwieten et al., Reference Van Zwieten, Kammann, Cayuela, Singh, Joseph and Kimber2015) (Figure 6).
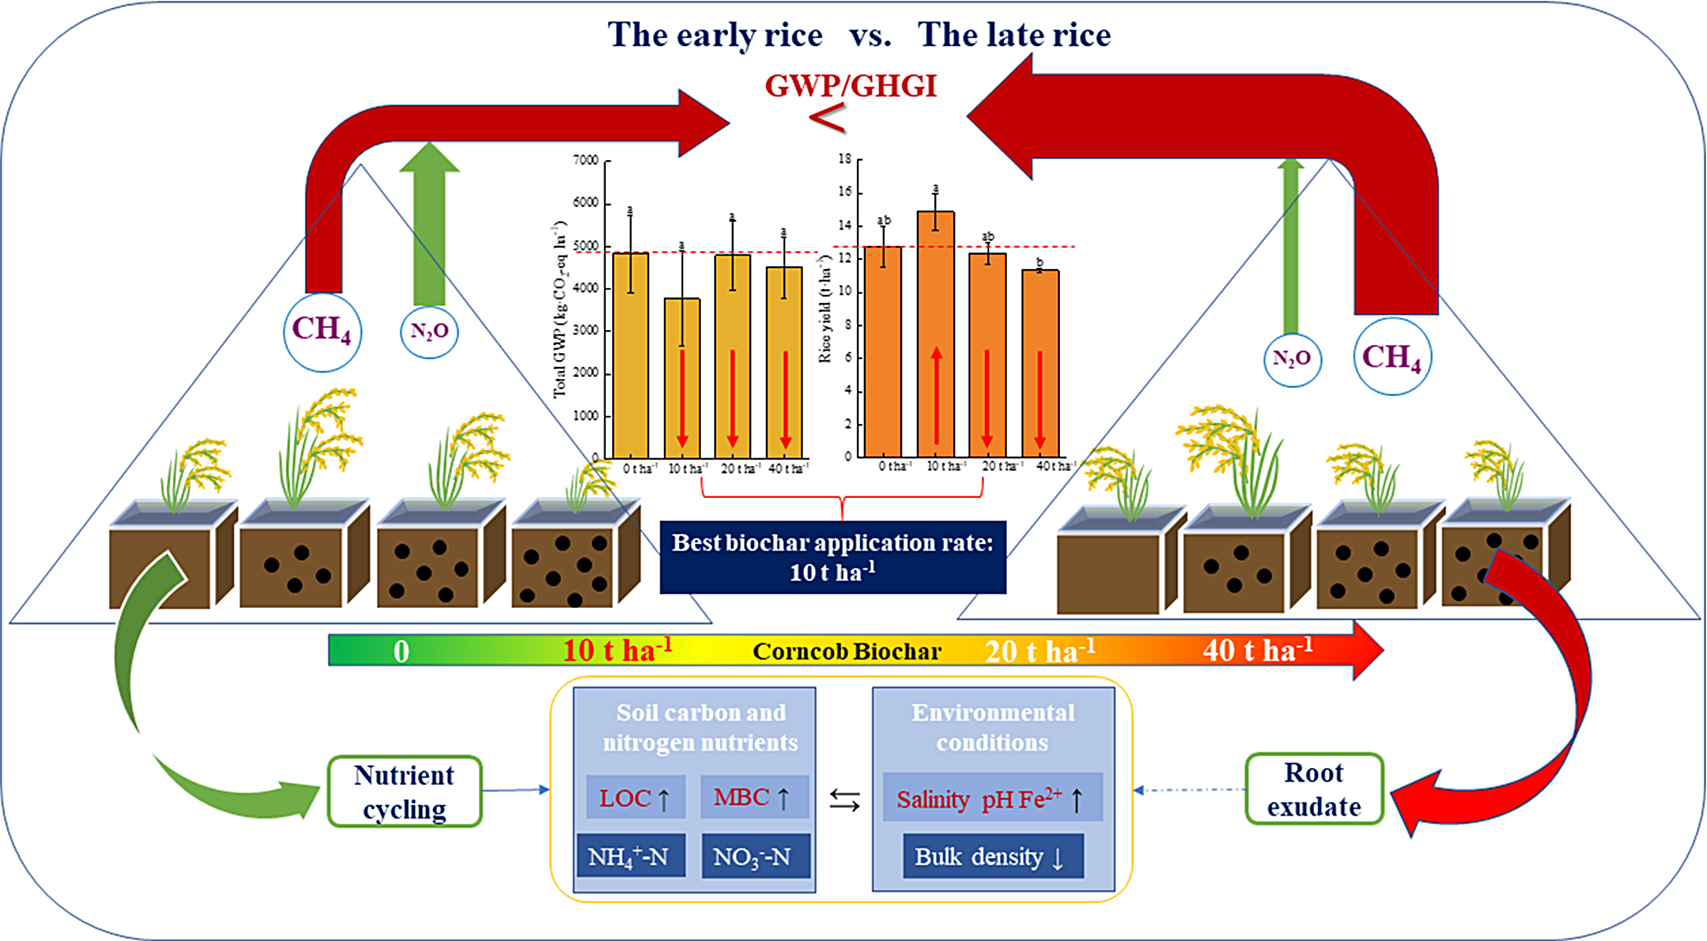
Figure 6. Graphic abstract. (Schematic of the relationships between subtropical double-cropping rice system and GWP/GHGI, soil carbon and nitrogen nutrients, and environmental factors. Among them, the number of black balls represents 0, 10, 20, and 40 t ha−1 biochar treatment; the size of rice plant represents the yield of each treatment; the red arrow represents the intensity of greenhouse gas emission. The bar graph in the middle represents the difference in total GWP and rice yield between treatments.).
We found that CH4 emissions in late rice were positively correlated with soil temperature and salinity, indicating that these are key drivers of GHG emissions in this rice cropping system. Indeed, raising the soil temperature enhances microbial respiration activity in rice soils which in turn affect GHG emissions rates (Castaldi, Reference Castaldi2000). In soils treated with biochar, CH4 fluxes of late rice were found to be positively correlated with NH4 +-N content, which, as a substrate for methane-oxidizing bacteria, may promote the oxidation rate of CH4 and inhibit its emission (Singh et al., Reference Singh, Tiwari, Gupta and Singh2018). In agreement with previous studies (Biederman and Harpole, Reference Biederman and Harpole2012; Singla et al., Reference Singla, Dubey, Singh and Inubushi2014; Zhang et al., Reference Zhang, Dijkstra, Liu, Wang, Jian and Lu2014), the MBC content increased in biochar-treated soils, reflecting biochar’s microclimate (pores) for microbial habitation and proliferation (Chen et al., Reference Chen, Meng, Han, Lan and Zhang2019) (Figure 6).
Effects of biochar application on GWP, GHGI, and rice yield
The rate of biochar addition was positively related to total GWP and GHGI in early rice crops, with levels significantly lower than in late rice. However, the application of biochar in late rice reduced total GWP and GHGI compared to control crops. Under these circumstances, CH4 was found to be the greater contributor to total GWP (Table 2), presumably as a result of longer submergence time and higher soil temperature during the early growth stage of late rice. GHG emissions in early rice were not reduced by biochar addition or significantly increased at 40 t ha−1, which is likely because although biochar can stabilize soil organic carbon (SOC) through organo-minerals interactions, it also contained soluble C that can stimulate SOC decomposition (Fang et al., Reference Fang, Singh and Singh2015; Wang et al., Reference Wang, Ma, Shan, Xia, Lin and Yan2019b). The contrasting effects of biochar on total GWP and GHGI in early and late rice may be due to the different production rates of CH4 caused by environmental factors (Shen et al., Reference Shen, Tang, Liu, Wang, Li and Ge2014).
Similar to the effects of chemical fertilizers (such as nitrogen fertilizers), the rate of biochar application positively correlates with rice yield only within a certain range (Zhong et al., Reference Zhong, Wang, Yang, Zhao and Ye2016). We found that only the 40 t of biochar ha−1 treatment significantly reduced the total yields of early and late rice, indicating a negative impact of high rates of biochar in this crop. When applying high-dose biochar, it is equivalent to inputting a large amount of organic matter, which may limit the balanced supply of soil nutrients in the early stages of the rice season (such as the jointing and tillering stages) and hinders the growth of seedlings, and therefore rice yield (Chen et al.,Reference Chen, Yang, Ding, Jiang and Sun2021). Furthermore, the reason why rice yield did not increase after the application of high-dose biochar is closely related to the biomass translocation and content changes (Yin et al., Reference Yin, Chen, Cao, Tao and Huang2020), which is also supported in our results on biomass. Under the local conventional water and fertilizer management measures, biochar can regulate soil properties and nutrient status (especially in soil bulk density, salinity, Fe2+, and activated organic carbon content) through its physical and chemical characteristics, thereby regulating rice crops growth characteristics to achieve the purpose of increasing the total annual yield of double-cropping rice. Given the double adversities of increased GHG emissions and lower crop yields, high biochar dosages are a poorer choice. There may be ‘excess nutrients’ in rice fields applied with medium and high doses of biochar, and higher salinity and pH will create an environment that is not conducive to the survival of microorganisms (Pokharel et al., Reference Pokharel, Ma and Chang2020), which together limit the growth of rice. The study found that in rice fields where the amount of nitrogen fertilizer is relatively low, the application of medium-dose phosphorus and potassium fertilizers is beneficial to maximize yield and minimize GHG production (Wang et al., Reference Wang, Wang, Sardans, Fang, Singh and Wang2020). Biochar can be mixed with appropriate amounts of phosphorus and potassium fertilizers to prepare biochar-based fertilizers, therefore allowing for fine-tuning of crop fields in accordance with local circumstances and environs.
Optimal rates of biochar that balance GHG mitigation and rice production
Overall, rice yields were greatest and levels of GHGI were lowest in early and late rice cropping when biochar was applied at a rate of 10 t ha−1 (Table 2). In early rice, increasing biochar application rate led to higher levels of GHGI, while in late rice – where levels of GHGI were consistently twofold greater – no effects on GHGI were evident when biochar was applied at 20 or 40 t ha−1. In addition to advocating biochar at 10 t ha−1, we recommend co-application with Fe-rich substances (such as slag) and controlled water management in the middle and later stages of rice growth to increase rice yield and reduce GHG emissions, as per our prior study findings (Wang et al., Reference Wang, Lai, Sardans, Wang, Zeng and Penuelas2017; Wang et al., Reference Wang, Wang, Sardans, Singla, Zeng and Lai2019a).
Conclusion
Biochar application increased soil salinity and Fe2+ content in soil and rice yield, and reduced soil bulk density. Application of biochar at a rate of 10 t ha−1 to early and late rice maintained rice yield and had the lowest levels of GHGI across this subtropical double-cropping system. High rates of biochar application (40 t ha−1) did not increase rice yield or reduce GHG emissions. Thus, we advocate for the application of biochar at a rate of 10 t ha−1 for sustainable rice cultivation. Additional research on optimizing biochar application with appropriate water and nutrient management is warranted, ensuring the sustainability of subtropical rice production in China.
Supplementary Material
To view supplementary material for this article, please visit https://doi.org/10.1017/S0014479721000259
Acknowledgements
The authors would like to thank Chengju Su, Guanglei Wang, and Xiaoting Huang for their assistance with field sampling. Funding was provided by the National Natural Science Foundation of China (41571287), the European Research Council Synergy project SyG-2013-610028 IMBALANCE-P, the Catalan Government grants AGAUR-2020PANDE00117 and SGR 2017-1005, the Spanish Government grant PID2019-110521GB-I00, and the Fundación Ramón Areces grant ELEMENTAL-CLIMATE. AFA was supported by Researchers Supporting Project number (RSP-2021/218), King Saud University, Riyadh, Saudi Arabia.


