INTRODUCTION
Sustainable intensification of agriculture is the current paradigm for rural households in less-developed countries to increase food production and for contributing to the UN's Sustainable Development Goals, particularly those relating to increasing food security, improving nutrition and reducing poverty (United Nations, 2015). There are many definitions of SI but it is generally understood that it entails an increase in agricultural production while minimizing or even reversing damage to the environment, e.g., ‘. . . the application of technology that can increase food production from existing farm land, places less pressure on the environment and does not undermine the capacity to continue producing food in the future’ (Garnett et al., Reference Garnett, Appleby, Balmford, Bateman, Benton, Bloomer, Burlingame, Dawkins, Dolan, Fraser, Herrero, Hoffmann, Smith, Thornton, Toulmin, Vermeulen and Godfray2013). Many major development initiatives (e.g., AGRA, 2017; USAID, 2016) are promoting SI on the premise that widespread adoption of modern technologies will contribute substantially to these goals. High-yielding crop varieties and improved management practices for producing both crops and livestock have all been shown to increase output per hectare under experimental conditions or in pilot schemes (Meyer, Reference Meyer2009), although sustained adoption of them by farmers has, in many cases, been disappointing (e.g., Arslan et al., Reference Arslan, McCarthy, Lipper, Asfaw and Cattaneo2013; Chirwa, Reference Chirwa2005; Giller et al., Reference Giller, Witter, Corbeels and Tittonell2009; Lugando et al., Reference Lugando, Dulla, Ngotio and Mkomwa2012). There is a large literature on constraints to adoption – constraints that include poor access to inputs, to appropriate knowledge and to markets (e.g., see Feder et al., Reference Feder, Just and Zilberman1985; Foster and Rosenzweig, Reference Foster and Rosenzweig2010 for reviews).
Selection of areas where agricultural intensification is feasible is generally on the basis of an assessment of biophysical characteristics that have a large influence on the growth and yield of crops and livestock, such as soil type and level of fertility, patterns of rainfall, evaporation and temperature. These parameters are important in defining the suitability of crops, varieties, breeds and their potential yields in any given area. Acknowledging that access to input and output markets is important, distance to towns and cities is sometimes calculated and used as an index of market potential.
In all this, however, it appears to be implicitly assumed that:
1. All rural households are farmers whose farms are defined by the biophysical characteristics of their environment and these in turn define their potential for achieving intensification. It is assumed that the potential for intensifying is the same as the feasibility of achieving it for individual households.
2. The key limiting factor for a rural household's income/wellbeing is the productivity of its farm, so that investing in more inputs leads to higher returns and poverty alleviation.
3. Rural households are willing to allocate additional time/money (and possibly take on more risk) to optimize inputs to, and maximize outputs from their farmland – they want to try to intensify.
However, the approach exemplified by these three assumptions ignores something that has a great bearing on the attractiveness of an intensification strategy for rural households. We ignore the extent to which households could benefit from agricultural intensification even if it could occur. As we shall see, there are limits to how much households with limited land can produce and earn from agriculture.
The ‘value’ – in the broadest sense, including the market value when sold and the monetized value when directly consumed – of agricultural outputs produced by a farming household is the product of the land area, the yield per unit land area and the unit price of the output. It follows that, for any given agricultural yield per unit area and unit prices that vary within a fairly narrow range up to some limit characteristic of the products in question, the amount of land operated by any household will determine the value obtained from their agricultural investments. Intensification requires households to change their behaviour, e.g., adopting new technology that promises higher yields per unit area but this often entails additional investment of labour, cash, credit, etc., and it is the net return on that investment that may influence farmers’ decisions to a greater extent than yield per se (Lee, Reference Lee2005). Consequently, the fact of agricultural intensification is defined in this paper as an increase in net agricultural income.
A survey of the literature (Harris and Orr, Reference Harris and Orr2014) found that a wide range of improved cropping technologies offered substantial percentage increases in net returns over farmers’ practices or control treatments based on farmers’ practices, with increases ranging from 20% to more than 3000% (the latter from a very small base value), with a mean increase of 200%. However, they also noted a restricted range of values of net returns resulting from use of improved technologies, from $121 to $1734/ha/season, and values above $1000/ha/season were uncommon and often associated with special circumstances or situations. The median net return for all improved technologies was only $558/ha/season.
These cropping returns per hectare are generally comparable to returns to land achieved on large farms in the developed world (e.g., USDA, 2009). However, when viewed in the context of the widespread incidence of small farms and, in the absence of irrigation, only one cropping season per year in much of sub-Saharan Africa (SSA), such returns can result in only quite small contributions of crop production to the incomes of rural households with limited land. The analysis of Harris and Orr (Reference Harris and Orr2014) considered only net benefits from crop production but smallholder farmers do not only grow crops. Livestock are also a major source of sustenance and income and, since their profitability can also be expressed per unit area (although calculations are more difficult for situations where livestock are dependent to some extent on common land or where feedstock produced on someone else's land is purchased), the value gained from livestock should be taken into account when considering the total agricultural contribution to household livelihoods.
There is growing awareness that, in a world where most farms are very small, with around 475 million (84%) smaller than 2 ha and more than 410 million less than 1 ha in size (Lowder et al., Reference Lowder, Skoet and Raney2016) very few smallholder households are surviving solely on the output from their farms (Barrett et al., Reference Barrett, Reardon and Webb2001; DFID, 2015; HLPE, 2013; Sumberg et al., Reference Sumberg, Gilbert and Blackie2004). For most farming families, agriculture is only one of several sources of income and smaller households often have higher shares of non-agricultural incomes than larger ones (HLPE, 2013). This is important because, where non-farm opportunities are available to households, intensification and its contributing technologies must compete for investment not only with the farmers’ existing agricultural practices but with other economic options. In this context of diverse livelihoods with multiple income streams, it is relevant to question whether or not SI is high on the list of priorities for rural households – and examine possible reasons why they might not be keen to intensify their agriculture.
Harris and Orr (Reference Harris and Orr2014) used a simple equation to describe the relationship between farm income, farm size, household size, net returns per hectare per season and the number of cropping seasons per year. By applying a slight modification of that equation and using data from nearly 12,000 households in 15 countries across SSA, this paper develops a simple yet robust index to characterize rural households (and communities) with respect to how much they can benefit from intensification if it occurs. This measure – the intensification benefit index (IBI) – should serve to define the size of the problem that faces researchers and development practitioners and should be a valuable tool for planners in choosing policies, and perhaps sites, for development activities. In addition, actual net returns and hence farm incomes achieved by 480 rural households in Zimbabwe, Malawi and Mozambique are compared with their IBI values to illustrate the gap between potential intensification and current smallholder farm performance.
METHODS
Harris and Orr (Reference Harris and Orr2014) were able to relate the performance of agricultural technologies to the value obtained by individuals in households with particular farm sizes. In this paper, equation (1) of Harris and Orr (Reference Harris and Orr2014) was re-cast slightly as
 $$\begin{equation*}
PDI = \left( {FS \times R} \right)/\left( {N \times 365} \right)
\end{equation*}$$
$$\begin{equation*}
PDI = \left( {FS \times R} \right)/\left( {N \times 365} \right)
\end{equation*}$$
where
PDI = personal daily income ($/person/day)
FS = farm size (ha)
R = return from agriculture ($/ha/year)
N = number of persons in the household
Thus, for any farm size and household size, the PDI of a household member can be calculated for any given return to land. If PDI is then plotted against R, a straight line results, the gradient of which is the IBI and is a measure of how much individuals in any household benefit from increases in returns to land, i.e., when intensification ‘happens,’ and is expressed here in cents (per person per day) per dollar (per hectare per year). It is important to note that, as a ratio calculated within a site, IBI is independent of differences between sites or between countries and is unaffected by differences in cost of living or exchange rates because investment and returns are both expressed in the same currency. Since IBI is the ratio of PDI divided by returns to land and is constant, it is also independent of prices of inputs and outputs which are drivers of returns to land.
Note also that how intensification is achieved is irrelevant – IBI reflects only to what extent the household benefits if intensification is brought about by whatever means. Individual household IBI values can be averaged or otherwise statistically represented to reflect how communities, landscapes, etc. will benefit if intensification occurs.
Harris and Orr (Reference Harris and Orr2014) modelled farm size and net return from agriculture in relation to a PDI of $1.25/person/day, reflecting the then-accepted international ‘poverty line’ based on 2005 purchasing power parity (PPP) values. Recently, the World Bank has re-appraised this value and raised the threshold to $1.90/person/day based on new data and PPP values from 2011 (World Bank, 2015a). A poverty line of $2/person/day is used in this paper.
Data on individual farm size and the number of people in the household were obtained from seven projects (details listed in Table 1) that had implemented surveys in SSA. Although there is some debate about the accuracy and veracity of farm size data collected during surveys (e.g., Carletto et al., Reference Carletto, Savastano and Zezza2013), values as reported are used here because additional triangulation was not possible. In all, IBI values were calculated for 11,789 households in 15 countries. A sub-set of the data comprising 160 rural households each from Nkayi (Zimbabwe), Mzimba (Malawi) and Changara (Mozambique) also provided measures of actual net farm income that could be compared with their IBI values.
Table 1. Details of sources for data used in this paper.

RESULTS
Summaries of household characteristics are listed, together with median and mean values of IBI, for each survey site in Table 2.
Table 2. Sites, surveys used, household characteristics and intensification benefit indices (IBI).

* Please see Table 1 for source of data.
Median farm size varied from only 0.37 ha in Rwanda and 0.4 ha in Limuru (Kenya) to 10 ha in Segou-Cinzana (Mali) and Kaffrine (Senegal). Most farms fell within the 1–2 ha range, with larger median and mean farm size only evident in West Africa. The mean number of people per household varied widely, with the largest households occurring in West Africa and the smallest, generally 4–6 per household, in Eastern- and Southern Africa, although there were several instances (e.g., sites in Ethiopia, Kenya and Mozambique) where mean household size rose above 6.
Mean IBI varied from 0.04 to 0.05 cents/dollar in Borana, Limuru, Kenya, Rwanda, Usambara and Kamuli district to more than 0.2 cents/dollar in Lawra-Jirapa (0.28), Kaffrine (0.23) and Makueni (0.20). Median IBI varied over a narrower range, from 0.03 cents/dollar in DRC, Limuru, Kenya, Usambara and Kamuli district to 0.14 cents/dollar in Segou-Cinzana and Kadoma. Median IBI was less than the mean IBI at all 46 sites, implying that the distribution of IBI was always negatively skewed, i.e., the majority of households had relatively low IBI values.
The frequency distribution of individual household IBI values is shown for all 11,789 households in Figure 1. As suspected, IBI was very negatively skewed. Fifty percent of the households have values less than 0.075 cents/dollar, 70% have less than 0.125 cents/dollar and 90% have less than 0.225 cents/dollar. As an illustration of what that means, individuals in households for which IBI = 0.075 and that are making $1000/ha/year (for example) from agriculture would have a PDI of $0.75 per day; for an IBI of 0.125 cents/dollar the same agricultural income would furnish a PDI of $1.25 per day; and an IBI of 0.225 cents/dollar would yield a PDI of $2.25.
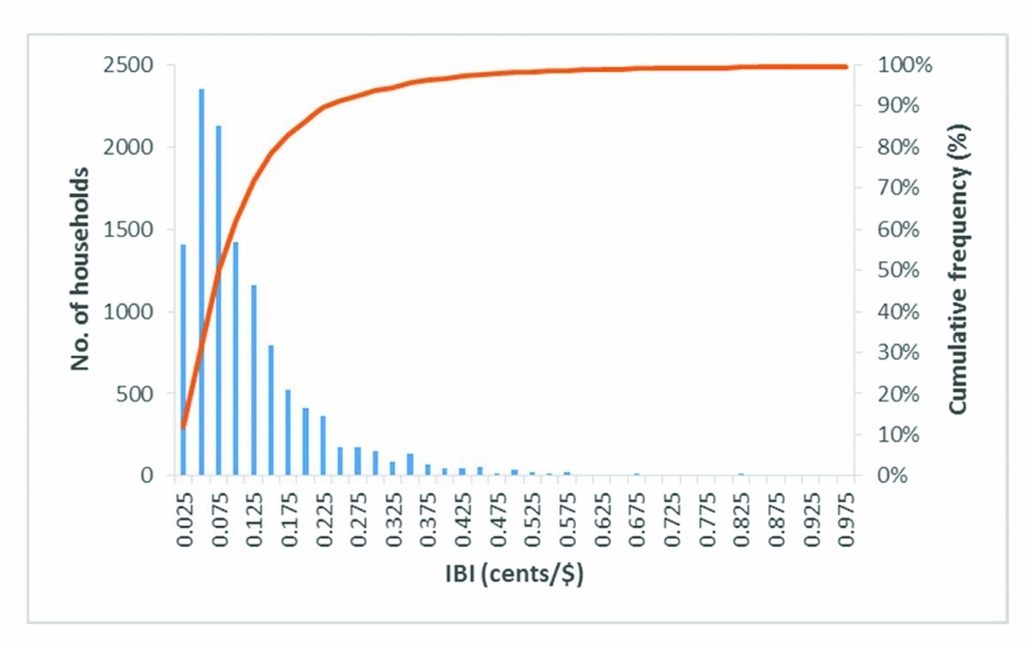
Figure 1. Frequency distribution of household intensity benefit index; N = 11,789 households.
Table 3 shows actual PDI ($/person/day) values for three sites in southern Africa, calculated from net crop and livestock income, and the projected PDI if all households received net returns from agriculture ranging from 500 to 2000 $/ha/year. Actual mean PDI values are low ($0.20–$0.40/person/day) and median values are even lower ($0.08–$0.29/person/day). Values rise as net returns rise but, even with incomes of $2000/ha/year, neither mean nor median values get close to a PDI poverty line set at $2/person/day. With the actual values of PDI at the time of the survey, no household in Nkayi was above that line and only 1.3 and 3.1% of households in Mzimba and Changara, respectively, were above it. With a net return of $2000/ha/year only 25–30% of households would ‘escape’ poverty on the basis of agricultural income – 70–75% would not.
Table 3. Actual net return and personal daily income (PDI, $/person/day) for three sites in southern Africa calculated from net crop and livestock income, and projected PDI if all households received net returns from agriculture ranging from $500 to 2000/ha/year. Also, indicated is the percentage of households exceeding a PDI of $2/person/day at each level of net return.

Mean net return ($/ha/year) from agriculture in survey: Changara $78, Nkayi $83 and Mzimba $424.
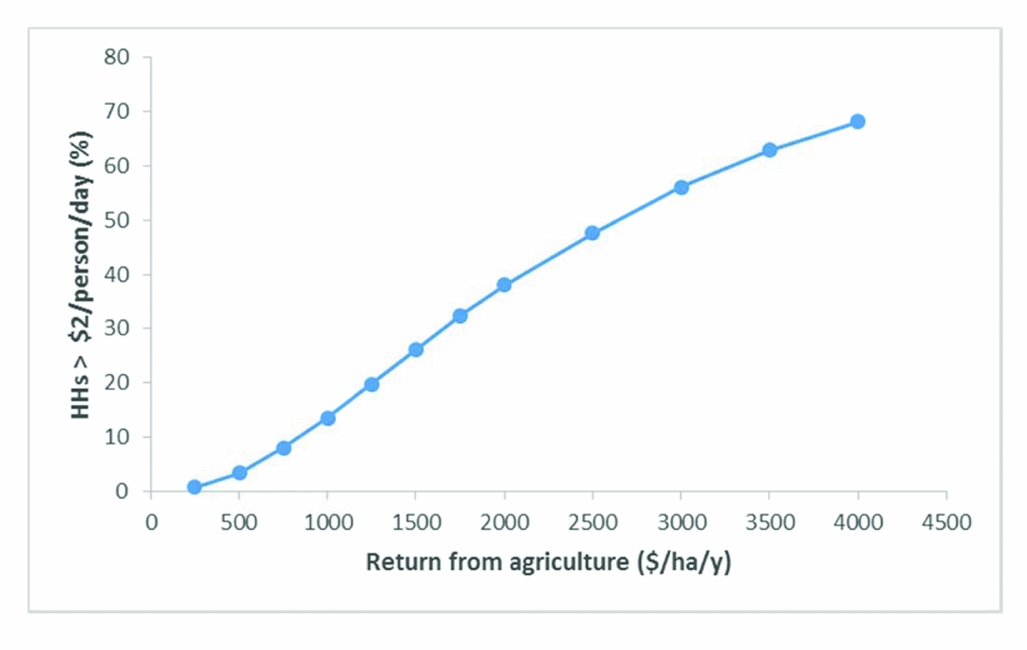
The percentage of all 11,789 households in the combined sample that would exceed a PDI value of $2/person/day, calculated from their IBI values, is plotted as a function of returns from agriculture ($/ha/year) in Figure 2. Returns of $1000/ha/year would result in fewer than 15% of households crossing the poverty line; $2500/ha/year would be required to lift 50% of the sample above the line; and even with $4000/ha/year, more than 30% of households would remain below the line.

Figure 2. The percentage of households whose members would exceed a PDI value of $2/person/day as a function of returns from agriculture ($/ha/year); N = 11,789.
DISCUSSION
The farm sizes of the rural households in this dataset from SSA are consistent with the recent conclusions of Lowder et al. (Reference Lowder, Skoet and Raney2016) in that, in terms of numbers, small farms are the rule rather than the exception. We assume that the data sample used in this analysis is representative of the overall target population for widespread agricultural intensification in developing countries because the survey sites and households were chosen by projects whose principal objective was some form of agricultural development. So, even though the detailed criteria for choosing respondents may have differed between projects, the analysis and conclusions in this paper are likely to be widely applicable to the smallholder sector in general. In fact, none of the variables in the equation for calculating IBI is peculiar to smallholders; IBI is just as relevant to larger farms.
Efforts of agricultural technology developers and promoters to intensify smallholder agriculture are historically based on increasing crop and livestock yields. However, initiatives (technologies, processes, policies, etc.) to achieve these gains are generally not cost-free and require households to invest additional resources and to change behaviour. Investment and behaviour change are more likely if the incentives on offer are attractive and IBI is a measure of one, albeit very important, class of incentive, i.e., the additional monetized value, in absolute terms, to be gained by household members by adopting new practices. By focussing on the benefits to be gained from substitution of new technologies for old ones, Harris and Orr (Reference Harris and Orr2014) argued that net rather than gross returns to land were the most appropriate measures for calculating the value of incentives for adoption, particularly where alternative, perhaps competing, opportunities to generate income (value) were available. However, where no other income streams exist, i.e., where households only farm, gross returns can also be used as inputs for the calculation of IBI, although the promised gains from new technologies would likely underestimate the costs and hence the barriers to adoption.
The IBI concept is based on ‘snapshot’ data from a single year in each of the surveys. Consequently, the ‘current’ values of PDI in Table 3 will vary somewhat from year to year as yields fluctuate. IBI values are calculated using farm size and household size, both of which can also vary over time. In particular, I have ignored the option for households to increase the land area they cultivate. Increasing farm size would increase IBI, and hence the mean PDI and impact on reducing poverty for any given return per hectare per year. However, Harris and Orr (Reference Harris and Orr2014) note that mean return/hectare of technologies, which is often evaluated by researchers on small plots, declines as smallholders implement the technology on increasing areas of land. In any case, there is not much evidence of farm size increasing in SSA, and the reverse is more often the case (Masters et al., Reference Masters, Djurfeldt, De Haan, Hazell, Jayne, Jirström and Reardon2013).
The IBI is a good descriptor of how much members of any household will benefit if returns to land are increased but it is only a useful tool if we know what the current returns are and what are the likely future returns if farmers can be persuaded to adopt new ways of farming. The extent to which a household could benefit, without obtaining additional land, will be determined by the biophysical and economic limits (yield potential and unit price) of the environment. If the absolute value of the difference between the current and future benefits is small (a low value of IBI, i.e., not much gain for a lot of additional effort), then there may not be much of an incentive for a household to invest in new technologies.
Our knowledge of total farm net returns is sparse. The values for three sites in southern Africa shown in Table 3 are a rare example of hard data. Actual PDI values are consistent with mean and median total farm net returns less than $500/ha/year and, according to the IBI approach, increasing farm profitability substantially would not impact poverty strongly at these sites. These conclusions are consistent with the findings of Homann-Kee Tui et al. (Reference Homann-Kee Tui, Valbuena, Masikati, Descheemaeker, Nyamangara, Claessens, Erenstein, van Rooyen and Nkomboni2015) for Nkayi, Zimbabwe. We also do not know in many cases to what extent whole-farm net returns can be increased by the appropriate crop and livestock improvement technologies available for deployment to these households. Would they represent strong incentives for them to invest in new technologies?
Figure 2 shows what sort of returns improved technologies need to generate in order to achieve particular impacts on household incomes. Household IBI values vary substantially within sites (compare means and standard deviations in Table 2) reflecting differences in agricultural resources between households within sites, and the index also varies between sites. Thus, a household (or group of households) with a large IBI will benefit at a greater rate and to a higher degree if intensification, i.e., an increase in net return to land, happens than one with a small IBI. For example, compare the Makueni site in Kenya (community mean IBI = 0.20 cents/dollar) with Kikuyu, also in Kenya (community mean IBI = 0.06). Although we do not know the current returns to land at these sites, a hypothetical intensification initiative that increases the profitability of all households at both sites by, say, $500/ha/year would raise PDI by 100 cents at Makueni but by only 30 cents at Kikuyu. Similar reasoning would explain the differential PDI outcomes within sites between households with high- and low-IBI values. Given the highly negatively skewed distribution of IBI values amongst the large, representative dataset considered in this paper (Figure 1), it is difficult to escape the conclusion that the majority of rural smallholder households in SSA will be unable to escape poverty through agricultural intensification alone. A similar conclusion, following analysis of an even larger dataset in relation to African farm households’ ability to produce sufficient calories from agriculture, was reached recently by Frelat et al. (Reference Frelat, Lopez-Ridaura, Giller, Herrero, Douxchamp, Djurfeldte, Erenstein, Henderson, Kassie, Paulf, Rigolot, Ritzema, Rodriguez, van Asten and van Wijk2016).
As IBI varies, so at least one type of incentive for households to intensify – net value – also varies. Promotion and dissemination of technologies need to be targeted much more closely to household circumstances, including their degree of commercial or subsistence orientation, and the development of farm typologies is currently a common way to facilitate this (e.g.,Tittonell et al., Reference Tittonell, Muriuki, Shepherd, Mugendi, Kaizzi, Okeyo, Verchot, Coe and Vanlauwe2010). The IBI concept, in identifying households for which incentives to intensify their agriculture may not be large enough, particularly where alternative livelihood opportunities exist, adds an additional dimension to the criteria for targeting.
The IBI concept, although quantifying the gains available following adoption of improved agricultural technologies by rural households, i.e., defining this particular type of incentive, tells us nothing about how households decide if any given incentive is attractive or not in relation to available alternatives and in the context of their goals, attitudes and livelihood strategies. To understand that, studies using methods from fields such as behavioural economics, marketing, psychology, communication and other fields that target the understanding of human behaviour and decision making will be required (e.g., Kahneman, Reference Kahneman2011). The potential value of this alternative approach has been noted by funding bodies and should assume greater importance in the future (World Bank, 2015b).
The sustainability of technologies has not been considered here, nor was it evaluated in the literature surveyed by Harris and Orr (Reference Harris and Orr2014). We can infer that some, e.g., use of legumes in rotations (Giller, Reference Giller2001) or perhaps conservation agriculture (Jat et al., Reference Jat, Sahrawat and Kassam2013) will be more environmentally sustainable than others, but it is the net return that determines the immediate benefit to individual households and hence the cumulative direct impact on communities. While there will undoubtedly be indirect benefits from sustainable technologies, such as increased soil organic matter (and consequent higher soil fertility, water-holding capacity and hence higher yields) unless these are immediately apparent to households or are paid for as part of schemes to enhance environmental services such intangibles will be difficult for households to take into account in decision making.
Agricultural researchers are keen on SI because they have invested heavily in the development of improved technologies that are very effective in increasing agricultural productivity. They believe that widespread application of these technologies would achieve the global goals of food security and rural poverty elimination while minimizing the impact on global resources and the environment. In reality, there is a tension between these global goals and the short-term, local needs and aspirations of rural smallholder households in SSA because small farms limit households’ ability to move out of poverty (this paper) or to achieve local food security (Frelat et al., Reference Frelat, Lopez-Ridaura, Giller, Herrero, Douxchamp, Djurfeldte, Erenstein, Henderson, Kassie, Paulf, Rigolot, Ritzema, Rodriguez, van Asten and van Wijk2016). Recently, Hammond et al. (Reference Hammond, van Wijk, Smajgl, Ward, Pagella, Xu, Su, Yi and Harrison2017) reported that only about one-third of rubber farmers in a study in South West China could be classed as keen to innovate and try out new practices. Given the characteristics of smallholder rural households described in this paper, improved technologies, though effective, might not be attractive to them and they may not be particularly keen on SI. We need to find out if they are. What we do if they really are not keen is a question that needs to be debated widely.
CONCLUSIONS
Data on farm size and household size are usually collected as a matter of course during household surveys, so calculating IBI seems to be a feasible, rapid and cost-effective approach to characterizing households and communities with respect to how they could benefit directly from agricultural intensification.
Households and communities differ substantially in this ability, irrespective of what level of intensification they are able to achieve, so caution is required when promoting intensification. Biophysical resources (soil fertility, temperature, rainfall, etc.) will largely determine which crops and livestock may be produced and market access, efficiencies and prices will also influence how profitable they will be. There is potential for new technologies to increase yields and net returns in percentage terms and, if adopted, they could contribute to improved food security and increase the income of many households in SSA to some extent. Figure 2 shows what sort of returns improved technologies should be promising to achieve particular impacts on household incomes. However, on the basis of the large dataset analysed here, it seems unlikely that SI will make a significant contribution to poverty reduction as reflected in the poverty headcount of rural communities of SSA.
The whole-farm net returns from rainfed agricultural production by rural households in SSA, with or without improved technologies, are largely unknown but, as seen in the small number of examples shown in Table 3, are likely to be quite small. Additional, perhaps risky, investment for relatively little reward may not be as attractive to smallholder households as scientists might think. This has negative implications for widespread adoption, particularly where alternative opportunities exist for investment of labour and other resources.
Acknowledgements
I thank all those who generously provided access to the farm- and household size data used in this paper and, in particular, to Sabine Homann-Ke Tui for the data on net farm incomes from Malawi, Mozambique and Zimbabwe. The views expressed in this paper are those of the author and should not be attributed to the institutions with which he is affiliated. This research did not receive any specific grant from funding agencies in the public, commercial or not-for-profit sectors.