


Introduction
Oil palm (Elaeis guineensis Jacq.) is a perennial plant grown in the humid intertropical regions of the world, particularly in Southeast Asia, South America, and Africa. It has the highest yield of all oleaginous crops (Suresh et al., Reference Suresh, Mathur and Behera2016). Data from the USDA (2018) show that global oil palm production was about 73 MT in 2018. Malaysia, Indonesia, and Thailand are the main producing countries and supply around 88% of global production. In Africa, Nigeria and Ghana are the largest producers of oil palm. Benin is a comparatively small producer with a production of 56 KT in 2013. However, oil palm plays an important economic and social role, especially in rural areas in Benin. As in other West African countries such as Cameroon, Ivory Coast, and Ghana, red crude palm oil is extracted in the Beninese farms and processed for sale. This contributes significantly to smallholders’ income (Rafflegeau, Reference Rafflegeau2008). Apart from the extraction of palm oil from fruits, the other parts of the plant are used in various ways to support a parallel rural economy (Fournier et al., Reference Fournier, Muchnik and Requier-Desjardins2002).
Oil palms are cultivated in a range of farming systems from family farms of a few hectares to agro-industrial businesses with several thousands of hectares of plantations worldwide. While most of the worldʼs palm oil is produced by these agro-industrial businesses, production by smallholders is significant. Rival and Levang (Reference Rival and Levang2014) reported that smallholders own about 40% of the area of oil palm plantations in the top oil palm-producing countries. In Benin, the oil palm sector is dominated by smallholder plantations in the south of the country, the most suitable area for oil palm cultivation (Fournier et al., Reference Fournier, Muchnik and Requier-Desjardins2002).
The life cycle of oil palm has two successive phases: an immature phase and a productive phase. The immature phase generally lasts 3 years but could be prolonged by several months when the growth conditions during the immature period are limited (Caliman et al., Reference Caliman, Widodo, Suyanto and Tailliez2002). At the end of this phase, the palms are composed of a short trunk (stipe) about 80 cm diameter surmounted by a crown of leaves. The trunk starts to elongate when it reaches its maximum diameter, attaining its maximum height at around 10 years (Jacquemard and Baudouin, Reference Jacquemard and Baudouin1987).
In Benin, oil palm is often grown in intercropping systems that range from simple association with annual crop successions over the palm immature period to complex systems involving permanent intercropping with various woody and annual species in a spontaneous arrangement resembling natural ecosystems (Yemadje et al., Reference Yemadje, Crane, Mongbo, Saïdou, Azontonde, Kossou and Kuyper2014). This study focuses on the simple and temporary intercropping systems which are commonly found in the southern part of Benin. The farming practices adopted by Beninese farmers on their intercropped palm plantations are diverse, with different crop successions and fertilization regimes. These practices rarely correspond to those recommended by extension services (Aholoukpé et al., Reference Aholoukpé, Vissoh, Amadji, Deleporte, Dubos, Nodichao and Blavet2013). Caliman et al. (Reference Caliman, Widodo, Suyanto and Tailliez2002) and Rafflegeau et al. (Reference Rafflegeau, Michel-Dounias, Tailliez, Ndigui and Papy2010) pointed out that N and K deficiencies in immature palms may cause significant yield declines during the first years of the production phase. Caliman et al. (Reference Caliman, Widodo, Suyanto and Tailliez2002) showed that the growth status of oil palms during the immature phase is a good indicator of fruit yield during the cropping phase. Sparnaaij (Reference Sparnaaij1959) demonstrated that the number of leaves determines the number of fruit bunches as each leaf carries an inflorescence in its axil.
However, there is little information on the effects of the diverse farmers’ technical managements on the soil fertility and growth of oil palms at the end of the immature phase in South Benin. Such question should be approached under real conditions in the farmers’ fields as for instance in Woittiez et al. (Reference Woittiez, Turhina, Deccy, Slingerland, van Noordwijk and Giller2018). In fact, smallholders’ systems are diverse and multiple limiting factors may operate simultaneously. Therefore, working at a research station may introduce bias, limiting the generalization of the results to the farmers’ fields.
Following Rafflegeau et al. (Reference Rafflegeau, Michel-Dounias, Tailliez, Ndigui and Papy2010), a synchronic approach could be used in order to make an agronomic diagnosis and evaluate how young palm performances were impacted by the diversity of intercropping systems developed by the farmers within a region. Such diagnosis would rely on: 1) the identification and grouping of farmers’ fields, to reflect the diverse technical, management, and pedoclimatic factors, and 2) the measurement of a set of indicators of the agrosystem functioning. Indicators such as the mineral concentrations of a selected oil palm leaf, such as leaf 17, could be used to identify nutritional stress and assess its relationship with both the associated crop succession (Rafflegeau et al., Reference Rafflegeau, Michel-Dounias, Tailliez, Ndigui and Papy2010) and the fertilization practices (Caliman et al., Reference Caliman, Widodo, Suyanto and Tailliez2002; Woittiez et al., Reference Woittiez, Turhina, Deccy, Slingerland, van Noordwijk and Giller2018). Moreover, morphometric parameters of the palms, such as the number of leaves, girth circumference, and length of leaf 17 (L17), can be used to characterize the growth of immature oil palms and to assess the relationship between oil palm growth and farming practices (Caliman et al., Reference Caliman, Widodo, Suyanto and Tailliez2002). A vigor index (VI) calculated from easily accessible morphometric parameters was used by De Berchoux and Lecoustre (Reference De Berchoux and Lecoustre1986) and Caliman et al. (Reference Caliman, Widodo, Suyanto and Tailliez2002). This VI was found to be strongly correlated with the total dry biomass of immature oil palms in several experiments conducted in Congo, Côte d’Ivoire, and Benin (De Berchoux and Lecoustre, Reference De Berchoux and Lecoustre1986). Other indices, such as dry matter production rate per unit area and leaf area, could also be used. However, they are less readily accessible and therefore less suited to studies carried out on large field networks than the indicators mentioned above (Corley and Tinker, Reference Corley and Tinker2016, p. 93).
The objective of this study was to evaluate the most common oil palm-based intercropping systems used in the Allada plateau in southern Benin, in terms of nutritional status and growth of the palms at the end of their immature phase. We tested three hypotheses: 1) the nutritional status and growth of palms vary according to the intercropping system that is practiced during the immature phase of the palms, 2) the nutrient concentrations in the leaves of immature palms depend on soil nutrient availability, and 3) the palm root uptake is uniformly distributed across the upper soil layers, up to halfway between two palms.
Materials and Methods
Study area
The study area encompasses the administrative districts of Allada, Zè, and Toffo on the Allada plateau (01°09′N, 02°15′E, 90 m of altitude) in the Atlantique department, southern Benin (see Supplementary Figure S1, available online at https://doi.org/10.1017/S0014479720000022). As the same pedoclimatic conditions prevail within the Allada plateau (Azontondé, Reference Azontondé1991; Azontondé et al., Reference Azontondé, Igue and Dagbenonbakin2009), it is well suited for developing an approach of on-farm agronomic diagnosis of the effects of various farmers’ practices on the crop performance. This area is the second largest oil palm-producing region in the country. The region has a climate with two rainy seasons (April–July and September–November) and two dry seasons (December–March and July–August). The average rainfall is 1200 mm year−1. The average temperature varies from 25 to 29 °C and the relative humidity from 65 to 97% through the year. The dominant soils are weakly desaturated ferrallitic soils called Terres de barre, classified as Rhodic Ferralsols. The soil is formed on the sandy clay sediments of the Continental Terminal.
Characteristics of the immature oil palm intercropping systems in the Allada plateau
The intercropping systems have been presented extensively by Koussihouèdé et al. (Reference Koussihouèdé, Clermont-Dauphin, Aholoukpé, Barthès, Chapuis -Lardy, Jassogne and Amadji2019). All farming operations are manual. The palm plantations are generally established following continuous staple food crops or a 1-year fallow. Farmers do not till the land before planting the palms. The palms are planted in 0.6 m × 0.6 m × 0.6 m holes in staggered rows at a density of 143 to 150 ha−1. The leaves are not pruned during the immature phase of the palms. No organic manure is applied. The harvest residues of the associated crops may be left on the soil. For a 2-year-old plantation of oil palm, with no intercrop species, the Centre de Recherches Agricoles sur les Plantes Pérennes (CRA-PP) recommends a yearly application of 72 kg ha−1 of urea and 72 kg ha−1 of KCl (33 kg N ha−1 and 36 kg K ha−1) on a ring 1 m from the palm (Aholoukpé et al., Reference Aholoukpé, Vissoh, Amadji, Deleporte, Dubos, Nodichao and Blavet2013). Considering the average palm density of 143 ha−1, this corresponds to 0.5 kg urea and 0.5 kg KCl for each palm, each year. However, few farmers apply fertilizer to their oil palms each year as recommended. Moreover, they rarely apply more than two-thirds of the recommended dose for 1 year. In general, the higher the fertilizer application for the associated crops, the lower the fertilizer application for the palms.
Four different types of oil palm intercropping systems were identified, depending on the associated crop successions (Koussihouèdé et al., Reference Koussihouèdé, Clermont-Dauphin, Aholoukpé, Barthès, Chapuis -Lardy, Jassogne and Amadji2019):
Oil palms associated with a succession of annual crops with cassava
The crop succession over the immaturity period of the palms was as follows: a) maize/maize/maize/cassava sequence or b) cowpea/maize/cowpea/cassava sequence. Maize and cowpea typically had 3-month cycles. The soil was not tilled before maize or cowpea sowing, which was done in rows throughout the plot, including under the palm crowns. Urea was applied once to the maize, at a rate of 46 kg N ha−1, while no fertilizers were applied to cowpea and no pesticides were used for these crops. Corncobs were harvested with their husks and the stover was left on the plot after harvest, as well as cowpea residues, which decomposed quickly. Cassava had a 12-month cycle and was planted once or twice in the triennial succession. The field was lightly hoed before cassava plantation, which was done at a density of 15 000 plants ha−1. The cassava plants extended under the oil palm crown at the end of immature period of the palms. No mineral fertilizer or pesticides were used for cassava. The chemical fertilizer specifically dedicated to the oil palms was applied in only two of the first 3 years and supplied about 50 kg N ha−1 and 60 kg K ha−1 in total over the 3-year immature period. The cassava leaves were left on the soil after harvest and decomposed quickly. Cassava was mainly intended for sale in raw or processed forms, such as semolina (gari). The oil palm/cassava system allows farmers to earn income before palm maturity, as other intercropping systems, but with little financial risk. This type of intercropping system was found mainly in the Toffo district.
Oil palm associated with a succession of annual crops dominated by pineapple
The crop succession over the 3-year immature period of the palms was as follows: a) pineapple/maize/maize sequence or b) pineapple/peanut/maize sequence. With a 24-month cycle, pineapple is often planted in the first year. Maize or peanut was grown after the pineapples were harvested. The soil was hoed manually before the pineapples were planted. The pineapple suckers were planted very close to the palms, from about 20 cm, at a density of about 45 000 plants ha−1. Pineapple received a higher level of mineral fertilization than most of the intercropping systems found in the region: about 480 kg N ha−1 and 93 kg K ha−1 applied as urea and 14–23–14 NPK fertilizer in three or four applications over the crop cycle. However, the chemical fertilizer specifically dedicated to the oil palms in this system was generally applied once over the immature period and supply about 25 kg N ha−1 and 30 kg K ha−1 in total over the 3-year immature period. Both fruit and suckers were harvested and sold. Crop residues were removed from the plot because they do not decompose readily. After pineapple harvest, the field was not tilled and no fertilizers were applied during maize and peanut cultivation. Corncobs were harvested with their husks and the stover was left on the plot after harvest, as were also peanut residues. Pineapple is the main cash crop in the region and provides farmers with a high return on investment. This type of association was found mainly in the Zè district.
Oil palm associated with a succession of annual crops dominated by maize
In this system, the crop succession over the 3-year immature period of the palms was as follows: a) maize monocropping or b) maize with cowpea or peanut. Maize typically had a 3-month cycle and was cropped up to six times throughout the 3-year immature period. Cowpeas or peanuts were grown between two maize crops. The soil was not tilled before sowing maize, cowpea, and peanut. The maize was sown in rows throughout the plot, including under the palm crowns, at a density of 50 000 plants ha−1. It was weeded twice over the 3-month crop cycle. About 46 kg N ha−1 was applied as urea once to the maize. The chemical fertilizer specifically dedicated to the oil palms in this system was applied in only two applications supplying 50 kg N ha−1 and 60 kg K ha−1 in total over the 3-year immature period. The corncobs were harvested with their husks, and the stover was left on the plot after harvest. During cowpea and peanut cultivation, the field was not tilled and no fertilizers were applied. The cowpea and the peanut residues were also left on the plot after their harvest. The maize system was found all over the region studied.
Oil palm associated with a succession of annual crops dominated by tomato
In this system, the crop succession over the 3-year period of immature palms was a) tomato monocropping and b) tomato/tomato/tomato/maize/tomato/maize cropping sequence. Tomatoes were intercropped up to four times throughout the palm immature period. One or two maize cycles were integrated into the tomato-based system. The soil was plowed into ridges before transplanting the tomato seedlings from a nursery. Tomatoes were planted over the whole plot, including under the palm crowns, at a density of 50 000 plants ha−1. The tomatoes received 159 kg N ha−1 and 34 kg K ha−1 applied as urea and as NPK fertilizer (14 kg N − 23 kg P −14 kg) in two applications. The oil palms received chemical fertilizers in only one of the first 3 years, at the amounts of 25 kg N ha−1 and 30 kg K ha−1 in total over the 3-year immature period. Only the tomato fruits were harvested. The tomato residues were left on the plot. The soil was not tilled before the maize was sowed. About 46 kg N ha−1 was applied as urea once to the maize. The corncobs were harvested with their husks, and the stover was left on the plot after harvesting. This system was mostly found in the Allada district.
Experimental layout
Four immature oil palm fields were selected to represent each of the four types of temporary agroforestry systems described above. This means that a total of 16 fields were selected for this study. However, one of the maize system fields was discarded due to a sudden change in practices by the farmer, leaving 15 fields constituting the experimental layout. Two plots of 20 palms (4 rows of 5 palms) were considered in each field for measurements and sampling. Therefore, data were collected from 30 plots nested in 15 fields. All these oil palm fields had been established in 2014, and all measurements were made at the end of the 3-year immature phase. As presented in Table 1, the four fields representing each type of agroforestry system were selected based on similarities in fertilizer management practices and cropping history. The data on the technical management of the fields were collected through farmers’ surveys. Therefore, some uncertainties may surround the doses declared by the farmers. This research could not benefit from a comparable dataset taken from a ‘Zero associated crops’ reference plot, since this system did not exist in the farmers’ fields.
Table 1. Technical management of the oil palm fields over the 3-year immature period
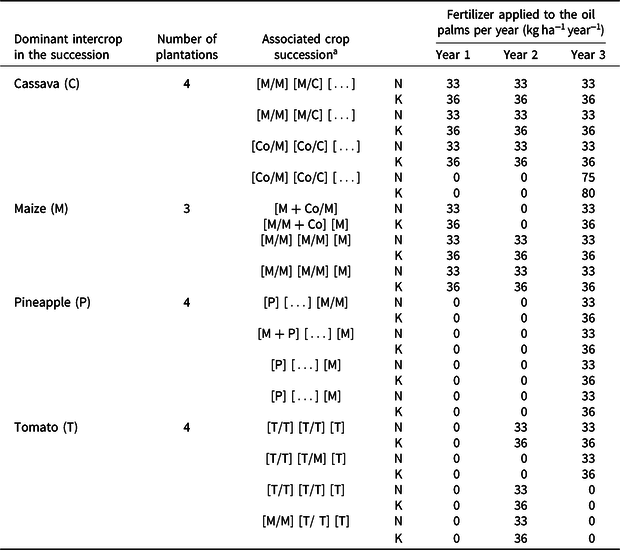
a Co = cowpea; [ ] annual succession; […] continuation of the crop from the previous year;/double cropping; + relay cropping.
Sampling, morphometric measurements and analysis
Leaf 17 N, P, K, Mg, and Ca concentrations
Leaves were sampled during the dry season in December 2017. Six palms were chosen from each of the plots. For each palm, leaf 17 was identified and leaflet samples were collected and grouped by plot. The leaflet samples were prepared following standardized procedures for oil palm leaf analysis (Ochs and Olivin, Reference Ochs and Olivin1975). Following Ochs and Olivin (Reference Ochs and Olivin1975) and Caliman et al. (Reference Caliman, Widodo, Suyanto and Tailliez2002), leaf 17 was preferred to leaf 9 because it was available at the date of sampling. Moreover, data could easily be compared with standard values provided in the literature for leaf 17.
The samples were analyzed to determine the N, P, K, Mg, and Ca concentrations as a percentage of dry matter. The N content was determined by digestion with sulfuric acid and then distillation using the Kjeldahl method. The P content was determined by extraction with ammonium molybdate and colorimetry. The cation contents (K, Mg, and Ca) were determined by combustion, extraction with ammonium acetate, and spectrophotometry. The leaves were analyzed by the Soil, Water, and Environmental Science Laboratory of the Institut National de Recherches Agricoles du Benin (LSSEE/INRAB). The optimum N, P, K, Mg, and Ca concentration ranges for oil palms under 6 years old (Von Uexküll and Fairhurst, Reference Von Uexküll and Fairhurst1991) were used to interpret the results. In addition, the leaf P concentrations were compared to the critical P threshold calculated using the equation (Ollagnier and Ochs, Reference Ollagnier and Ochs1981):
 $${\rm{P}} = 0.0487\ {\rm{N}} + 0.039$$
where P and N are the concentrations in % of dry matter.
Growth indicators
The morphometric parameters were measured between November and December 2017 for the oil palms sampled for the leaf analyses. The total length of leaf 17 (L17), the number of green leaves (NGL), and the VI were used as growth indicators for the oil palms. The VI was calculated using the formula established by the Institut National pour l’Étude Agronomique du Congo Belge (INEAC, Yangambi) (Caliman et al., Reference Caliman, Widodo, Suyanto and Tailliez2002; De Berchoux and Lecoustre, Reference Caliman, Widodo, Suyanto and Tailliez1986):
 $$VI = {C^2\over 4\pi} \sqrt {{D^2 \over 4} + {H^2}}$$
Where C is the trunkʼs girth circumference (cm) which was measured at the base of the trunk under the oldest fronds’ base, D is the average of two perpendicular diameters of the horizontal projection of the crown, measured at the end of the longest leaves (cm), and H is the height of the end of the highest leaf above the ground (cm).
Soil sampling and analysis
Soil samples were collected using an auger in August 2017. Four soil composite samples, divided into two composites samples per plots, were collected from each of the 15 fields 1 month before applying fertilizer to the oil palms: two samples were taken 1 m from the trunk (usually under the crown) from the 0–10 cm and 10–30 cm soil layers, and two others at 4.5 m from the trunk (half the average distance between two oil palms) from the same depths. The soil samples were dried in the shade at room temperature and then ground and sieved to 2 mm. The samples were analyzed for pH in water (pH H2O), total nitrogen (N), organic carbon (C), available phosphorus (Pav), exchangeable potassium (Kexch), exchangeable calcium (Caexch), and exchangeable magnesium (Mgexch). The pH in water was determined with a soil:water ratio of 1:2.5. The C and N contents were determined by dry combustion using a CHN elemental analyzer (Flash EA1112, Thermo Finnigan, Milan, Italy). The available P was extracted using the Olsen method and assayed by a continuous flow analyzer (AA3 AutoAnalyzer, SEAL Analytical Limited). The exchangeable bases were extracted with a neutral solution of ammonium acetate and assayed by atomic absorption spectrometry (AA220 FS, Varian, Australia). The soil samples were analyzed by the Laboratory of Analytical Resources of the Institut de la Recherche et du Développement (LAMA/IRD), Dakar (Senegal).
The soil N and K budgets related to the crop successions during the immature period of the oil palms
As N and K are by far the two major nutrients taken up by oil palms (Ng, Reference Ng1977), we focused on N and K to calculate a simplified budget over the 3-year immature phase of the palm. This was done by comparing N and K entering the soil through the fertilizers applied on each crop succession, with N and K exported with harvested products. The objective was to estimate the potential competition for the soils indigenous nutrient supply between the crop successions and the palms. A positive budget would indicate that the potential for competition was low, whereas a negative budget would indicate the possibility of competition. Inputs were exclusively represented by the total fertilizer applied to the annual crops over the 3 years. Potential N inputs through symbiotic fixation in systems where legumes were grown were not taken into account. Outputs were only represented by the products exported from the plot. Crop residues returning to soil were not considered as output. For instance, for maize, only the maize grains were considered as exported as most of the stover remained on the ground and were rapidly mineralized. For pineapple and cassava, all the aboveground biomass was exported, because they did not decompose readily. For tomatoes, only the fruits were exported. The losses of nutrients through leaching or runoff were ignored. The pineapple yield was estimated from Chogou et al. (Reference Chogou, Gandonou and Fiogbe2017), and the maize, cassava, and tomato yields were measured and averaged across the oil palm fields. The N and K uptakes by the maize were estimated from Bąk et al. (Reference Bąk, Gaj and Budka2016). The N and K concentration in the dry matter and uptake by the pineapple fruit and residues were estimated from Pegoraro et al. (Reference Pegoraro, de Souza, Maia, da Silva, Medeiros and Sampaio2014). N and K uptakes by cassava were estimated from Howeler et al. (Reference Howeler, Lutaladio and Thomas2013). N and K uptakes by tomatoes were estimated from Beaudet and Tremblay, (Reference Beaudet and Tremblay2006). The total N and K fertilizer left for the palms following the crop succession budget were calculated for each intercropping system as the sum of the nutrients applied as fertilizer under the palms and the nutrients potentially left by the associated crops. When the nutrient budget of the associated crop succession was less than or equal to zero, the total nutrients left for the palm were taken to be the fertilizer applied directly to the palm. These budgets calculations were based on the simplistic assumption that the associated crops have priority for the use of the fertilizer applied specifically to them and the palms have priority for the fertilizer applied specifically to them, that is, under the palm crown.
Statistical analysis
A linear mixed effect model was used to analyze the fixed effects of the ‘cropping system’ (characterized by two closely linked factors: the type of crop succession and the whole fertilizer regime of the intercropped species) and the random effects of ‘sites’ on the nutritional and growth status of immature palms. The R software package lmerTest (Kuznetsova et al. Reference Kuznetsova, Brockhoff and Christensen2017) was used to test the model. The equation of the model was
 $${{\rm{Y}}_{{\rm{ij}}}} = {\beta _0} + {\beta _{{1}}}\left( {{\rm{Cropping \;system}}} \right) + \left( {{\rm{Sit}}{{\rm{e}}_{\rm{i}}}} \right) + {\varepsilon _{{\rm{ij}}}}$$
where the subscripts i and j on the Y indicate that each observation j is nested within cluster (Site) i; β0 is the overall intercept and ε ij the residual error.
The covariance matrix structure was ‘unstructured’ as we have used the default parameters of the package. The intraclass correlation coefficient (ICC) was used to determine the between-sites variability: it was calculated as the ratio of between-sites variance to total variance, then multiplied by 100 to be expressed in percentage. Using the mixed model established in the package lmerTest, adjusted means were computed with the ‘emmeans’ function of the emmeans R package based on default parameters (Lenth, Reference Lenth2018). When the fixed effect was significant (p-value < 0.05), the multcompView R package with default parameters was used for computing the multiple comparisons of the levels of the fixed factor with the Tukeyʼs HSD method (Graves et al. Reference Graves, Piepho, Selzer and Dorai-Raj2019). The R factoextra package (Kassambara and Mundt, Reference Kassambara and Mundt2019) was used for principal component analysis (PCA) to visualize the grouping of the points (plots) within the same cropping system in order to explore the relationships between the leaf 17 N, P, K, Mg, and Ca concentrations and the various cropping systems. Eigenvalues of the covariance matrix, which describe the proportion of total variance attributable to their respective principal components, were used for retaining principal components (PCs). The data were normally distributed hence Pearsonʼs correlation coefficients (r) were calculated between the N, P, K, Mg, and Ca concentrations of leaf 17 and the properties of the soils to analyze the links between the variables. Correlations were considered significant when the p-value was less than 0.05.
Results
The chemical properties of soils in the intercropping systems
The chemical properties in the 0–10 cm soil layer were significantly different between the systems (Table 2): pH H2O was significantly higher in the cassava system than in the pineapple system, and intermediate in the maize and tomato systems. Kexch was three times higher in the maize system (0.28 cmol kg−1) than in the cassava system (0.08 cmol kg−1, p-value < 0.05), with intermediate values for the pineapple and tomato systems. C, N, and Caexch were 30 to 40% higher for the tomato than for the cassava system, and Mgexch 90% was higher with intermediate values for the maize and pineapple systems. Pav was not significantly different between systems as the concentration was very variable for some systems (maize in particular).The C, N, Pav, Kexch, Mgexch, and Caexch concentrations in the 0–10 cm soil layer were generally not significantly dependent on the distance from the trunk (Figure 1). The only significant differences between positions were for Pav which was lower near the palm for the tomato system and Kexch which was lower near the palm for the cassava system (p-value < 0.05). The same effects were observed for the 10–30 cm soil layer (data not shown).
Table 2. Nutrient concentrations of oil palm leaf 17 and soil properties at 0–10 cm depth and 1 m from the trunk, depending on the intercropping system (mean ± standard errors)

Asterisks indicate significance levels at p-value < 0.05 (*), p-value < 0.01 (**), and p-value < 0.001 (***), nonsignificant (ns). ICC = interclass correlation coefficient. Means within a column followed by different letters are significantly different (p-value < 0.05).

Figure 1. Box plot of the soil chemical properties in the 0–10 cm soil layer at 1 and 4.5 m from the palm stipe. Markers in the boxes represented means. Values with different letters are significantly different between positions (n = 30, p-value < 0.05).
Palm leaf nutrient concentrations
The results of the linear mixed effect model analysis showed that the intercropping system had a significant effect (p-value < 0.001) on K, Ca, and Mg concentrations of palm leaf 17 but not on N and P concentrations (Supplementary Table S1). The ICC values were 7.2% for N, 18.4% for P, 17.1% for K, 5.8% for Mg, and 3.1% for Ca, indicating that between-sites variability was highest for P and K. The average K concentration in palm leaves in the maize system was twice that in the pineapple system, with intermediate values for the other systems (Table 2). The average Mg concentrations in palm leaves in the pineapple or cassava were 50% higher than that for the maize system. The tomato system was intermediary. The average Ca concentration for the maize system was 50% higher than that for the tomato system, with intermediate values in the other systems. Figure 2 shows the N, P, K, Ca, and Mg concentrations for each system and the optimum concentration ranges (Von Uexküll and Fairhurst, Reference Von Uexküll and Fairhurst1991). The average N and P concentrations were within the optimum ranges for all systems, and the P concentrations were higher than the critical P thresholds of 0.17% for the cassava and tomato systems and 0.16% for maize and pineapple (Eq 1). The Mg concentrations were within, or just above, the optimum range, and the Ca concentrations were above the optimum range. K nutrient concentrations were the only ones to be well below the optimum ranges (Figure 2).

Figure 2. N, P, K, Mg, and Ca concentrations in oil palm leaf 17 at field level for each intercropping system (n = 30). Red dashed lines show the optimum ranges (Von Uexküll and Fairhurst, Reference Von Uexküll and Fairhurst1991). Blue circles show the critical P thresholds (Eq. 1). Stars in the N, P, and K graphs show outliers.
The first two axes of the PCA built using the nutrient concentrations in leaf 17 explained 62% of the total variance (Figure 3a and 3b). Axis 1 explained 39% of the variance with Mg in opposition to Ca and K. Axis 2 explained 23% of the variance with P strongly correlated with N. The PCA score plot (Figure 3b) showed that K concentrations of leaf 17 were lowest for tomato and pineapple systems and highest for cassava and maize systems. The correlation of each initial variable with the PCA axis is presented in Supplementary Table S2. There were two outliers on axis 2: one with a very high P concentration for the cassava system and the other with very low N and P for the maize system. A PCA without these outliers allowed to increase the total variance explained by the first two axes (69% for axes 1 and 2, 42.7% for axis 1, and 26% for axis 2) but had a similar grouping on axis 1 and similar correlations between variables (not shown).

Figure 3. PCA loadings (a) and PCA scores (b) for the nutrient concentrations in oil palm leaf 17 (first two axes) in each of the two plots per field. The larger points are the centroids for each intercropping system.
Differences in palm growth indicators between the cropping systems
The results of the linear mixed effect model analysis showed that NGL only depended significantly on the intercropping system (p-value < 0.05). The ICC values were 0.1% for NGL, 82.5% for VI, and 85.7% for L17, indicating that between-sites variability was highest for L17. NGL was lower for the pineapple system than for the other systems (see Supplementary Table S1 for model results and Supplementary Table S3 for adjusted means and multiple comparisons).
Relationship between leaf nutrient concentrations and soil nutrient levels
The results from the correlation analysis between the N, PAv, Kexch, Caexch, and Mgexch concentrations in the 0–10 cm soil layer at 1 m from the trunk and the N, P, K, Ca, and Mg concentrations in palm leaf 17 are shown in Supplementary Table S4. The only significant correlation was for K (r = 0.72, p-value < 0.001).
Simplified N and K budget in soil
The nutrient budget related to the crop succession (first line of Table 3) suggested that the soil was enriched in N with any of the crop successions management, whereas the soil was slightly depleted in K with the cassava and maize crop successions and strongly depleted in K with pineapple successions (–324 kg ha−1 for 3 years). Only the tomato succession had a positive K budget (+129 kg ha−1). The total N fertilizer left for the palms (third line of Table 3) was 89 kg N ha−1 for the cassava, 165 kg N ha−1 for the maize, 321 kg N ha−1 for the pineapple, and 792 kg N ha−1 for the tomato systems, while the K fertilizer left for the palms was 25 kg K ha−1 for the cassava, 35 kg K ha−1 for the maize, −294 kg K ha−1 for the pineapple, and 159 kg K ha−1 for the tomato systems. In summary, in the pineapple system, the K fertilizer applied to the palm component was the lowest. Due to the crop successions exportations, the soil indigenous supply was the most depleted in this nutrient.
Table 3. Estimated N and K budgets over 3 years for the associated crops in the intercropping systems

The total N and K budget (row 1) is calculated as the difference between the total inputs corresponding to the fertilizer applied over 3 years for the crop and the total output corresponding to the harvested products.
Fertilizer left for the palm (row 3) is calculated as the sum of the nutrients applied as fertilizer under the palms and the nutrients potentially left by the associated crops.
Discussion
Differences in palm N and P nutrition between the systems
The between-sites variability was globally low (ICC ≤ 50%). This indicated that the farmers’ fields used as experimental sites represented cropping systems correctly. However, high ICC for VI (82.5%) and L17 (85.7%) suggested that some growth parameters could vary markedly among farmerʼs fields, presumably due to specific management practices and variability of seedling phenotype at planting. Akpo (Reference Akpo2013) reported that poor handling of seedlings in nurseries was a major constraint in seed management system among southern Benin smallholders. This author further established that nursery management practices could affect seedling phenotype at planting.
The leaf nutrient concentrations indicated that most oil palm intercropping systems of southern Benin are equivalent and provide adequate N and P nutrition for the palms (Figure 2). This suggested that the frequent applications of urea for the associated crops were sufficient to meet their N requirements and to prevent the development of competition for N between the crops and the palms. Moreover, since legumes such as Vigna unguiculata (cowpea) were included in the maize and cassava systems, their residues could have increased the soil nitrogen levels but we did not measured the N supplied through symbiotic fixation. The calculated N budget confirmed that the risk of N competition between the palms and the associated crops was low in all the intercropping systems studied (Table 3). Taking into account N fixation by the legume would certainly improve this balance, but it is likely that this would not result in higher growth. The association of satisfactory N nutrition with satisfactory P nutrition was consistent with the literature reporting a close linear relationship between N and P levels in immature palms (Caliman et al., Reference Caliman, Daniel and Tailliez1994).
The PCA showed two outliers where P concentration was very high for the cassava system and N and P concentrations were very low for the maize system. It is likely that such extremes resulted from contamination or analytical error. The VI and L17 indicators were not significantly different between the systems. However, NGL was significantly lower for the pineapple systems than for the other systems. The absence of a significant difference between the palm growth parameters (VI and L17) could be explained by the satisfactory levels of N available to the palms. Caliman et al. (Reference Caliman, Widodo, Suyanto and Tailliez2002) have shown that immature oil palm growth is mainly dependent on N nutrition. However, the oil palm growth was significantly lower in the pineapple system even though N was not limiting (Supplementary Table S3).
The highest L17 mean values were about 20 cm lower than those reported by Caliman et al. (Reference Caliman, Widodo, Suyanto and Tailliez2002) in experimental fields. Low NGL could be explained by the fact that southern Benin is not optimal climatically for oil palm, since average rainfall is 1200 mm year−1 when it may reach 3000 mm year−1 in Indonesia (Woittiez et al., Reference Woittiez, Turhina, Deccy, Slingerland, van Noordwijk and Giller2018). Few values for VI are available in the literature for immature oil palms. Caliman et al. (Reference Caliman, Widodo, Suyanto and Tailliez2002) used VI as a variable in PCA to obtain the best explanatory variables for the yields obtained in the first 2 years of harvesting, but they did not report the values of VI. De Berchoux and Lecoustre (Reference De Berchoux and Lecoustre1986) reported very high correlations between VI and growth but did not provide the values either.
The effect of the pineapple crop succession on oil palm K nutrition and growth
The palm leaf K concentration was strongly dependent on the intercropping system, with much lower values in the pineapple system. The relatively low values of palm NGL in this system suggested that K was limiting for the palm growth. The competition for this nutrient exerted by the pineapple crop succession was probably the cause. In fact, both oil palms and pineapples take up large amounts of K (Malézieux and Bartholomew, Reference Malézieux and Bartholomew2003; Teixeira et al., Reference Teixeira, Quaggio, Cantarella and Mellis2011). The simplified K budget for the pineapple crop succession was strongly negative, indicating that the soils’ indigenous supply was depleted by the K exportations of the crop succession. Moreover, the pineapple system had the lowest fertilizer dose specifically dedicated to the palms (Tables 1 and 3). Farmers in this region reduced the fertilizer applications to the oil palms to take advantage of the fertilizer applied to the associated crop: the more fertilizer the associated crop receives, the less the oil palms receive (Koussihouèdé et al., Reference Koussihouèdé, Clermont-Dauphin, Aholoukpé, Barthès, Chapuis -Lardy, Jassogne and Amadji2019). Farmers were right in their decision to integrate the crop succession management in the reasoning of the palm fertilization. However, our results suggested that their fertilizer strategy failed to satisfy both species needs and resulted in interspecific competition for K, as suggested by the low K concentration in the palm leaves and the low level of the palm growth indicator in the pineapple system. The high correlation found between soil Kexch and leaf K concentrations confirmed that higher amount of K taken up by the plant was related to higher availability in the soil. In Cameroon, Rafflegeau et al. (Reference Rafflegeau, Michel-Dounias, Tailliez, Ndigui and Papy2010) also reported a K deficiency in mature oil palm plantations with intercrops during the immature phase, which they attributed to insufficient K fertilizer application. Woittiez et al. (Reference Woittiez, Turhina, Deccy, Slingerland, van Noordwijk and Giller2018) also reported that inadequate fertilization impaired palm growth and yields in mature plantations in Indonesia. Several authors have shown that the nutritional status and growth of palms during their immature phase have a strong effect on the precocity and yields in the production phase (Caliman et al., Reference Caliman, Widodo, Suyanto and Tailliez2002; Rafflegeau et al., Reference Rafflegeau, Michel-Dounias, Tailliez, Ndigui and Papy2010). We should, therefore, expect that the oil palms in the pineapple succession will yield less during the first years of the productive phase than in the other intercropping systems.
The lower the K concentration in the palm leaf, the higher was that of Mg. This is commonly observed for many species including oil palm (Caliman et al., Reference Caliman, Daniel and Tailliez1994; Corley and Tinker, Reference Corley and Tinker2016, p. 361) and was explained by the antagonism between these cations for both their adsorption on the soil exchange complex and their absorption by roots (Corley and Tinker, Reference Corley and Tinker2016, p. 361). Leaf Ca concentrations were high, which might be due to K-Ca antagonism, as K values were particularly low too.
Differences in soil fertility between the intercropping systems at the end of the immature period
The soil fertility at the end of the 3-year palm immature phase was strongly dependent on the intercropping system (Figure 1). The soils under cassava and pineapple systems had the lowest exchangeable K concentration, while the soil under the tomato system had the highest N concentration. These soil analysis data were in concordance with the nutrient budget calculations where the cassava and pineapple systems had the lowest K budget and the tomato system had the highest N budget (first line of Table 3).
Despite applying fertilizer on a 1-m diameter ring around the palms in the cassava system, the soil K concentration was the lowest near the trunk, suggesting that the interspecific competition for K was stronger near the trunk than 4.5 m away (Figure 1). According to Okpala-Jose (Reference Okpala-Jose1995) in Nigeria, it might be possible to reduce such competition by leaving 2.3 m space between the cassava plants and immature palms, instead of only 1 m as generally practiced on the Allada plateau. Except for K in the cassava system and P in the tomato system, the soil nutrient concentrations did not depend on the distance from the trunk (Figure 1). This might mean that by the end of the immature phase of the oil palm, the distribution of oil palm roots, and their uptake of nutrients, was not limited to the 1-m diameter ring around the palm. This interpretation is consistent with the observations of Nodichao et al. (Reference Nodichao, Chopart, Roupsard, Vauclin, Aké and Jourdan2011) in young Beninese plantations in terre de barre. The entire upper horizon of soil being uniformly exploited by the palm roots made interspecific competition possible, as highlighted for the K nutrition of the palms in intercropping with pineapple.
Relationship between profitability of the crop succession and growth of the immature oil palms
The pineapple intercropping system was the one in which the palm leaf K deficiencies were the most marked. It also had the lowest growth rates as indicated by NGL and VI. However, pineapple is a high-value cash crop that provides farmers with high farm incomes and returns on investment (Koussihouèdé et al., Reference Koussihouèdé, Clermont-Dauphin, Aholoukpé, Barthès, Chapuis -Lardy, Jassogne and Amadji2019). The high input and profitable pineapple succession had, therefore, the greatest adverse effect on immature palms. Farmers in this area need to be made aware that the fertilizer applied to the pineapple does not cover the total requirements of the intercropping system. In the tomato succession, which is also a high input and profitable succession, the K budget of the crop succession was highly positive. However, the palms’ K nutrition did not fully reflect an increased K availability (Figure 2). Taking into account that 80% of the K fertilizer left for the young oil palm in this intercropping system might come from the tomatoʼs remaining fertilizer and/or tomato leaf residues (Table 3), it is possible that this relatively low K use efficiency for the palm nutrition might be due to leaching, and/or mismatch between the kinetic of palm demand and that of K turnover through the soil/tomato crops compartments.
Conclusions
The N and P nutrition of the immature oil palms was satisfactory in all the intercropping systems. The palm growth associated with crops successions dominated by maize, cassava, and tomato was higher than that with the pineapple crop succession, where there was a pronounced competition for K between both species. In the intercropping systems with tomato, the palm nutrition and growth did not benefit much from the high positive budget of K related to the management of the successive tomato crops. More research is needed on K fertilizer efficiency and timing of the transfers of nutrients through the soil/palm/crop components during the palm immature period. Changes caused by the various intercropping practices on soil biological functions should be investigated in order to better adapt the fertilizer recommendations for immature palm tree in intercropping.
Acknowledgements
The authors would like to thank the IRD (Institut de Recherche pour le Développement, a French public research organization dedicated to developing countries) for (i) the doctoral fellowship (Allocation de Recherche pour une Thèse au Sud – ARTS) granted to H. Koussihouèdé and (ii) its support for local research in Benin through the JEAI (Jeune Equipe Associée à l’IRD) research and capability-building program. The authors would also like to thank the BNP Paribas Foundation for its support through its Climate Initiative and the SoCa (Beyond climate, Soil C sequestration to sustain family farming in the Tropics) project. The views expressed in this document cannot be taken to reflect the official opinions of this organization. We would also like to thank Issiakou Houssoukpevi for mapping and Valère Salako, Tohoun Romeo and the Laboratoire de Biomathématiques et d’Estimations Forestières for statistical assistance. The soils were analyzed by the Laboratoire des Moyens Analytiques of the Institut de Recherche pour le Développement (LAMA/IRD) in Dakar (Senegal). H. Koussihouèdé would like to thank everyone who helped her during her time at LMI IESOL in Dakar.
Supplementary material
To view supplementary material for this article, please visit https://doi.org/10.1017/S0014479720000022


