INTRODUCTION
The prickly pear (Opuntia ficus-indica (L.) Mill.) is a sustainable crop with low input demand and both the cladodes and the fruits can potentially be used as food for humans and animals, particularly in the world's arid and semiarid regions. The OFI ecological and agricultural success is largely due to its Crassulacean acid metabolism (CAM). This photosynthetic pathway is characterized by a nocturnal stomata opening with CO2 uptake primarily occurring from dusk to dawn, while during the day the stomata are closed. This pattern provides higher water use efficiency and annual dry matter productivity than many C3 and C4 cultivated plants (Nobel, Reference Nobel1988).
The Central Mexico is the OFI domestication centre and the species’ taxonomic concept may include clones derived from multiple lineages and, therefore, be polyphyletic (Griffith, Reference Griffith2004). The species introduction in the Iberian Peninsula probably occurred at the beginning of the 16th century, after the discovery of America, spreading afterwards throughout the Mediterranean basin (Anderson, Reference Anderson2001).
The Mediterranean region, particularly inland areas, has been suffering from severe drought during extensive summers, and global change is expected to deeply affect this area in the near future. Indeed, global and regional model simulations project a warming scenario with dramatic impacts in this region. The precipitation models anticipate a drier climate with a shorter and wetter rainy season, followed by a long dry summer (Schröter et al., Reference Schröter, Cramer, Leemans, Prentice, Araújo, Arnell, Bondeau, Bugmann, Carter, Gracia, de la Vega-Leinert, Erhard, Ewert, Glendining, House, Kankaanpää, Klein, Lavorel, Lindner, Metzger, Meyer, Mitchell, Reginster, Rounsevell, Sabaté, Sitch, Smith, Smith, Smith, Sykes, Thonicke, Thuiller, Tuck, Zaehle and Zierl2005). The prickly pear morpho-physiological characteristics and multiple economic uses represent an alternative crop in this region. The fruit has nutritional and economical value and also represents an interesting crop for small ruminants feeding, by providing energy, water and minerals during periods when food and water are scarce (Andrade-Montemayor et al., Reference Andrade-Montemayor, Cordova-Torres, García-Gasca and Kawas2011; Rodrigues et al., Reference Rodrigues, Pitacas, Reis and Blasco-Ruiz2016). Additionally, OFI is used to produce natural dyes (Anderson, Reference Anderson2001), as a medicinal plant (Lim, Reference Lim2012) and the cladodes physicochemical characteristics are suitable for biogas production (Jigar et al., Reference Jigar, Sulaiman, Asfaw and Bairu2011).
In the Mediterranean area, such as Portugal, the OFI is found on roadsides and paths due to its typical ruderal behaviour, and both species forms, Opuntia ficus-indica f. ficus indica and Opuntia ficus-indica f. amyclaea (Ten.) Schelle, can be found. In Portugal, cactus pear is a naturalized species (Inglese et al., Reference Inglese, Barbera, Gugliuzza, Liguori, Barrera and Smith2009) and it is cultivated for edible fruit production and hedges establishment. The local ecotypes have variability in the plant vigour, the shape of the cladodes, the presence or absence of spines, the spine length, the corolla colour, the pulp colour and the fruit ripening time (unpublished results).
The large stems (cladodes) are the main photosynthetic organs in OFI. The light interception, the CO2 uptake and, ultimately, the OFI productivity depend on the stem area index (both sides of the cladode surface per ground area), which is the equivalent to the leaf area index (Nobel, Reference Nobel1988). The genotypes with faster photosynthetic area growth have higher light interception capacity and, therefore, higher potential and earlier capacity for fruit production (Caloggero and Parera, Reference Caloggero and Parera2004). Some authors computed the photosynthetic area by establishing a linear relationship between the cladode area and the maximum length and width (Caloggero and Parera, Reference Caloggero and Parera2004; Sáiz and Fernandez, Reference Sáiz and Fernández1990; Tiznado-Hernandez et al., Reference Tiznado-Hernández, Fortiz-Hernández, Ojeda-Contreras and Rodríguez-Félix2010). The cladode fresh weight (FW) was estimated using the linear relationship between the FW and the product of the cladode maximum length by its width and mean thickness (Pinto et al., Reference Pinto, Menezes, Sampaio, Andrade, Filho, Silva, Andrade and Figueiredo2002). To the best of our knowledge, few studies to estimate the biomass production by non-destructive methods have been reported to date on this species for the Mediterranean region. To estimate the dry weight (DW) two studies obtained linear regression models that relate the cladode DW with the product of the cladode maximum length by its width and diameter of the neck (Curt et al., Reference Curt, Sánchez, Sánchez, Aguado, Uceda, Zaragoza, Agüera and Fernández2011; Sáiz and Fernández, Reference Sáiz and Fernández1990) for this crop in Spain. The morphology and potential biomass production of the Portuguese Opuntia germplasm is unknown. Using 16 OFI Portuguese ecotypes established in a common garden situated in inland Portugal, the objectives of the study were: (1) to establish a non-destructive method to estimate biomass production, (2) to estimate the plant vigour and the biomass production variability among and within populations and (3) to find populations with biomass production at least similar to the improved varieties established in the common garden for comparison purposes.
MATERIAL AND METHODS
Plant material and experimental design
A mission to collect Portuguese OFI germplasm took place in the early spring of 2012. The cladodes were sampled from 15 individuals in 16 different ecotypes/populations, encompassing various altitudinal levels (Table 1). They were located in the Central and Southern regions of inland Portugal, and one in the Madeira Island (Table 1). Two improved Italian cultivars (cv.), ‘Bianca’ and ‘Gialla’, were included for comparison purposes, OFI-06B and OFI-07G respectively. The mature cladodes were single-planted during May 2012 at the School of Agriculture in Castelo Branco, Portugal (39º49'17''N; 7º27'41''W, elevation 365 m). The plant spacing was 1.5 × 2.5 m (2667 plants ha−1). The experimental design was a randomized complete block design for the 18 populations, with three replicates and five plants each replicate – the elementary plot, 2.5 × 1.5 × 5 = 18.75 m2. In the experiment borders rows were planted to eliminate side effects. The provenance trial was planted in a granitic soil, with pH 5.9 and low organic matter content; a marginal soil with reduced overall soil profile depth and low water holding capacity. Fertilizers with nitrogen, phosphorus and potassium were applied, 40 kg ha−1 each element, to reduce possible differences in soil fertility, but no irrigation or tillage was used. The weeds were controlled by mechanical mowing.
Table 1. Identification and origin of the studied O. ficus-indica populations.

B – cv. ‘Bianca’; G – cv. ‘Gialla’.
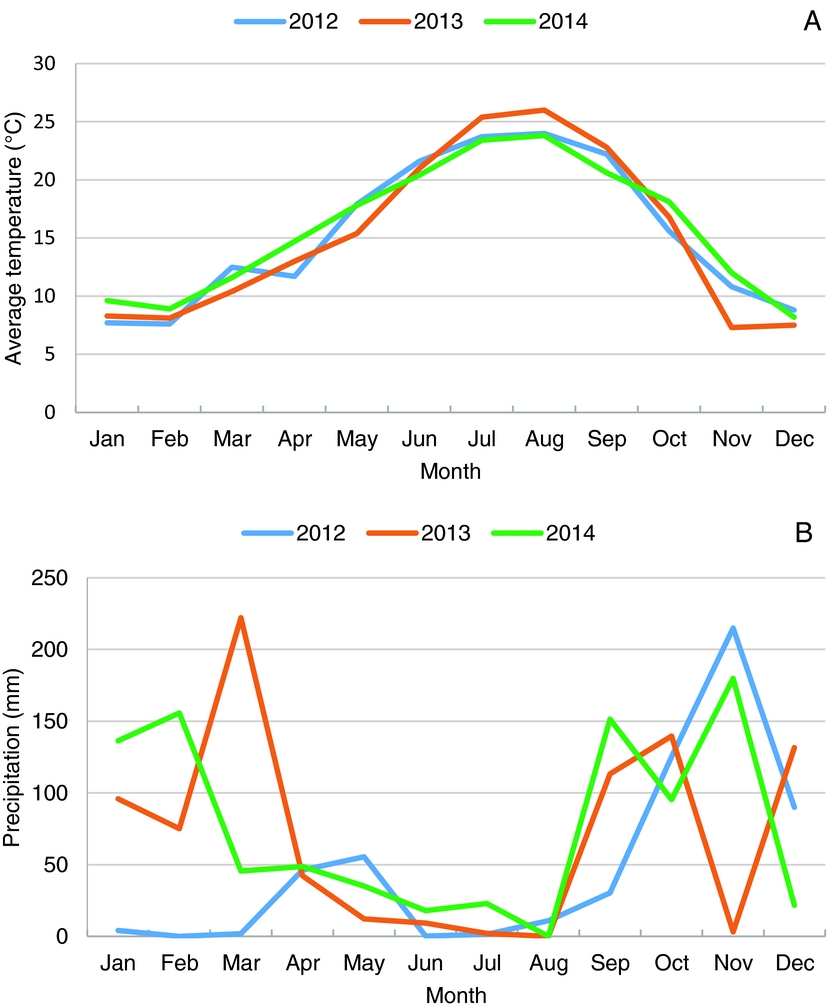
The Köppen–Geiger climate classification for Castelo Branco is Csa. The average annual temperature was 15.4 °C (Figure 1) during the period of the experiment (2012–2014). The driest and hottest months were July and August with average temperatures above 24 ºC and absolute values reaching 41 ºC. The coldest months were December, January and February, with average temperatures below 10 ºC. The mean number of days with temperature equal or below 0 °C was 19, ranging between 0 °C and −5.2 ºC. In winter the rainfall was much higher than in summer – typical for Mediterranean climate – with the highest precipitation in October and November (Figure 1.). The vegetative growth of OFI occurred during the time of the year when the precipitation was lower.

Figure 1. Average temperatures (A) and accumulated precipitation (B), in the region of Castelo Branco, for the 3-years period, 2012–2014.
Model construction and evaluation
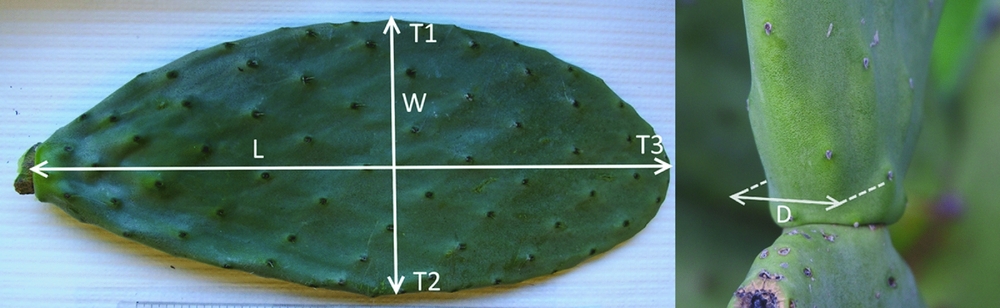
In March 2014, 60 cladodes (ca. three per population) aged from 1- to 2-years-old, were sampled in plants from all the 18 populations established in the experimental field. Besides the cladodes scanned images, the area (A, cm2), the FW (g) and the DW (g) were recorded. The following biometric parameters were measured in each cladode: the length (L, cm), the width (W, cm), the mean thickness (T, cm) and the diameter of the neck (D, cm). The length and the width were measured using a graduated ruler. The average thickness per cladode was computed using three measurements of the cladode thickness, at the apex and on both sides at the maximum width point, using a digital caliper (T1, T2 and T3 in Figure 2). The neck diameter (D) was also determined with a digital caliper (Figure 2). The cladode area (CA, cm2) was quantified using two methods, the image analysis based on the software Image J v.1.49b (Rasband, U. S. National Institutes of Health, Bethesda, Maryland, USA), and the cladode weight paper silhouettes, according to Garcia de Cortázar and Nobel (Reference Garcia de Cortázar and Nobel1992). The FW was measured with a precision scale. Afterwards, each one of the 60 cladodes was fragmented and dried (65 ºC for 72 h) to obtain the respective DW.

Figure 2. Biometric parameters measured in the O. ficus-indica cladodes. L - Length; W - Width; T - Mean thickness (obtained from the arithmetic mean of points T1, T2 and T3); D - Diameter of the neck.
The relationship among the cladode area (CA, cm2), the FW (g), the DW (g) and the potential regressor variables, ‘X’ as D, L, T and W, were analysed both graphically and statistically in order to develop predictive models for the biomass production estimation by means of non-destructive methods. We tested 5, 18 and 7 candidate models, for each of the response variable ‘Y’, CA, FW and DW, respectively (detailed in supplementary material Table S1). The linear regression model assumptions were verified, including linear relationship between the variables Y and X, homoscedasticity (equal error variances), normality and independence of errors. The first three assumptions were both graphically and statistically validated. The Durbin–Watson test for autocorrelation was selected to validate the fourth assumption, the errors independence, by assuming a first-order autoregressive error model, which is consistent to the time series dataset. The model selection and validation was based on the fitting and the prediction ability of those candidate models by using the coefficient of determination (R 2) and the root mean square error (RMSE) to assess the criteria quality and the estimates precision, respectively (Montgomery et al., Reference Montgomery, Peck and Vining2012).
Germplasm evaluation
In April 2013 (330 days after plantation, DAP) and March 2014 (660 DAP) the cladode number per plant (CNp) was recorded in the 15 individuals from each one of the 18 populations (16 ecotypes plus the cultivars ‘Gialla’ and ‘Bianca’). The length, the maximum width, the mean thickness and the neck diameter were measured in all the cladodes of the 15 individuals per population, according the procedures outlined in the previous section. For the biomass production assessment the Cladodes Area (CAp, m2), the FWp (kg) and the DWp (kg), were estimated using regression models.
The selected linear models were used to estimate the studied ecotypes’ biomass. After fitting the models, the Shapiro–Wilk test for normality and the Levene's test of equality of variances were applied. The data were subsequently analysed using the one-way ANOVA, followed by pairwise comparisons using either the Tukey or the Games-Howell (in the absence of homoscedasticity) post hoc tests. With an absence of normality of the distributions, the non-parametric Kruskal–Wallis test was used to compare the means, followed by pairwise comparisons using Dunn's procedure with a Bonferroni correction for multiple comparisons. The statistical significance was accepted with a probability of type I error of 5%, for both the omnibus test and the multiple comparisons. The statistical analyses were performed using the IBM SPSS Statistics software v.21 (IBM Corp., NY.).
RESULTS
Characterization of the supporting database and model selection
The summary statistics of the 60 cladodes used to develop the linear models and to estimate the cladode area and the FW are shown in Table 2. Since no significant differences were found between the two methods used to estimate the area of the cladodes, the image analysis and the weight of the cladodes paper silhouette, t (118 df) = 0.076, p = 0.94, we have chosen the former, because it is easier and faster to use than the paper silhouette method.
Table 2. Summary characteristics recorded in the O. ficus-indica cladodes used to develop the linear models (n = 60 obs.).

SD – standard deviation; CV (%) – coefficient of variation; Min – minimum; Max – maximum.
The three models for each dependent variable (CA, FW and DW, in Table 3) were selected from the candidate models (described in Table S1) based on the evaluation statistics for the quality of the fit and the predictive performance detailed in the Material and Methods section.
Table 3. List of the selected equations to predict the CA, FW and DW in O. ficus-indica. Coefficients, standard errors and root mean square errors (RMSE) of linear regression models.

CA - area of the cladode, one face (cm2); FW – cladode fresh weight (g); DW – cladode dry weight (g); D – diameter of the neck (cm); L – cladode length (cm); T – cladode average thickness (cm) and W – cladode maximum width (cm). * Model numbering in the S1 table.
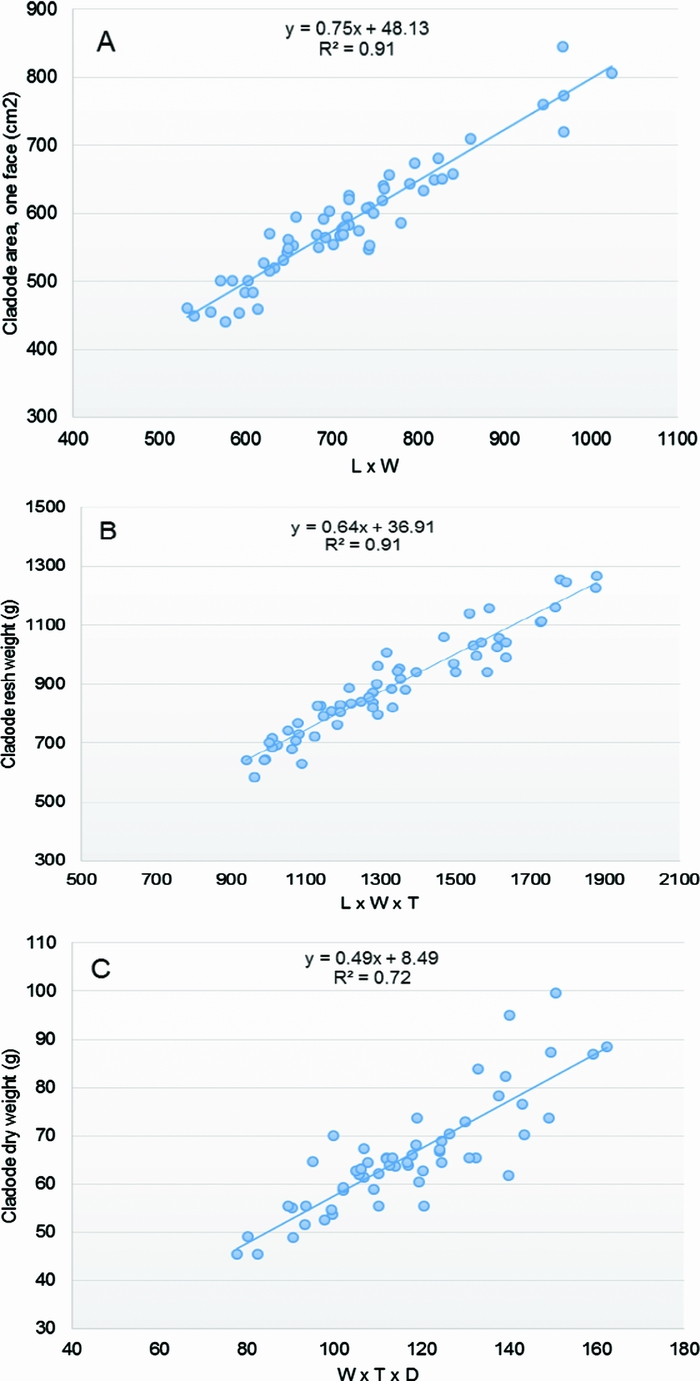
The graphical and the statistical analyses of the response variables and the available potential regressors (interactions between the X’s variables and transformations of the original variables) indicated that the interaction variables L × W and L × W × T were good predictors of the cladode area (Figure 3A) and the FW (Figure 3B), respectively. The assumptions of linearity, independence of errors, homoscedasticity, outliers and normality of the residuals were met. The linear regression established that the product L × W could predict the cladode area (CA, one face, cm2), F (1 df, 58 df) = 565.03, p < 0.05, and the product L × W × T could predict the cladode FW (g), F (1 df, 58 df) = 588.52, p < 0.05. The highest R2 was 0.91 for both the CA and FW estimation models (Table 3, equations 1 and 2, respectively), meaning that 91% of CA and FW observed variation was explained by the models. Also, both models displayed the lowest RMSE values (26.68 and 52.26, respectively) compared to the other assayed models’ values (Table S1).

Figure 3. Scatter plots and lines of the three chosen allometric equations to estimate: (A) the cladode area CA = 48.13 + 0.75 (L × W), (B) the fresh weight FW = 36.91 + 0.64 (L × W × T), and (C) the dry weight DW = 8.49 + 0.49 (W × T × D). The length (L), width (W) thickness (T) of the cladode and diameter of the neck (D) were the predictor variables used.
In the case of the DW, the product W × T × D could predict the cladode DW (g), F (1 df, 56 df) = 146.12, p < 0.05 (Figure 3C). Considering the DW estimation model, the highest coefficient of determination was 0.72, the RMSE value 6.05 and 72.3% of the observed variation was explained by equation 3 (Table 3).
Biomass production assessment
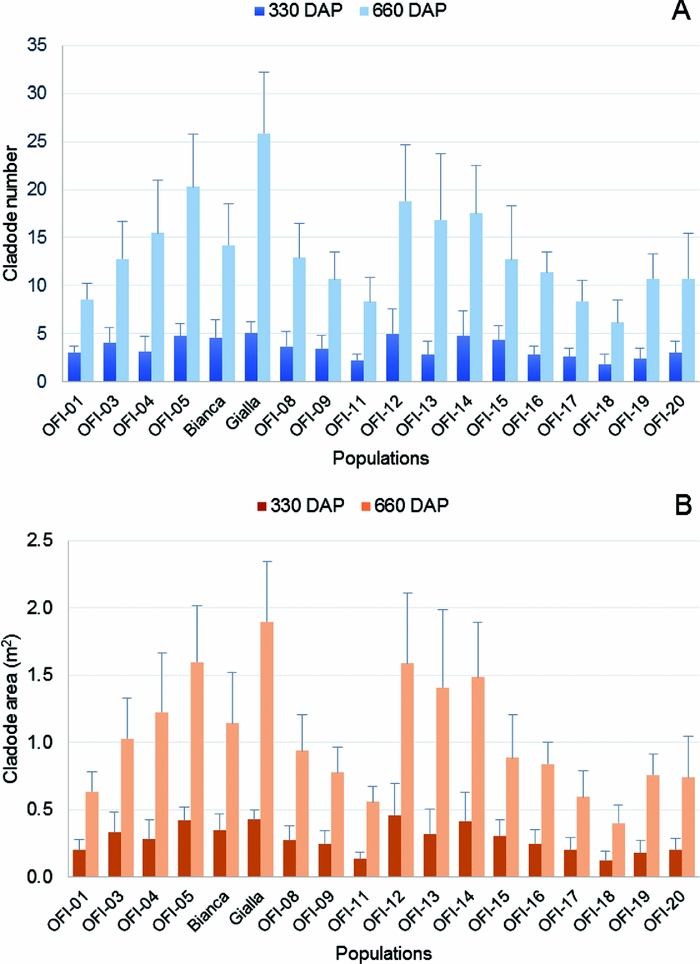
The number of cladodes per plant was recorded 330 and 660 DAP (year 1 and year 2, respectively), and the non-destructive biomass quantification of 18 populations was estimated using the selected equations (Table 3). The population with the highest number of cladodes per plant was cv. ‘Gialla’ with 5.1 and 25.9 cladodes in year 1 and 2, respectively, and the ecotype OFI-18 had the lowest value, i.e. 1.9 and 6.2 cladodes in year 1 and 2 respectively (Figure 4A). Considering all the 18 populations, the mean was 3.5 cladodes per plant in year 1 and this value increased more than 3.5-fold in year 2 (mean 13.5 cladodes per plant). The number of cladodes per plant was not normality distributed (all populations) according to the Shapiro–Wilk test, hence the nonparametric Kruskal–Wallis test was used to test for differences among populations. This test showed significant differences in the number of cladodes per plant among the 18 OFI populations in year 1 (χ2 (17) = 89.85, p < 0.05, n = 270) and in year 2 (χ2 (17) = 148.09, p < 0.05, n = 270). The pairwise comparisons revealed five and four homogeneous groups in year 1 and 2, respectively. Thus, statistically significant differences in the number of cladodes among some of the populations can be inferred, e.g. OFI-7 from OFI-18 (Figure S1).

Figure 4. Average number of cladodes per plant (CNp) (A) and average cladode area per plant (CAp) (B) in the 18 populations of O. ficus-indica studied, 330 and 660 days after plantation (n = 15 plants per population). The CAp values were estimated with the allometric equation: CA = 48.13 + 0.75 (L × W).
Considering the CA per plant, both faces, the highest values were 0.46 m2 in the ecotype OFI-12 (year 1) and 1.90 m2 in the cv. ‘Gialla’ (year 2). The lowest value was observed in the ecotype OFI-18, with 0.12 m2 and 0.40 m2 in year 1 and 2 respectively (Figure 4B). The mean value for the area of cladodes per plant increased ca. 3.5-fold from year 1 (0.29 m2) to year 2 (1.03 m2).
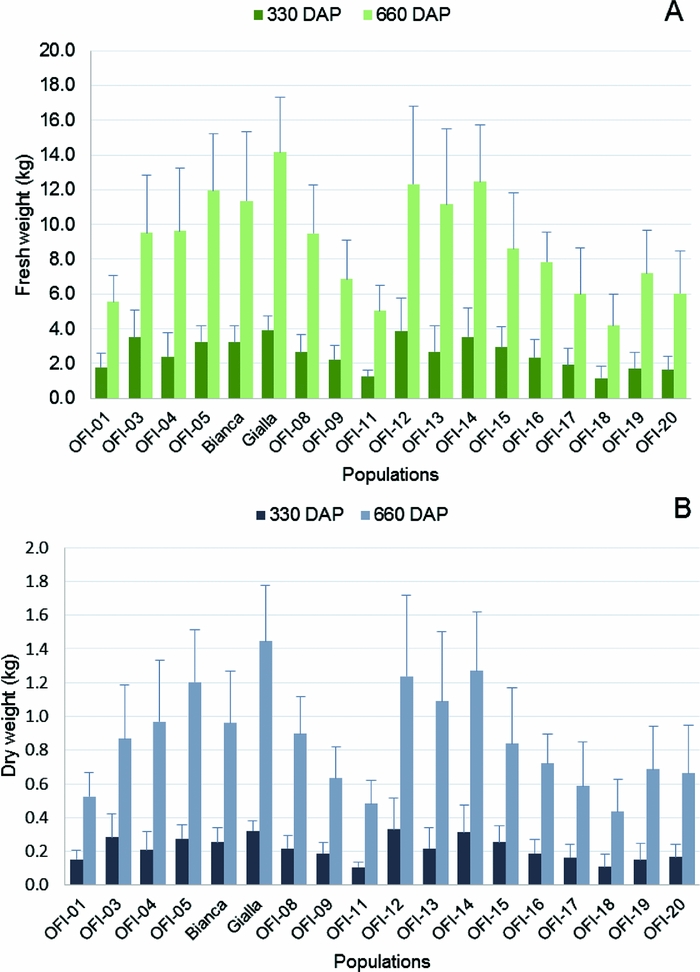
The ‘Gialla’ cultivar also displayed the highest FW per plant in both years (3.94 kg and 14.16 kg, year 1 and 2, respectively) and the lowest values were found again in the OFI-18 ecotype (1.16 to 4.19 kg, year 1 and 2, respectively) (Figure 5A). The mean FWp values for all the populations increased ca. 3.5-fold from year 1 (2.56 kg) to year 2 (8.84 kg).

Figure 5. Average fresh weight per plant (FWp) (A) and average dry weight per plant (DWp) (B) in the 18 populations of O. ficus-indica studied, 330 and 660 days after plantation (n = 15 plants per population). The FWp and DWp values were estimated with the allometric equations: FW = 36.91 + 0.64 (L × W × T) and DW = 8.49 + 0.49 (W × T × D), respectively.
The highest DW values per plant were found in OFI-12 (0.33 kg) in year 1 and in cv. ‘Gialla’ (1.45 kg) in year 2. The lowest DW values per plant were observed in ecotype OFI-18 (0.11 kg and 0.43 kg, year 1 and year 2, respectively) (Figure 5B). The mean DWp values also increased around 4-fold from year 1 (0.22 kg) to year 2 (0.86 kg).
The normality tests, the standardized skewness and the Shapiro–Wilk test, for variables cladode area, FW and DW per plant indicated that the data were normally distributed. The Levene's F test revealed lack of homogeneity of variances (p < 0.05), thus the Welch's F test was used. The one-way ANOVA revealed the existence of significant differences among the 18 populations for the three variables (CAp, FWp and DWp) (Table 4). The Games–Howell post hoc test showed significant differences among the OFI populations, and the group including the cv. ‘Gialla’ plus the OFI-05, OFI-12, OFI-13 and OFI-14 ecotypes produced higher photosynthetic area than the remaining populations (Table S2). In the case of both the fresh and DW per plant, the Games–Howell post hoc tests revealed significant differences among the OFI populations and it could be conclude that the group constituted by the two improved cultivars. (Gialla and Bianca), and the ecotypes OFI-04, OFI-05, OFI-12, OFI-13 and OFI-14 outperformed the remaining populations concerning the fresh and DW per plant (Tables S3 and S4). From year 1 to 2, the number of cladodes per plant, the photosynthetic area, the FW and the DW per plant increased, on average, in a ratio superior to 3.5.
Table 4. Welch's ANOVA statistic for the area of cladodes (CAp, m2), fresh weight (FWp, kg) and dry weight (DWp, kg) per plant. Sig. = significance.
A one-way ANOVA was made for the 10 populations with higher biomass production in year 2 (OFI-03, OFI-04, OFI-05, OFI-08, OFI-12, OFI-13, OFI-14, OFI-15, cv. ‘Bianca’ and cv. ‘Gialla’), and significant differences were found for the variables CNp, CAp, FWp, DWp (Table 5). The Tukey's multiple comparisons of means produced six, eight, three and five homogeneous groups for the number of cladodes, area of cladodes, FW and DW per plant respectively (Table 6). The ecotype OFI-05 did not differ from the cv. ‘Gialla’ with respect to the number of cladodes per plant. The ecotypes OFI-05, OFI-12 OFI-13 and OFI-14 were not significantly different from the cv. ‘Gialla’ for the variables CAp, FWp and DWp. Those four ecotypes have few spines, the cladode shape is ovate and the petal colour is yellow, similar to the cv. ‘Gialla’.
Table 5. ANOVA results (α = 0.05) for the 10 populations of O. ficus-indica with the higher biomass production 660 days after plantation (year 2) (n =15 plants per population).

Table 6. Mean values and standard deviation for cladode number, area of cladodes, fresh weight and dry weight per plant in the group with 10 populations of O. ficus-indica with higher biomass production, in the 660 days after plantation (year 2) (n = 15 plants per population).
CNp – cladode number per plant; CAp – area of cladodes per plant (m2); DWp – dry weight per plant (kg); FWp – fresh weight per plant (kg); B – cv. ‘Bianca’; G – cv. ‘Gialla’; Interm – intermediate; Ellip – elliptic; Scarl –scarlet; Yell – yellow. Means followed by the same letter do not differ significantly (ANOVA and Tukey post hoc test, p = 0.05).
DISCUSSION
Prediction models
We developed linear models to estimate the cladode area, the FW and the DW in Portuguese OFI ecotypes established in a common garden under similar climate conditions, using non-destructive measurements. The variables (L, W, T and D) used in the models were also used in similar studies, but in other populations grown in different climatic conditions (Caloggero and Parera, Reference Caloggero and Parera2004; Curt et al., Reference Curt, Sánchez, Sánchez, Aguado, Uceda, Zaragoza, Agüera and Fernández2011; Pinto et al., Reference Pinto, Menezes, Sampaio, Andrade, Filho, Silva, Andrade and Figueiredo2002; Sáiz and Fernández, Reference Sáiz and Fernández1990). In the linear models reported herein, the variables L × W and L × W × T were good predictors of the cladode area and the FW, respectively. The regression and the correlation coefficients’ values obtained for the area of the cladode (respectively 0.75 and 0.91) were similar to those reported by Caloggero and Parera (Reference Caloggero and Parera2004) in OFI populations in Argentina [CA = 6.31 + 0.8 (L × W), R2 = 0.93]. However, this comparative analysis should be done with caution due to the lack of some information namely the coefficients’ standard errors. A comparative analysis with other models previously published to predict the fresh and DW is not possible (Curt et al., Reference Curt, Sánchez, Sánchez, Aguado, Uceda, Zaragoza, Agüera and Fernández2011; Pinto et al., Reference Pinto, Menezes, Sampaio, Andrade, Filho, Silva, Andrade and Figueiredo2002; Sáiz and Fernández, Reference Sáiz and Fernández1990) as they lack the intercept (regression through the origin) and the R2 value does not have the same statistical significance (Montgomery et al., Reference Montgomery, Peck and Vining2012).
The linear model suggested by Sáiz and Fernández (Reference Sáiz and Fernández1990) and Curt et al. (Reference Curt, Sánchez, Sánchez, Aguado, Uceda, Zaragoza, Agüera and Fernández2011) for the DW estimation, using the empirical relationship between DW and the regressor W × L × D, gave no satisfactory results with our data, explaining only 52.7% of the DW variability. In the case of the DW estimation, the interaction term W × T × D was considered the best regressor term amongst the set of potential variables, explaining 72.3% of the DW variability.
Biomass production assessment
Considering the number of cladodes per plant, the photosynthetic area, the FW and the DW per plant, the cv. ‘Gialla’ outperformed the other populations, which reflects its origin as improved material. Caloggero and Parera (Reference Caloggero and Parera2004) also reported the superior performance of this cultivar compared to the Argentinean ecotypes, considering as parameters the number of cladodes per plant and photosynthetic area. The number of cladodes per plant observed in cv. ‘Gialla’ at 330 and 660 DAP (5.1 and 25.9, respectively) are similar to those presented by Calogero and Parera (Reference Caloggero and Parera2004), who reported values 6.2 and 23.2 at 330 and 450 DAP, respectively. In the case of the area of cladodes per plant, the observed values in the cv. ‘Gialla’ at 330 and 660 DAP (0.43 and 1.90, respectively) are also similar to those reported by Calogero and Parera (Reference Caloggero and Parera2004), i.e. 0.4 and 1.7 at 330 and 450 DAP, respectively.
Without a model to predict the dry matter, the alternative is to use a destructive sample of cladodes, a time consuming process. Besides, the dry matter needs to be evaluated several times, for this parameter varies during the year. Neder et al. (Reference Neder, Costa, Edvan and Filho2013), using the path analysis, demonstrated that a correlation exists between fresh and dry matter production, thus an indirect selection for this trait based on the fresh matter production and the photosynthetic area is possible. Nevertheless, we have developed a linear model to estimate the cladode DW explaining 72.3% of its variability, using the interaction term between width and mean thickness of the cladode times the diameter of the neck (W × T × D).
Considering the group of the 16 OFI Portuguese ecotypes, a significant genetic variability in plant growth rate was found, as revealed by biomass production. Four ecotypes (OFI-05, OFI-012, OFI-13 and OFI-14) out of the 16 Portuguese ecotypes evaluated for biomass production were not significantly different from the cv. ‘Gialla’. Furthermore, these results indicate that a clonal selection program should be started using clones to produce fodder and fruit. Additionally, the selected four ecotypes were identified as O. ficus-indica f. ficus-indica and had few spines like the cv. ‘Gialla’.
The studied ecotypes were collected in locations with different altitude, but no relationship between the biomass production and the geographic origin of the ecotypes was found. The only pattern detected is related to the cladode shape, since the ecotypes with ovate cladodes produced higher biomass compared to those with elliptical cladodes.
A dry matter productivity of 3.9 Mg ha−1 for a density of 2667 plants ha−1 (0.27 plants m−2) in the 2nd year after planting was obtained in the cv. ‘Gialla’. The mean value for the dry matter productivity was 3.2 Mg ha−1 for the top Portuguese ecotypes group (OFI-05, OFI-012, OFI-13 and OFI-14). Garcia de Cortázar and Nobel (Reference Garcia de Cortázar and Nobel1992) obtained a productivity of 5.5 Mg DW ha−1 year−1 during the 2nd year after planting, under irrigation and density of 0.25 plants m−2. The observed differences are explained by the dryland conditions verified in our study, since the water availability plays a primary role in the OFI carbon gain. Herein, the vegetative growth of OFI occurred during the time of the year with low rainfall and in a soil with low water holding capacity. The prickly pear is extremely tolerant to high air temperatures, but cladodes can be damaged by air temperatures below −6 °C, depending on particular genotypes (Goldstein and Nobel, Reference Goldstein and Nobel1994; Nobel and De la Barrera, Reference Nobel and De la Barrera2003; Valdez-Cepeda et al., Reference Valdez-Cepeda, Blanco-Macías, Gallegos-Vázquez, Salinas-García and Vázquez-Alvarado2001). Such sensitivity to low temperatures severely limits the areas for OFI cultivation in temperate regions. Nevertheless, the probability of temperatures below −6 ºC is close to zero in Castelo Branco region, according to meteorological records from the last 30 years (AEMET, 2011), with the mean temperature values being within the OFI cultivation requests.
Assuming a density of 5000 plants ha−1 in dryland farming conditions, we expect a FW biomass production of 60–70 Mg ha−1 (nearly 6–7 Mg ha−1 of dry matter for a dry matter content of about 10%) in the 2nd year after plantation.
In the present study, due to logistic conditions, we used a single cladode per hole. In fact, the biomass production is affected by the number of cladodes per hole. In the establishment of an orchard it is advisable to plant two (or more) cladodes per hole, for this will increase the number of cladodes per plant and the photosynthetic area and, afterwards, the earlier fruiting potential after planting (Caloggero and Parera, Reference Caloggero and Parera2004; Inglese et al., Reference Inglese, Basile, Schirra and Nobel2002).
The lack of variance homogeneity in the four of the studied variables, NCp, CAp, FWp and DWp, was registered among some of the 18 OFI populations, which reflects the existence of intra-population variability. The provenance test was installed using cuttings and the intra-population variability detected in the first two years after planting may be related to phenotypic variations in single cuttings before planting. Indeed, single cuttings can be one- to two-years-old, and their surface area, dry mass and environmental factors, such as soil fertility and water availability, have a significant influence on successful rooting and subsequent performance in the field (Inglese et al., Reference Inglese, Basile, Schirra and Nobel2002). The hypothesis that the observed variability is the result of somaclonal mutation does not seem very likely, as shown by Zoghlami et al. (Reference Zoghlami, Bouamama, Khammassi and Ghorbel2012), who observed the genetic stability of long-term micropropagated OFI plantlets. However, we should not to exclude that in some ecotypes, the intra-population variability might be due to the existence of polyclonality. As stated by Griffith (Reference Griffith2004), the actual taxonomic concept of OFI may include clones derived from multiple lineages and be polyphyletic. The origin of the observed intra-population variability should be clarified through the use of molecular markers.
CONCLUSIONS
Climate change is expected to deeply affect the Mediterranean region, particularly inland areas in the near future. The OFI, by its morpho-physiological characteristics and multiple economic uses, represent an alternative crop in the Mediterranean region. We have developed linear models to estimate the cladodes photosynthetic area, the fresh and dry matter production by a non-destructive method. Significant variability in biomass production among the studied populations of OFI was found in this study. Some ecotypes showed low vegetative vigour and have reduced interest as material for vegetative propagation. Thus, the proper choice of cultivars or ecotypes for clonal propagation in new plantations either for animal feed or fruit production is a key factor. Within the 16 evaluated Portuguese OFI ecotypes it was possible to select four ecotypes with similar biomass production to the ‘Gialla’ cultivar. They constitute an interesting plant material to initiate a breeding program through clonal selection, either for fodder and/or fruit production. Further studies are ongoing to evaluate the flowering, fruiting and nutritional characterization of the Portuguese ecotypes, using qualitative and quantitative approaches.
Acknowledgements
Forest Research Center and CERNAS-IPCB are funded by Foundation for Science and Technology (Portugal) with the grants UID/AGR/00239/2013 and UID/AMB/00681/2013, respectively. We acknowledge G. Diogo and J. Lourenço for their assistance in the lab. Thanks are, also, extended to I. Salavessa for editing the English of the manuscript.
SUPPLEMENTARY MATERIALS
For supplementary material for this article, please visit http://dx.doi.org/10.1017/S0014479716000211