

Introduction
Education, vocational training, and lifelong learningReference Benkovic and Dobrota1 play very important economic and social roles,Reference McGrath2 and are the major components of human development. In addition, investments in education provide a clear boost to economic development.Reference Kocer and van de Werfhorst3 Today, university rankings and rankings of countries based on their scientific achievements and educational structure are becoming increasingly important.Reference Knutsson and Lindberg4
The goal of this study is to evaluate countries according to their educational structure, which includes all levels of education (from the primary to tertiary level), using a newly acknowledged statistical method, and comparing the results with the ranking based on the Education index,5 one of the key dimensions of the Human Development Index (HDI). The research data were obtained from an accessible data set6 that includes levels of educational development and structure based on individual criteria. A comparative analysis of countries that combines these criteria and presents an aggregated indicator of their educational structure and development has yet to be conducted. The Education index, on the other hand, is based on a much smaller number of criteria, and does not include such a detailed analysis as is presented in this article. This is precisely the main idea of our research: to compare these rankings and to propose a new approach that will overcome these deficiencies.
Consequently, the main purpose of the study presented in this article has been to evaluate and rank countries according to their educational structure and development. Such ranking has been carried out using the statistical I-distance method.Reference Ivanovic7 The study aims to include all research parameters by combining them in such a way as to form a common indicator of educational structure. Therein, the I-distance method calculates a single synthetic indicator that can represent a rank. In addition, this method is quite comprehensive, as it explains in detail the importance of the criteria the ranking is based upon.
In what follows, we first review previous research related to our topic. We then define the issue this study has aimed to tackle and explain the methodology. This is followed by a presentation and discussion of the results of the countries’ evaluation and ranking. Finally, a conclusion is given.
Previous Studies
A number of studies have discussed the topic of education. According to Hirsto, Lampinen, and Syrjakari,Reference Hirsto, Lampinen and Syrjakari8 many different concepts have either been used interchangeably or in order to focus on different aspects of development in the field of educational development. Early research examined key developments affecting higher education worldwide and patterns in higher education development.Reference Altbach9 Other research efforts focused on the impact of education and other policies on the quantity and quality of education that children obtain in developing countries.Reference Glewwe and Kremer10 These studies have also indicated that important policy questions stem from the potential role of education in improving the welfare of the approximately five billion people who are currently living in developing countries. Yet other studies have examined the relationship between the education and business world,Reference Lans, Oganisjana, Taks and Popov11 and its effect on economic development growth and productivity.Reference Schomburg and Teichler12 BiaoReference Biao13 believes that current education formats in developing countries do not have the capacity to create many jobs, and claims that vast areas of untapped opportunities related to job creation exist in the developing world.
Recently, numerous studies have been conducted on the ranking of higher education institutions.Reference Merisotis14–Reference Brooks16 However, no study has dealt with evaluating and ranking countries according to educational structure and development as based on the criteria presented in the present article. Closest to our undertaking is the research of Liu and Chang,Reference Liu and Cheng17 in which they ranked countries by the number of universities that are among the top 20, 100, 200, 300, 400 and top 500 on the Academic Ranking of World Universities list,18 probably the most cited ranking list up to this point. However, is this the best such list? AltbachReference Altbach19 states that rankings are benchmarks of excellence for the public, and that they help to demonstrate differences among academic institutions, which leads to differentiated goals and missions in academic systems. Yet, he also questions these rankings and the parameters they measure, and indicates that they use inadequate metrics to obtain their measurements. More recent research has advocated a new approach, based on the I-distance method, for ranking universities.Reference Jovanovic, Jeremic, Savic, Bulajic and Martic20
Finding the best metric is precisely why we propose here evaluating and ranking countries using the approach recommended by Jeremic,Reference Jeremic, Bulajic, Martic and Radojicic21 and comparing it with the ranking given by the Education index.5 JeremicReference Jeremic, Bulajic, Martic and Radojicic21 ranked higher education institutions and compared the results with the ARWU list; their results showed a significant correlation with the official ARWU list, as well as some inconsistencies concerning European universities. Previous research points to the need of carefully choosing the evaluation method, and thoughtfully considering a set of input indicators and variables. This topic will be thoroughly elaborated in the next section.
Research Issue and Methodology
Education is a major component of one’s well-being and is used in determining economic development and quality of life. According to the methodology used by the United Nations, the Education index is one of three equally important measures for the calculation of a country’s Human Development Index, as well as a summary measure of human development.22 The UN’s methodology for calculating the Education index, which had been used until 2010, combined the adult literacy rate (with a two-thirds weighting) and the primary, secondary, and tertiary gross enrolment ratio (with a one-third weighting). The UN’s new methodology calculates the Education index by using the mean years of schooling for adults aged 25 years and the expected years of schooling for children of school entering age.22 The indicators are normalized using a minimum value of zero and maximum values are set to the actual observed maximum value of mean years of schooling from the countries in the time series. The parameter, Expected years of schooling is maximized by its cap at 18 years. The Education index is the geometric mean of the two indices. Regardless of calculation methodology, the Education index only combines two parameters. The hypothesis presented in the present article is that evaluation can be done more accurately when more than two parameters are used.
Methodology
The I-distance method allows for the ranking of countries by taking many parameters into consideration. The main data source used in this research paper has been the set of joint UOE (UNESCO Institute of Statistics (UIS), OECD, Eurostat) questionnaires on education and other Eurostat-specific tables.6 We used comparable data, statistics and indicators on education for 33 countries, including member states of the EU, EU candidate countries, EEA countries and Switzerland (the set of countries included can be found in Table 1). The statistics refer to public and private, full-time and part-time education in each country’s ordinary school and university system, as defined in the international standard classification of education (ISCED). The statistics cover enrolments, entrants, graduates, personnel and expenditure.
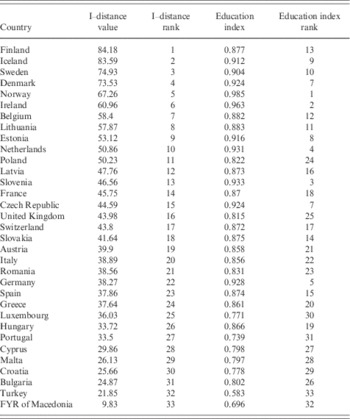
Table 1 Results of the I-distance method, the I-distance value and Education index.
In this article, ranking has been based on 12 different criteria chosen to determine a country’s educational structure and development; these are:
∙ School expectancy – expected years of education over a lifetime (this type of estimate is accurate if current patterns of enrolment continue on the same trend in the future).
∙ Pupils and students enrolled – total percentage of people enrolled in the regular education system in each country. It covers all levels of education from primary education to postgraduate studies.
∙ Participation rate of four-year-olds in education – percentage of four-year-olds who are enrolled in education-oriented pre-primary institutions.
∙ Tertiary education – total percentage of people who are enrolled in tertiary education (including university and non-university studies) in the regular education system of each country.
∙ The share of women among tertiary students – percentage of women among all students in tertiary education, regardless of the field of education they are in.
∙ Pupils learning English – percentage of all pupils in upper secondary education who are learning English as a foreign language. It only covers general and not vocational education in countries where English is described as a foreign language in the curriculum or other official document relating to education in the country.
∙ Science and technology graduates tertiary (1000 of population) – new tertiary graduates in a calendar year, from both public and private institutions, who have completed their graduate and postgraduate studies, as compared with the age group that corresponds to the typical graduation age in the majority of countries.
∙ Life-long learning – percentage of the adult population aged 25 to 64 participating in education and training. The information collected relates to all education or training whether or not relevant to the respondent's current or possible future job.
∙ 18-year-olds in education – percentage of all 18-year-olds who are still in any kind of school (all ISCED levels). It gives an indication of the number of young people who have not abandoned their efforts to improve their skills through initial education and it includes both those who had a regular education career without any delays as well as those who are continuing even if they had to repeat some steps in the past.
∙ Foreign languages learnt per pupil – average number of foreign languages learned per pupil in secondary education. A foreign language is recognized as such in the curriculum or other official documents relating to education in the country.
These ten variables represent non-financial indicators of the educational structure; the next two variables represent financial indicators:
∙ Total public expenditure on education per capita – (EUR PPS).
∙ Total public expenditure on education as a percentage of GDP.
These variables show education funding of the public sector either by directly bearing the current and capital expenses of educational institutions (direct expenditure for educational institutions) or by supporting students and their families with scholarships and public loans, as well as by transferring public subsidies for educational activities to private firms or non-profit organizations (transfers to private households and firms). These financial indicators demonstrate the importance given to education in any particular country and the potential for its further development, especially as HwangReference Hwang23 proved that there is a significant relationship between asset distribution and tertiary expenditure, which is most evident in developing countries.
The data collected for the year 2010 correspond to latter-day data on Eurostat, and have been compared with the Education index for the year 2010. The index lends a different perspective from the I-distance ranking, since it is calculated solely based on two indicators: mean years of schooling (of adults) and expected years of schooling (of children). These indicators have been included in the I-distance analysis through the following indicators: School expectancy, Pupils and students enrolled and Tertiary education. Other indicators have been included because of a perceived correlation between better educational structures and investments in future education development. This all makes I-distance rank more comprehensive and precise.
I-distance
The ranking of specific marks is often done in ways that can seriously affect the process of interest: UN participation,Reference Ivanovic24 University ranking,Reference Radojicic and Jeremic25 medicine selection and many others.
I-distance is a metric distance in an n-dimensional space. It was originally proposed and defined by B. IvanovicReference Ivanovic24 in 1963. It has been used in University ranking,Reference Jeremic, Bulajic, Martic and Radojicic21 and for evaluating the socio-economic development of counties.Reference Jeremic, Bulajic, Martic, Markovic, Savic, Jeremic and Radojicic26
Ivanovic devised this method to rank countries according to their level of development based on several indicators. Many socio-economic development indicators were considered, but the problem was how to use all of them in order to calculate a single synthetic indicator, which will thereafter represent the rank.
For a selected set of variables X T=(X 1,X 2,…,X k) chosen to characterize the entities, the I-distance between the two entities e r=(x 1r,x 2r,…,x kr) and e s=(x 1s,x 2s,…,x ks) is defined as
 $$D(r,s)=\mathop{\sum}\limits_{i{\minus}1}^k {{{\left| {d_{i} (r,s)} \right|} \over {\sigma _{i} }}\prod\limits_{j{\minus}1}^{i{\minus}1} {(1{\minus}r_{{ji.12...j{\minus}1}} )} } $$
where d i(r,s) is the distance between the values of variable X i for e r and e s, for example the discriminate effect,
 $$d_{i} (r,s)=x_{{ir}} {\minus}x_{{is}} ,i\in \{ 1,...,k\} $$
σ i is the standard deviation of X i, and r ji.12…j−1 is a partial coefficient of the correlation between X i and X j, (j<1).
The construction of the I-distance is iterative; it is calculated through the following steps.
∙ Calculate the value of the discriminate effect of the variable X 1 (the most significant variable which provides the largest amount of information on the phenomena that are to be ranked,Reference Ivanovic and Fanchette27
∙ Add the value of the discriminate effect of X 2 which is not covered by X 1,
∙ Add the value of the discriminate effect of X 3 which is not covered by X 1 and X 2,
∙ Repeat the procedure for all variables.Reference Jeremic, Bulajic, Martic, Markovic, Savic, Jeremic and Radojicic26
Sometimes, it is not possible to achieve the same sign mark for all variables in all sets; as a result, a negative correlation coefficient and a negative coefficient of partial correlation may occur.Reference Dobrota, Jeremic and Markovic28 This makes the use of the square I-distance even more desirable. The square I-distance is given as:
 $$D^{2} (r,s)=\mathop{\sum}\limits_{i=1}^k {{{d_{i}^{2} (r,s)} \over {\sigma _{i}^{2} }}} \prod\limits_{j=1}^{i{\minus}1} {(1{\minus}r_{{ji.12...j{\minus}1}}^{2} )} $$
The I-distance measurement is based on calculating the mutual distances between the entities being processed, whereupon they are compared to one another, so as to create a rank. In order to rank the entities (in this case, countries), it is necessary to have one entity fixed as a referent in the observing set using the I-distance methodology. The entity with the minimum value for each indicator or a fictive maximum or average values entity can be set up as the referent entity. The ranking of entities in the set is based on the calculated distance from the referent entity.Reference Radojicic, Isljamovic, Petrovic and Jeremic29
Results
The comparison of the Educational index and actual I-distance rankings for the year 2010 is given in Table 1 and Figure 1. As can be seen from Table 1, Finland, Iceland, Sweden, Denmark and Norway top the I-distance method list. On the other hand, Malta, Croatia, Bulgaria, Turkey and Former Yugoslav Republic of Macedonia come in at the bottom.

Figure 1 Differences between I-distance rank and Education index rank.
The I-distance rank is obviously slightly different from the Education index rank, calculated according to the UN methodology. This result is to be expected, taking into account that the ranks depend on the parameters included in the analysis and the applied methodology. As for the compared ranking of countries, a Spearman’s rho statistic has been calculated, and the correlation is found to be significant (r s=0.779, p<0.001). Overall, if the I-distance ranking is compared with the Education index ranking, it can be concluded that the ranks are similar. In fact, the correlation between the I-distance value and the Education index is also significant (r=0.682, p<0.001). However, the I-distance rank can be considered far more precise than the Education index, since it is based on a larger number of indicators, which include educational structure and development perspectives.
In order to better comprehend the ranking results of the I-distance method, it is essential to establish the variables that are most important for measuring the educational structure and development of countries. A Pearson correlation test has been used to determine the significance of input variables. The correlation coefficient of each variable, with the I-distance value is presented in Table 2.
Table 2 The correlation between input variables and I-distance scores.

*p<0.05, **p<0.01.
The most significant variable for determining a country’s educational structure is School expectancy, which represents the expected years of education over a lifetime. The correlation with I-distance is significant at the 0.01 level (r=0.818, p<0.001). Even though this variable is also included in calculating Education index, this index still does not enclose the whole set of the variables included in our research, which makes it deficient.
One of the reasons why Finland and Iceland hold first place in the ranking list is school expectancy. Expected years of education over a lifetime in these countries exceeds 20. Sweden, Denmark and Norway follow, with 19.9, 19.2, and 18.4 years respectively. Croatia, Bulgaria, Turkey and the Former Yugoslav Republic of Macedonia are at the bottom of this list with a respective 15.6, 15.8, 16 and 13.9 years. This conclusion is quite expected, since the above countries are found in the Developing Countries30 list.
The second most significant variable is Total public expenditure on education as a percentage of GDP – education funding of the public sector as a percentage of the Gross domestic product. The correlation with I-distance is significant (r=0.736, p<0.001). This finding can be linked to the other studies that have recognized the importance of this variable.Reference O’Mahony31 Denmark, Cyprus, Iceland, Norway and Sweden are countries that top the list regarding this specific criterion, with a respective 8.72, 7.98, 7.82, 7.32 and 7.26% of GDP invested in education; all the other listed countries invest less than 7% of GDP. Based on this criterion, Slovakia, Greece, Luxembourg, the Former Yugoslav Republic of Macedonia and Turkey are at the bottom of the list, with 4.09, 4.09, 3.78, 3.35 and 3.07% respectively.
Other important variables for evaluating and ranking countries by their educational structure and development are Total public expenditure on education per capita, Life-long learning and 18-year-olds in education, while variables Pupils learning English and Foreign languages learnt per pupil have shown to be of no significance in the evaluation process.
Differences between the rankings are shown in Figure 1. The biggest difference is to be found for Germany, which ranks fifth according to the Education index, yet the I-distance method puts it in 22nd place. Poland and Finland follow and are lower on the Education index ranking list (24th and 13th), while the I-distance ranking has raised them to the 11th and first position respectively. In both cases, the main causes of the differences can be found in the variables School Expectancy and Total public expenditure on education as a percentage of GDP. Germany spends only 5.06% of GDP on education funding, while the expected years of education over a lifetime total 17.9, which combined constitute the main reasons for such a significant I-distance rank deterioration in comparison with the Education index rank. A high expenditure on the part of Poland and Finland as well as extremely high school expectancy in Finland cause rank improvement. This perspective proves the initial hypothesis that the ranking can be even more accurate if more than two parameters are used.
The proposed ranking through the I-distance method for some countries is quite different from what would otherwise be expected. For example, the United Kingdom, which has the best universitiesReference Liu and Cheng17, Reference Jovanovic, Jeremic, Savic, Bulajic and Martic20, Reference Jeremic, Bulajic, Martic and Radojicic21, is middle-ranked, in 16th place. A larger population and GDP are factors that can readily explain this, as it scores only average values on criteria that have proved to be crucial. School Expectancy in the UK is 17 years, and the country comes in at 22nd place based on this criterion. Furthermore, the percentage of 18-year-olds in education is 57.5%. On the other hand, its public investment in education is 5.67% of the GDP, which puts it in 15th place in regard to this criterion. However, if the ranking is compared with the Education index, it only occupies 25th place, which improves the ranking for the United Kingdom by 9.
According to the Human Development Index of the United Nations,22 seven counties in the observed set of data for this research are developing countries. The Baltic region countries Lithuania and Latvia are ranked eighth and 12th respectively. They are ranked higher than most developed countries in Europe mainly because of their high value of the most significant indicator – School expectancy (17.9 and 17.2). The second reason why these countries are better ranked by I-distance method than by Education index method (11th for Lithuania and 16th for Latvia) is the high percentage of GDP for education funding, which is 5.64 for both countries (higher than other developing countries). Furthermore, according to the World Bank,30 both countries spend about 17% of GDP per capita for funding tertiary students. Romania, a relatively new member of the European Union, ranked 23rd according to I-distance measure, and 21st according to the Educational index. Therefore, we can conclude that School expectancy, an indicator included in both measures, most significantly determines the rank of Romania. In order to improve the country’s rank, the School expectancy should be improved. Yet, this is a very long process. Romania is on the good track though, as the value of the indicator has increased from 13.9 in 2000 to 16.5 in 2010. As mentioned before, Croatia, Bulgaria, Turkey and the FYR of Macedonia are at the bottom of this list. They are also at the bottom of the list according to the Education Index. This means that the percentage of GDP invested in education did not affect the rank of observed countries since it is relatively low: 4.33% in Croatia, 4.58% in Bulgaria, 3.35% in the Former Yugoslav Republic of Macedonia, and only 3.07% in Turkey.
Developing countries should strategically increase education funding in the long term, along with introducing a policy of incentives for better and longer education, including all primary, secondary and tertiary levels. Turkey is the only one with a constant improvement of school expectancy from 10.4 in 2000 to 16 years in 2010, but it still has a long way to go considering the small amount of GDP it invests in education.
Conclusion
Education is considered a major component of human development. Today, university rankings are gaining more and more importance. Naturally, the ranking of countries based on their scientific achievements as well as the ranking of countries according to their educational structure and development come next.
This article first proposes evaluating a country’s educational structure and development through the use of the I-distance method, by combining 12 financial and non-financial components into one aggregated indicator, thus providing a more complete coverage of the conditions and the state of education in a country.
Second, this method explains which variables are crucial for determining a country’s educational structure and development. At variance with the Education index, which used only two parameters for the calculation of an index – the mean of years of schooling and the expected years of schooling – our study arranges the whole list of parameters into a specific order of importance. Furthermore, the Education index may be found somewhat unrealistic and questionable, especially due to the fact that the United Nations reputes all countries with an Education index over 0.716 to be highly developed. Overall, the I-distance method resolves this problem, providing a more impartial approach. The I-distance method could easily become a new ‘gold standard’ in the days to come.Reference Jeremic, Bulajic, Martic and Radojicic21
Our main conclusion is that the Education index does not give a sufficiently precise insight into the educational structure and development of countries, and we think that for deeper analysis, the I-distance evaluation and ranking offers a more comprehensive and objective method for the calculation of synthetic values based on a number of different parameters.
The main advantage of the I-distance method is the possibility of ranking countries according to a number of nonfinancial and financial educational indicators, while the Education index does not include financial factors. The second important advantage is that it allows for the determination of the significance of each of the indicators considered without defining their weights in advance. Our study has shown that the most significant indicator is School expectancy and the second Total public expenditure on education as a percentage of GDP. These findings are similar to findings presented by Lijing and McCall,Reference Lijing and McCall32 who claim that public spending on all education levels as a percentage of GDP has a positive and statistically significant effect, which does not vary between developed and less developed countries.
We believe that this type of research is important and relevant for understanding a country’s overall educational development. Via a thorough and comprehensive analysis of data worldwide we might arrive at a full-scale idea of the condition in lower and middle income countries. This is why the data should be collected and made available for countries in Africa, Asia and Latin America.
Marina Dobrota is a Teaching Assistant at the University of Belgrade, Faculty of Organizational Sciences, Department for Statistics. Her research interests are applied statistics, computational statistics, data analysis and data mining. Most of her research combines large-scale qualitative and quantitative data. She is currently participating in two research projects funded by the Serbian Ministry of Education: ‘Infrastructure for Technology-Enhanced Learning in Serbia’ and ‘Cancer and pregnancy’.
Gordana Savic is an Assistant Professor at the University of Belgrade, Faculty of Organizational Sciences, Department for Operational Research. Her research interests are related to operational research, mathematical modelling, and quantitative analysis with expertise in Data Envelopment Analysis efficiency assessment.
Milica Bulajic is a Full Professor at the University of Belgrade, Faculty of Organizational Sciences, Department for Statistics. Her research interests are statistics, econometrics, time series analysis and multivariate data analysis.


