INTRODUCTION
Unsustainable hunting of bushmeat species is of major conservation concern (Robinson & Bennett Reference Robinson and Bennett2000; Milner-Gulland et al. Reference Milner-Gulland and Bennett2003); however, minimal information is usually available to assess how sustainable the trade is in a particular area. Population estimates of bushmeat species are difficult and time-consuming to obtain, particularly in hunted areas where densities are low and animals are wary of humans (Monkkonen & Aspi Reference Monkkonen and Aspi1997; Fitzgibbon Reference Fitzgibbon and Caro1998). Data on hunter behaviour and offtake rates are confined to sites where researchers have invested substantial time and effort (for example Muchaal & Ngandjui Reference Muchaal and Ngandjui1999). Given the scale of the bushmeat problem, it is unlikely that research focusing on hunters and animal populations will ever be sufficiently comprehensive to base widely applicable sustainability assessments upon it.
Market data have enormous potential as an indicator of sustainability. There are a number of possible proxies for depletion that can be obtained from market data, including: (1) a decline in mean biomass of individuals, or an increase in the mean intrinsic rate of increase, both of which may suggest that more vulnerable, larger-bodied, slower-growing species are being lost; (2) an increase in the price, possibly coupled with a reduction in trade volumes, suggesting that animals are becoming scarcer and demand is not being met; and (3) a shift in the source of animals to less depleted areas, usually areas that are more costly to get to market from owing to distance, road quality or terrain, or which have been newly opened up by roads.
There has been little research into the utility of these proxies. Rowcliffe et al. (Reference Rowcliffe, Cowlishaw and Long2003) described a method by which the level of overexploitation of bushmeat in an area can be determined based on the proportion of particular species in the market. Over time, smaller more productive species should replace larger-bodied species of low productivity (Jerozolimski & Peres Reference Jerozolimski and Peres2003). This phenomenon of hunting down the size classes is also well-known in fisheries (Roberts Reference Roberts1997). Cowlishaw et al. (Reference Cowlishaw, Mendelson and Rowcliffe2005) use market data to show that in Takoradi, Ghana, a mature bushmeat market, a sustainable level of trade has been reached. However, low productivity species do not appear in this market, suggesting that these species have been extirpated in the area.
There are two main problems with using market data to infer sustainability. The first is that most urban markets sell bushmeat from a large catchment area. Sustainability may then be incorrectly inferred from apparent market stability when the meat is simply coming from a previously untapped source. For example, Milner-Gulland and Clayton (Reference Milner-Gulland and Clayton2002) showed that while wild pig sales and real prices showed no trends over a 10-year period in a market in Sulawesi, traders were in fact driving substantially further to obtain the meat. The other issue is that the animals appearing in the market are only a selective proportion of the animals encountered when hunting. If hunters can choose whether or not to kill an individual animal, low value species may be ignored (Rowcliffe et al. Reference Rowcliffe, Cowlishaw and Long2003). Protected species and those of little commercial value tend to be eaten at home, given away or traded within the village, and hence never reach urban markets (Juste et al. Reference Juste, Fa, Delval and Castroviejo1995). Determinants of which animals are traded and which retained include the family's need for cash (de Merode et al. Reference de Merode, Homewood and Cowlishaw2004), the relative prices of bushmeat species and domestic meat (Wilkie & Godoy Reference Wilkie and Godoy2001; Abernethy & Ntsame Effa Reference Abernethy and Ntsame Effa2002) and transport costs to town (Ayres et al. Reference Ayres, de Magalhaes Lima, de Souza Martins, Barreiros, Robinson and Redford1991). As well as changing the proportion of animals of different species traded and retained, increases in bushmeat prices should increase hunter effort, assuming that the bushmeat market is competitive, with no barriers to entry. If the resource is not depleted, increased effort should increase offtake (Damania et al. Reference Damania, Milner-Gulland and Crookes2005). Hence the effect of prices and costs on the volume of trade finally appearing in urban markets is complex.
In this paper, we explore these issues using a uniquely comprehensive long-term dataset of the bushmeat species on sale in Atwemonom market (Kumasi, Ghana) over the period 1987–2002. The dataset is particularly useful because the market monitor recorded not only price, weight and species of all the animals on sale in the market on the days he visited it, but also the village from which the animal came and the method used to kill it. These additional pieces of information are important because they allow us to track changes in technology and to carry out a spatially explicit analysis of changes in trade patterns over time. We can thus address the first of the limitations of market data identified above, and make some inferences concerning the second. This dataset is of the quality that could realistically be aspired to by researchers and policy-makers wishing to use market data to carry out broad-scale sustainability assessments for the bushmeat trade, hence it is particularly useful to assess its strengths and limitations as a tool for sustainability analysis.
METHODS
The dataset
Kumasi is a large city in central Ghana, capital of the Ashanti region. The region covers both savannah and forest zones, and contains some protected areas of natural vegetation within a largely agricultural landscape. Atwemonom market is one of three main markets in the city (Ntiamoa-Baidu Reference Ntiamoa-Baidu1998), and is particularly convenient for bushmeat research because it carries predominately whole fresh (i.e. unsmoked) carcasses of bushmeat species from the surrounding region, particularly the forest zone. Because the animals are whole and unsmoked, they are easily identified and there are no problems in calculating the number of animals killed from body parts, or determining the method by which they were killed. It is possible to record the location of the kill because individual market traders have their own set of hunters who supply them with meat (Ntiamoa-Baidu Reference Ntiamoa-Baidu1998).
Legislation relating to bushmeat species in Ghana is principally enacted via a closed season, under laws LI 685 of 1971 and LI 1357 of 1988 (Ntiamoa-Baidu Reference Ntiamoa-Baidu1998). Species are listed on one of three schedules. Schedule 1 species are wholly protected and cannot be hunted or traded at any time. Schedule 2 and 3 species can be freely hunted and traded outside a closed season of 1st August to 1st December, but schedule 2 species cannot be captured at any time if young, or if accompanied by young.
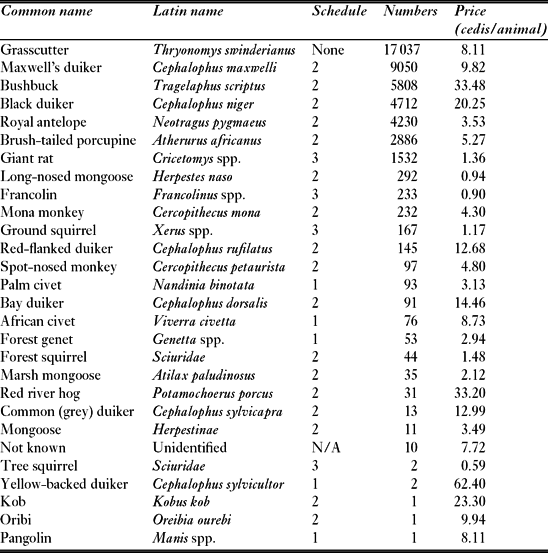
An official from the Ghana Wildlife Department (B. Acheampong) visited Atwemonom market on a regular basis from 1978 to the present and recorded details of all bushmeat animals on sale. He visited all the stalls in the market early in the day and obtained the relevant details from the stallholders. We analysed these data for the period January 1987 to July 2002, covering 37 226 individual animals on 1687 sale days. These days were not evenly distributed throughout the dataset. In particular, the official made substantially fewer visits in the second half of the period (Fig. 1). Of the 27 species recorded in the dataset, only five were Schedule 1, four of which were enacted in the 1988 legislation (Table 1). Since 1988, these species should not appear on the market. One species is completely unprotected and hence freely tradeable at any time of year (grasscutter Thryonomys swinderianus), and the other 21 species are in schedules 2 and 3, and hence should appear in the market only in the open season. The Wildlife Department (WD) dataset has very few records of species appearing illegally in the market; 97% of the records from the closed season were of grasscutters, while only eight schedule 1 individuals were recorded as being sold (the other schedule 1 individuals shown in Table 1 were recorded in 1987, before the legislation was enacted). Hence when taken at face value, this dataset might suggest that the wildlife legislation is being complied with; below we address whether this is a valid conclusion.
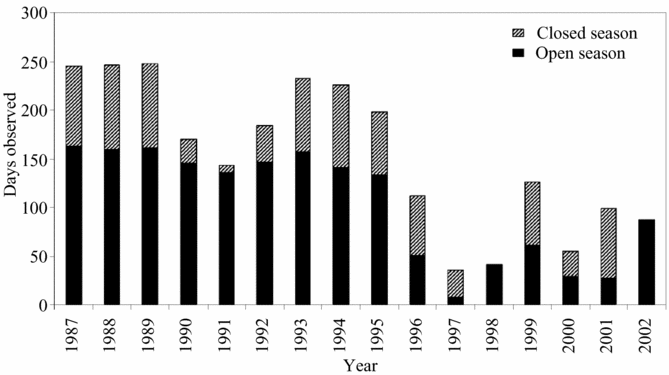
Figure 1 Number of days during the open and closed seasons on which the Wildlife Department official visited the market, 1987–2002.
Table 1 Species recorded in Atewmonom market, Kumasi over the period January 1987 to July 2002. Schedule 1 species are fully protected from hunting, schedule 2 and 3 species may be traded in the open season only. ‘Numbers’ refers to the total number of sale records in the Wildlife Department database. Price is the mean real price in cedis per animal (the unit of sale in the vast majority of cases) over the entire period, deflated to September 1997, and given in US dollars (2053 cedis = US$ 1). N/A = not available.
The market monitoring methods employed have drawbacks, in particular with respect to the probable underestimation of illegally traded animals. There may also be errors introduced by uneven sampling through the week if there are peak trading days, by sampling the same unsold animal two days in a row, by variations in the time of day that the visit occurred (sampling later in the day when some animals have already been sold could underestimate sales), or by uneven coverage of the traders. We do not have the information which would allow us to assess these biases, or how they changed over time, although the fact that a single official collected the entire dataset suggests that methods should be consistent. Three other published surveys are available which give comparable data specific to this market. A comparison with these studies gives useful evidence of the reliability and comprehensiveness of the WD dataset, particularly with respect to its coverage of the illegal trade. The Hofmann et al. (Reference Hofmann, Ellenberg and Roth1999) study closely mirrors the data from the WD over the same period, such that it seems unlikely that the data were independently collected. Tutu et al. (Reference Tutu, Ntiamoa-Baidu and Asuming-Brempong1993) carried out a one-week survey during the open season (March 1993). They found higher trade volumes than the WD dataset for the same period, and recorded five additional species, three of which were schedule 1 species. Although the differences between the datasets are not statistically significant, this suggests that the WD dataset may underestimate trade volumes and may omit to record illegal species. Ntiamoa-Baidu's (1998) study was carried out for one week during the closed period (November 1997). During this period, the WD dataset recorded only grasscutters on sale. However, Ntiamoa-Baidu (Reference Ntiamoa-Baidu1998) recorded 18 other species on sale during this period, and her dataset also recorded significantly higher grasscutter trade volumes than the WD dataset.
Given these discrepancies, we confine our analysis of the WD dataset to the open season, and to the seven most commonly traded species, all of which are legally tradeable. These species make up 95% of the open season trade. We also bear in mind that the overall trade volumes reported in the WD dataset may be underestimates. Hence, we limit our analysis to differences between species and locations. We make the assumption that, although the number of days on which the official visited the market varied over time, his recording effort on the days that he did visit was consistent. This assumption is borne out by the fact that neither the number of animals nor the total biomass on sale per recording day varied with recording effort (the number of days recorded in a given year; regression analysis, adjusted r 2 = 0.04, p = 0.22, df = 15 and adjusted r 2 = 0.05, p = 0.19, df = 15, respectively). Thus, we correct for variation in recording effort throughout the analysis by calculating quantities per recording day, rather than using raw data.
In order to obtain further information on hunter behaviour, we carried out detailed interviews with 16 hunters in three villages in the area (Pekyi No. 1, Pekyi [Nkromma] and Nagode) supplying Atwemonom market in July 2002. These hunters were identified during a larger-scale livelihoods survey, covering 822 randomly selected households. Only a small proportion of the householders interviewed said that they contained hunters (16/822 = 2.1%). Village heads estimated that 3.6% of the population were hunters. These results are similar to the hunter proportions found by Ntiamoa-Baidu (Reference Ntiamoa-Baidu1998; 3.1% obtained by household surveys) and Hofmann et al. (Reference Hofmann, Ellenberg and Roth1999; 3.4% as estimated by village heads). Hunters were asked about their current hunting behaviour rather than about perceived trends, and gave detailed data on the costs of hunting and the locations where they sold meat. Of the 16 hunters interviewed, nine sold their meat only to local villagers or ate it themselves, four took the meat to Kumasi, one sold it at the roadside and two sold it to chopbars and individuals in the local town, suggesting that a significant proportion of hunter offtake is not sold in Kumasi. The main reason cited by hunters for not selling outside the village was the cost of transport. Overall, 35% of the catch was sold, 20% given away and 45% eaten within the household.
Analysing the dataset
We converted the actual prices given in the dataset to real prices using the Ghana Statistical Service's monthly consumer price index to adjust for inflation, taking September 1997 as the base month. In order to analyse changes in the spatial distribution of the trade, we attempted to find the decimal latitude and longitude of all locations with 50 or more observations of individual animals, using the dataset of place names available from URL http://www.fallingrain.com/world/GH/. We located 19% of the names, representing 55% of the records with source names in the dataset, and 33% of the dataset as a whole. The ratio of located and non-located named sources was relatively constant throughout the period. However, the proportion of observations that were given a named source was positively correlated with the number of days on which recording took place (recording effort; adjusted r 2 = 0.42, p = 0.004, df = 15). It is difficult a priori to know whether the failure to record a source location is because the location was unknown (possibly due to a shift in hunting locations), because the observer was systematically biasing recording in some respect (for example towards new locations), or because location was not recorded so conscientiously in years when the recorder visited the market less frequently. The last explanation is given weight by the fact that other variables (price and gear type) were also recorded less conscientiously in years with fewer observation days. Also, of the 56 locations recorded, 93% were recorded in the first year of the dataset and 86% in the last year, suggesting that there is minimal turnover in the villages included in the sample.
As might be expected, the number of animals observed per day in the spatially explicit sample is positively correlated with recording effort (adjusted r 2 = 0.26, p = 0.02, df = 15), unlike the number observed per day in the dataset as a whole. However, our analyses focused on changes in market composition rather than volumes, for the reasons outlined above, so this is not necessarily a problem. The difference between the proportion of trade represented by each of the seven species in the sample and overall dataset was more variable when the sample size was lower, but there is no evidence for a systematic relationship between observation effort and species composition, either individually or on average (regression of mean difference in proportion represented by a given species between the sample and overall datasets against recording effort: adjusted r 2 = − 0.07, p = 0.85, df = 15). There was also no difference between the sample and the overall dataset with respect to the relationship between real price or biomass per individual animal and recording effort (price: r 2 = − 0.07, p = 0.94, df = 14; biomass: r 2 = − 0.07, p = 0.97, df = 15).
The clearest signal of depletion is often an increase in the distance meat travels to market, suggesting that nearby sources are no longer viable (cf. Milner-Gulland & Clayton Reference Milner-Gulland and Clayton2002). Considering changes in trade volumes coming from individual villages is problematic because of small sample sizes. Instead, we used the spatially explicit sample of the dataset to construct a generalized linear model (GLM) of the effect of straight line distance from Kumasi, year and their interaction on the total number of animals recorded per observation day. We then carried out a further GLM in which distance from Kumasi was represented by dividing the data between an inner area close to Kumasi and an outer area, each with a roughly equal number of records.
RESULTS
No significant changes over time in mean biomass or intrinsic rate of increase were observed. This is because the seven species making up the bulk of the trade are fairly similar in size and growth rate, although bushbucks (Tragelaphus scriptus) are substantially larger than the other six species. There was a sharp increase in the real price of all seven species from 1999 onwards (Fig. 2). Economic theory suggests that this price rise should trigger a rise in trade volumes provided the resource is not depleted. There was no evidence for a relationship between real price and numbers recorded per day (adjusted r 2 = 0.007, p = 0.31, df = 14). However, because the dataset cannot be taken as a reliable representation of trade volumes in the market as a whole, we can infer little from this result.
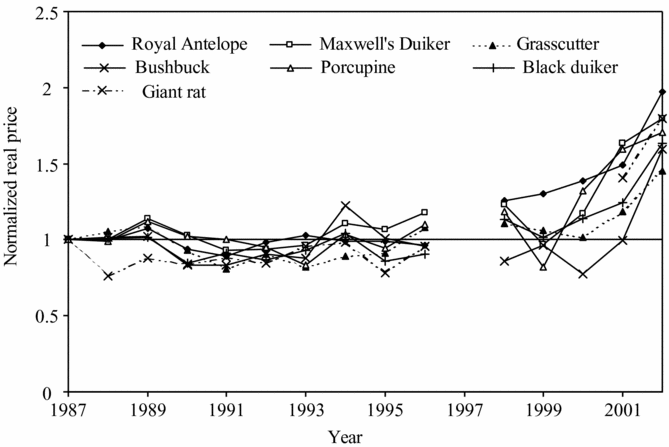
Figure 2 Changes in real price for the top seven traded species. To indicate trends clearly, only open season data normalized to 1987 = 1 are shown. See Table 1 for average prices per species. Data for 1997 and other years where there were three or fewer records are excluded to reduce sampling error.
The rise in real price per individual is consistent over all species, suggesting that it was not linked to a change in tastes. However there was a dramatic increase over time in the proportion of the trade made up by grasscutters, compared to the other species, which generally showed slight non-significant declines in the proportion of trade that they represented, while black duikers (Cephalophus niger) showed a moderate decline (Fig. 3). The outer area was the major contributor to the increase in the proportion of trade represented by grasscutters, while both the inner area and the non-sampled records remained relatively stable. The fact that the records without a spatial location tend to reflect the inner area's pattern suggests that the change in species composition is not linked to sampling effects, for example due to animals coming from previously unhunted areas that were unknown to the observer.
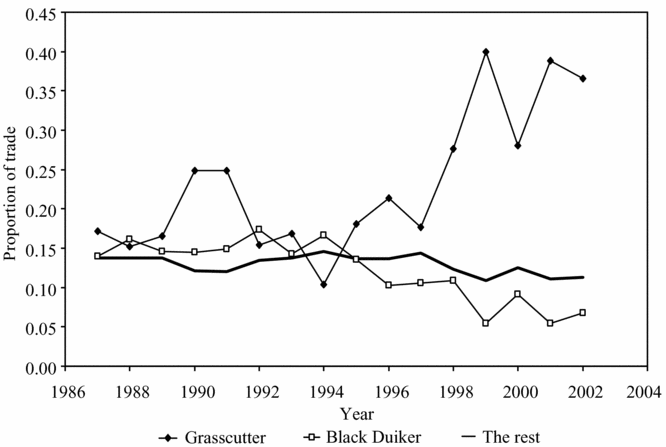
Figure 3 Trends in the proportion of trade represented by different species. Regressions for Grasscutter: β = 0.013, adjusted r 2 = 0.46, p = 0.002; Black duiker: β = − 0.007, adjusted r 2 = 0.68, p < 0.001. ‘The rest’ is a composite of the five other species, all of which showed non-significant trends with time. The full dataset was used, rather than the spatially explicit sample, though the pattern is consistent in both datasets.
Although year was a significant determinant of the number of animals recorded per day in the GLM using straight-line distance, neither distance nor the distance × year interaction were significant, reflecting complex patterns of trade variation, inaccuracies in the distance measure and small sample sizes for some villages and years, particularly later in the period (the sample contains only 25 records in 1997). The regression also explained very little variation in the data (adjusted r 2 = 0.051). Using area as the measure of distance, the proportion of trade coming from the outer area increased significantly over time from about one-third in the 1980s to about two-thirds in the 2000s (Fig. 4). There was no difference between the areas in real price or biomass per individual. Area, species and year had significant effects on numbers recorded per observation day in the GLM (Table 2). The coefficients for main effects show that initially the inner area had a higher proportion of trade than the outer area and grasscutters made up less of the trade than other species, while the interactions show that over time the relative contribution of the inner area decreased and the proportion of trade made up of grasscutters increased.
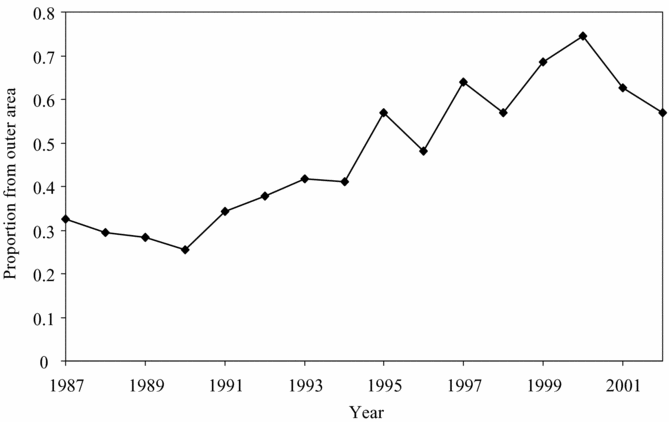
Figure 4 The proportion of individuals in the spatially explicit sample of the dataset that come from the outer part of the hunting catchment.
Table 2 Coefficients of a generalized linear model of the effect of location, species type and year on the total number of animals traded per observation day. The species types are categorized as grasscutter and ‘other’ (representing the other six top-traded species; see Table 1). The model was run in SPSS with location and species types as factors and year as a covariate. The adjusted R 2 was 0.552 and the overall model was significant at p = 0.0000. Only those parameters with p < 0.1 are shown. SE = standard error, Sig = significance.

Eighty-two per cent of the 10 179 animals for which a gear was recorded were killed by shotgun, 18% by cutlass and a negligible number by trapping. As trapped animals were commonly killed by cutlass, this is unlikely to be a true reflection of trapping intensity, although, as cutlasses were also being used as a hunting gear in their own right, it is difficult to know what proportion of cutlass-killed animals were first trapped. There was a clear distinction between rodent and ungulate species; the three rodent species (giant pouched rat Cricetomys spp., grasscutter, brush-tailed porcupine Atherurus africanus) had been killed by cutlasses more than 25% of the time, the ungulates less than 10% of the time. There was a significant negative relationship between real price and the proportion of animals shot, which was driven largely by the last two years of the dataset (Fig. 5). If this represents a genuine trend, it could equally well be caused by increases in trapping rate (through new entrants or a shift in technology by existing hunters) or by increased sale of trapped animals that were previously eaten locally.
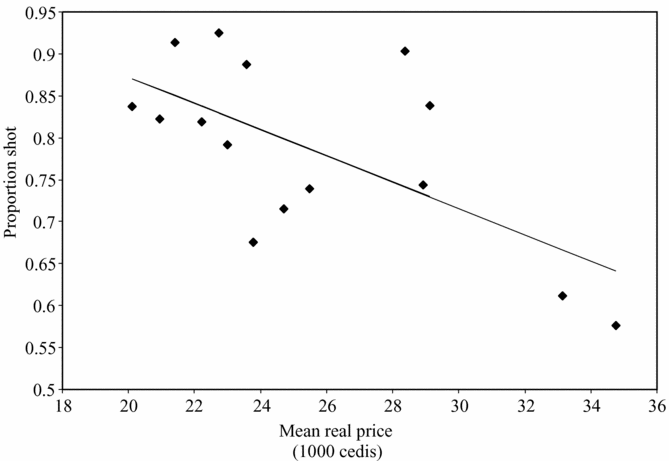
Figure 5 The relationship between the weighted mean of the real price of the seven species in the dataset and the proportion of individuals recorded as shot, rather than being trapped or killed with a cutlass. The regression line is also shown (adjusted r 2 = 0.37, df = 14, p = 0.01). Price is in cedis, deflated to September 1997 (when 2053 cedis = US$ 1).
DISCUSSION
The consistent price increase for all bushmeat species over the last few years of the dataset is likely to be driving other trends in the dataset. The causes of this price rise are unclear. The most likely explanation would be a rise in income, but no correlation exists between bushmeat prices and per caput gross domestic product (a proxy for income). Other potential explanations of increased demand for bushmeat are increases in the urban population or scarcity of alternatives such as livestock.
There was an increase over time in the proportion of trade originating from the outer areas. It is not possible to test directly whether this was a genuine increase, or a result of the observer biasing data collection towards animals coming from more distant locations. However, the tests for internal consistency of the dataset suggest that such systematic bias is unlikely. The increase in distance travelled by the bushmeat may reflect depletion in the inner areas, but is also consistent with economically rational hunter responses to increased real prices. Travel costs are a significant component of overall hunter costs (Mendelson et al. Reference Mendelson, Cowlishaw and Rowcliffe2003). As prices increase, hunters in outer areas are more likely to find it worthwhile to incur these costs of taking their offtake to Kumasi.
Why is it that grasscutters make up a growing proportion of the trade, while the proportions of other species are stable or declining? Grasscutters are in the middle of the productivity range of the seven species and all are found in similar habitats, hence local decline of the other species with grasscutters surviving is unlikely. They are also in the middle of the price range of the seven species (Table 1). The selective response to price increases may be attributable to grasscutters having the highest price per kilogram of all seven species. Although bushmeat is sold per individual rather than per kilogram at Atwemonom, it may be that, as at Takoradi (Cowlishaw et al. Reference Cowlishaw, Mendelson and Rowcliffe2005), travel costs are incurred per kilogram; hence grasscutters give the highest profits once travel costs are taken into account. The observation that the outer areas had a much larger increase in grasscutter sales than inner areas suggests that transport costs may indeed have played a role. Another potential explanation revolves around the role of grasscutters as an agricultural pest. If there are differences over time and space in the number of people who are farmer-hunters (trapping mainly agricultural pests around their fields) compared to commercial hunters (predominately gun-hunting) then this might also change the proportion of grasscutters in hunters’ offtake.
Because of the problems with the dataset, it is not possible to infer depletion by looking for reductions in the total numbers of animals on sale. Even if we were to take the dataset at face value, there are no clear trends that provide an obvious signal of depletion. It is probable that, if hunting for the seven species under analysis had been highly unsustainable, any signal of depletion would have been much stronger, and hence more easily detectable in the dataset. This suggests that, while not necessarily sustainable, at least hunting was not rapidly depleting stocks. However the very small proportion of less common, more vulnerable species (such as primates) in the dataset may suggest that the area is already depleted of these species, leaving only relatively fast-growing and resilient species (see Cowlishaw et al. Reference Cowlishaw, Mendelson and Rowcliffe2005, for a similar situation in Takoradi market, Ghana). This may also be an artefact of the dataset, however, because some of the more vulnerable species are schedule 1 species. Hunters mention a wider range of species as being regularly caught than appear regularly in the market, suggesting that this is part of the explanation. Further analysis is impeded by the very low sample sizes for these species in the dataset.
This unique time series of market data is one of the most comprehensive datasets available in the bushmeat literature, yet the trends displayed are consistent with radically different explanations. In one interpretation, the data could be giving a clear warning that unsustainable use was occurring. Hunters were struggling to keep up with consumer demand and traders were recruiting hunters from further afield to maintain supplies. At the same time, wildlife depletion in prime habitat was forcing hunters to trap cheaply near their fields, as the returns to gun hunting were so poor. Alternatively, rising prices were tempting new entrants into the profession, including those from further away whose transport costs were previously prohibitive. They were starting up with cheap technology, trapping around their fields, and were selling the best-priced of the commonly trapped species while eating the rest. Hunters who previously ate their catch or sold it locally were now finding it worthwhile to sell it in Kumasi. Hence, price rises were improving local livelihoods, but with an unknown effect on sustainability.
Long-term market data have value as a component of sustainability analysis. However in isolation they tell us very little about sustainability because they represent the outcome of several processes, including stock depletion, economic behaviour by consumers, traders and hunters, and gear selectivity. Market data must be supplemented with information about these processes if any judgements about sustainability are to be made. The questions raised by our analysis can serve as a guide to the kinds of data that need to be collected. These include on the hunter side: spatially explicit data on the identity of hunters (farmers or commercial); the prevalence of hunting and the proportion of offtake sent to market; the costs of hunting and of transport of meat to market; and changes in catch per unit of effort expended. On the market side, the price and availability of alternatives, consumer tastes and changes in consumer population size are necessary for understanding the drivers of changes in bushmeat prices. There is also a need to be aware that illegally traded species, while being the most likely to suffer depletion from trade, are not easily picked up by routine non-clandestine market monitoring.
ACKNOWLEDGEMENTS
We are grateful to Conservation International for funding this research. We thank Mohamed Bakarr, Charlotte Boyd, Jim Cannon, Kristen Walker, Guy Cowlishaw, Marcus Rowcliffe, Noelle Kümpel, David Brown, David Wilkie, John Robinson and Stephen Ling for their help. The work was partly carried out while EJM-G was an academic visitor at the Ecology Centre, University of Queensland, and a Henry Schapper Visitor at the Department of Agricultural and Resource Economics, University of Western Australia. In Ghana, we thank Okyeame Ampadu-Agyei (Conservation International Ghana), William Oduro (Kwame Nkrumah Institute of Science and Technology), Emmanuel Nimo (Kumasi Zoological Gardens), Francisca Delali Masroh and Barbara Tarchie. We particularly acknowledge Brenyah Acheampong (Ghana Wildlife Department), who collected the data analysed here.


