


INTRODUCTION
To develop an ecosystem approach to fisheries, precise identification and quantification of fishing impacts is essential, as contact fishing has a direct physical impact on benthic communities (Gray et al. Reference Gray, Dayton, Thrush and Kaiser2006). In particular, bottom trawling is one of the main sources of seabed disturbance worldwide, impacting the structure and the functioning of benthic communities (Kaiser et al. Reference Kaiser, Clarke, Hinz, Austen, Somerfield and Karakassis2006). Through frequent ploughing of the seabed, resuspension and homogenization of sediments and removal of parts of the habitat and benthic fauna, bottom trawling leads to a decrease in the biodiversity, abundance and distribution of species (Thrush & Dayton Reference Thrush and Dayton2010; Palanques et al. Reference Palanques, Puig, Guillén and Martín2014; Clark et al. Reference Clark, Althaus, Schlacher, Williams, Bowden and Rowden2016). Because of their specific biological traits, species are not equally vulnerable to trawling (Bremner et al. Reference Bremner, Rogers and Frid2006a, Reference Bremner, Rogers and Frid2006b) and can respond differently to disturbances (de Juan & Demestre Reference de Juan and Demestre2012). Species’ biological traits are linked to their functions within the ecosystem (Snelgrove 1998), and changes in observed trait patterns can make it possible to identify functional shifts (Tillin et al. Reference Tillin, Hiddink, Jennings and Kaiser2006). Assessing species and community vulnerability is thus critical to identifying and prioritizing areas requiring conservation measures in seascape and fisheries planning (Clark et al. Reference Clark, Althaus, Schlacher, Williams, Bowden and Rowden2016). The list of vulnerable marine ecosystems (VMEs; United Nations General Assembly Resolution 61/105 2006) encompasses various ecosystems characterized by high structural complexity and low recoverability, and are recognized as strongly vulnerable to fishing disturbance (e.g. seamounts, hydrothermal vents and cold corals). VMEs house rare and/or fragile species of functional significance. However, delineating VMEs remains problematic due to the lack of reliable and consistent methodology to identify indicator species and to quantify adverse fishing impacts (Auster et al. Reference Auster, Gjerde, Heupel, Watling, Grehan and Rogers2011). Vulnerable mega-epibenthic species, such as large hydrozoans, sea pens, crinoids and anemones, are usually used as indicator species (ICES 2016a). However, they are barely sampled by traditional and scientific fishing gear (Auster et al. Reference Auster, Gjerde, Heupel, Watling, Grehan and Rogers2011) such as trawls, grabs or dredges due to their over-dispersed distribution on the seabed and low catchability. The recent development of underwater video devices (Mallet & Pelletier Reference Mallet and Pelletier2014) could provide an alternative sampling method.
The vulnerability of mega-epibenthic species can be difficult to assess based on video data in the absence of empirical knowledge of species’ responses to trawling (Certain et al. Reference Certain, Jørgensen, Christel, Planque and Bretagnolle2015), compounded by difficulties in identifying fauna to a species level. Using traits that can be visually assessed (e.g. size or position on the substratum) at both fine (species) and high (often genus) taxonomic levels can circumvent these limitations.
Several biological and life-history traits allow assessment of vulnerability to trawling activities, such as feeding type, mobility and fragility (Tillin et al. Reference Tillin, Hiddink, Jennings and Kaiser2006; Hily et al. Reference Hily, Le Loc'h, Grall and Glémarec2008; Thrush & Dayton Reference Thrush and Dayton2010), and these have been used in different vulnerability assessment frameworks (Bremner et al. Reference Bremner, Rogers and Frid2006a; de Juan et al. Reference de Juan, Demestre and Thrush2009; Tyler-Walters et al. Reference Tyler-Walters, Rogers, Marshall and Hiscock2009; Bolam et al. Reference Bolam, Coggan, Eggleton, Diesing and Stephens2014; Costello et al. Reference Costello, Claus, Dekeyzer and Tyler-walters2015). Traits can be partitioned into response traits, characterizing species responses to environmental disturbances or changes in resources availability, and effect traits, defining taxa that affect ecosystem properties (Lavorel & Garnier Reference Lavorel and Garnier2002; Beauchard et al. Reference Beauchard, Veríssimo, Queirós and Herman2017). Among these frameworks, de Juan and Demestre's (Reference de Juan and Demestre2012) focus on traits that can be visually assessed rather than life-history traits appears to be particularly suited to video surveys in areas with strong knowledge gaps in terms of species biology and demography. The framework assesses a taxon's response to trawling disturbance and clusters them into vulnerability groups according to: (1) position on the substratum, determining exposure to the gear; (2) feeding type (e.g. scavengers can feed on dead or damaged individuals, or filter feeding may be clogged by re-suspended sediments); (3) mobility, characterizing the ability of individuals to escape; (4) size, dictating selectivity of a trawl net; and (5) presence of a hard external body structure, preventing the individuals from being damaged (Tillin et al. Reference Tillin, Hiddink, Jennings and Kaiser2006; Hily et al. Reference Hily, Le Loc'h, Grall and Glémarec2008; de Juan et al. Reference de Juan, Demestre and Thrush2009; Thrush & Dayton Reference Thrush and Dayton2010) (Table S1, available online).
The Grande Vasière in the northern part of the Bay of Biscay is a historical fishing ground and has been exploited for many years. Although the negative impacts of trawling have been documented worldwide (Watling & Norse Reference Watling and Norse1998; Gray et al. Reference Gray, Dayton, Thrush and Kaiser2006; Kaiser et al. Reference Kaiser, Clarke, Hinz, Austen, Somerfield and Karakassis2006; Clark et al. Reference Clark, Althaus, Schlacher, Williams, Bowden and Rowden2016), the few studies that investigated biodiversity in this area found no direct and tangible link between the observed biodiversity patterns and fishing pressure (Blanchard et al. Reference Blanchard, Le Loc'h, Hily and Boucher2004; Vergnon & Blanchard Reference Vergnon and Blanchard2006). This raises the question of whether the magnitude of environmental variations mask correlations between biodiversity patterns and trawling intensity. The main goals of this study were therefore: (1) to map patterns of vulnerability to trawling based on the response traits of organisms encountered on underwater video footage routinely acquired for the Nephrops stock assessment; (2) to analyse the relative density of vulnerability groups in order to evaluate whether there are associations between groups or whether some tend to be dominant; and (3) to disentangle the relative impacts of environment and trawling in terms of explaining vulnerability patterns.
METHODS
Study area
The Grande Vasière is located on the continental shelf in the northeastern Bay of Biscay. The area is 225 km long by 40 km wide and stretches from Penmarc'h cape (47°48N) to Rochebonne cape (46°10N), covering c. 12 000 km2 (Hily et al. Reference Hily, Le Loc'h, Grall and Glémarec2008). The sampling sites had a depth range of 66–133 m. The substratum is composed of a mosaic of sediments (Bouysse et al. Reference Bouysse, Lesueur and Klingebiel1986): fine sediments containing >75% fine mud (‘mud>75%’), >25% fine mud (‘mud>25%’), carbonate mud (‘carbo_mud’), calcareous mud (‘calc_mud’) and lithoclastic mud (i.e. sandy mud; ‘litho_mud’) (Fig. 1). Average temperature, salinity and speed currents on the seabed were extracted from the model MARS3D (Lazure et al. Reference Lazure, Garnier, Dumas, Herry and Chifflet2009) for the year 2014.
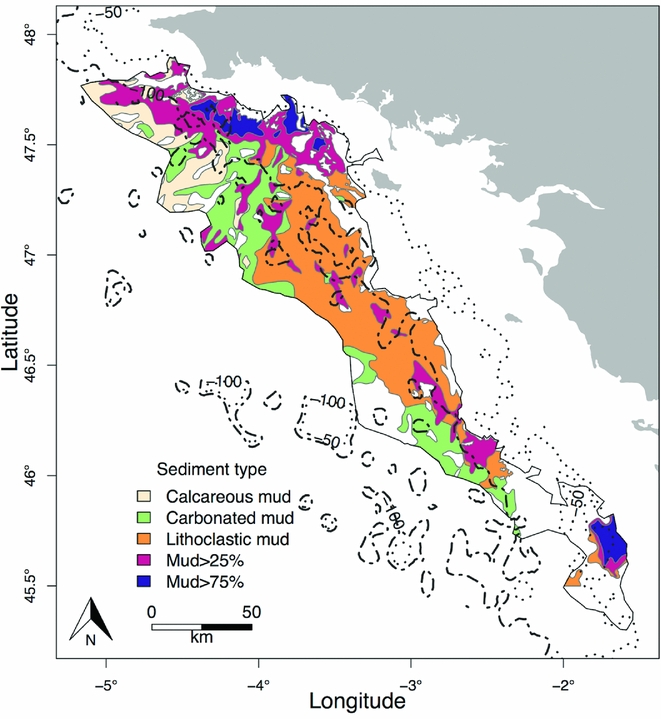
Figure 1 Map of the different substrata types over the Grande Vasière.
Data collection
Videos of the seabed were recorded using a camera (Kongsberg OE14-366, 0.48 megapixel) fixed on a sledge dropped onto the seabed and towed behind the Celtic Voyager RV for 10 minutes in September 2014. The sledge was equipped with CTD and global positioning system devices recording depth and geographic position, as well as two lasers, spaced 0.75 m apart, that delineated the area covered by the camera (calibrated for a consistent spacing of the area filmed). The locations of 152 sampling sites were chosen along a regular square grid of 8.7 × 8.7 km resolution, built from a first point picked randomly inside the limits of the study area. At each site, a video transect was recorded at an average speed of 0.85 knots. Transects covered a mean length of 183.7 m, corresponding to a mean area of 137.7 m2.
Each individual recorded on the videos was identified to the lowest possible taxonomic level. The first seven complete minutes with sufficient visibility for taxonomic identification were used to count individuals (Lordan et al. Reference Lordan, Doyle, Bunn, Fee and Allsop2011). A total of 39 taxa were identified (Table S2). When identification at the lowest taxonomic level was not possible, we clustered individuals at a higher taxonomic level ensuring sufficient consistency in biological traits. For instance, individuals clustered as Actinopterygii are all mobile, swimming in the water column and without a hard external structure. Abundances per minute were summed to obtain the total abundance of each taxon per transect. These values were then divided by the distance covered by the sledge over the selected minutes multiplied by 0.75 m to obtain a standardized density value per m2. Taxonomic richness was also estimated for each transect.
Vulnerability assessment
The methodology of de Juan and Demestre (Reference de Juan and Demestre2012) was used to assess the vulnerability of benthic communities to trawling disturbance. This framework is based on the use of functional traits from morpho-anatomical and behavioural characteristics (i.e. position on the substratum, mobility, size, feeding habits and fragility). Scores from 0 to 3 were attributed to each biological trait and then summed for each taxon to obtain a total vulnerability score per taxon (Tables S1 and S2). The taxa that were the least vulnerable to trawling disturbance had the lowest scores and were classed in group A, while the most vulnerable taxa, with the highest scores, were classed in group D. Assessment of scores may vary across the sources of information (e.g. online database or local expert knowledge) and following the plasticity of traits, but is robust to minor changes in scores (Hewitt et al. Reference Hewitt, Julian and Bone2011). Consequently, one scoring is likely to be specific to a dataset and an environmental context.
Densities of the taxa were summed per vulnerability group at each sampling station. In the absence of biomass data, all species are thus considered as equivalent regardless of their size. To map the vulnerability patterns, densities of each vulnerability group were interpolated among stations using the inverse distance weighting interpolation method under QGIS version 2.12.1-Lyon (Fig. 2).

Figure 2 Spatial patterns of vulnerability and trawling intensity in the Grande Vasière. The distributions of group A (a), group B (b), group C (c) and group D (d) were interpolated for the illustration. Trawling intensity is expressed as the number of fishing hours per 3’ × 3’ cell grid from April to September 2014.
A visual investigation of how vulnerability groups occur together was then conducted, following Jørgensen et al. (Reference Jørgensen, Planque, Thangstad and Certain2016). Percentages of each group were plotted on pie charts to display how the groups were distributed at each site.
Explaining spatial patterns of vulnerability
We investigated the patterns of density distribution of the vulnerability groups as a function of environmental variables (depth, sediment type, longitude and latitude, as well as current, salinity and temperature at the seabed level) and trawling intensity. We used fishing effort (hours) as a proxy of trawling intensity. Access to official data was provided by the French Direction of Maritime Fisheries and Aquaculture (DPMA) for fishing vessels >12 m. These data were standardized outputs from the IFREMER SACROIS algorithm (Demaneche et al. Reference Demaneche, Begot, Gouello, Habasque, Merrien, Leblond, Berthou, Harscoat, Fritsch, Leneveu and Laurans2010) that filters vessel monitoring system data according to vessel speeds (<4.5 knots) and the distance to the nearest port in order to select records assumed to correspond to fishing operations. Data can be delivered at a 10’ × 10’, 3’ × 3’ or 1’ × 1’ resolution. We selected the 3’ × 3’ resolution, which was the closest to the resolution of our biological sampling grid (8.7 × 8.7 km). Spatial mismatch between the very local scale of biological data collected at one transect and the larger scale of fishing effort data is not considered as critical here since the mismatch can be reduced by the homogenization of effort occurring over the years inside the same grid cell (Ellis et al. Reference Ellis, Pantus and Pitcher2014) and trawling effort used is representative of the recent period (average landings and exploitation patterns were stable; ICES, 2016b).
We considered the period from the beginning of April to the end of September 2014, which corresponds to the Nephrops fishing season (the dominant fishing activity in terms of trawling in the area), and sum the weekly fishing hours of trawling in each grid cell.
Collinearity among variables was investigated using the variance inflation factor (VIF) coupled with a stepwise selection and a release threshold of VIF >2.5 when both variables were quantitative, as well as a Kruskal–Wallis test for relationships between quantitative and qualitative variables. Then, a generalized linear model (GLM), fitted with a negative binomial error distribution to handle over-dispersion, was used to investigate which environmental and trawling variables influenced the density distribution of each vulnerability group. Commercial and non-commercial taxa have different relationships with trawling that targets commercial species. For this reason, we constructed GLMs on commercial and non-commercial taxa separately in the cases of groups A and B, which are the only two groups containing both fractions (see Table S3 and Fig. S1). We expressed the density distribution of each vulnerability group as a function of the explanatory variables and their quadratic terms. We also included interaction terms and the spatial coordinates of the sites (i.e. linear and quadratic terms of longitude and latitude) to account for the significant spatial autocorrelation of the density (all groups together) distribution (Moran's I = 0.58; p = 1.00E−3). We also included an offset of the log-transformed area sampled to account for bias in the estimation of the density per station.
For each GLM, the most significant variables were selected using stepwise procedures (stepAIC function in R). We compared the results of two stepwise procedures based on the Akaike Information Criterion and the Bayesian Information Criterion, respectively (Lelièvre et al. Reference Lelièvre, Vaz, Martin and Loots2014). The two models selected were then compared with a Taylor diagram (Taylor Reference Taylor2001) to select the best model. Finally, the goodness of fit of the selected models was assessed by performing a χ 2 test between the null and the selected model. Analyses were performed in R version 3.2.3 (R Development Core Team 2015) (see Supplementary Material for details on the packages used).
RESULTS
Trawling intensity
From the beginning of April to the end of September 2014, fishing effort ranged from 0.16 to 979.20 fishing hours over the Grande Vasière, with an average per grid cell of 236.30 fishing hours. This corresponds to a swept area ranging from 0.05 to 342.70 km2 and a trawling frequency ranging from 0.003 to 16.20 trawls year−1 (Eigaard et al. Reference Eigaard, Bastardie, Breen, Dinesen, Hintzen, Laffargue, Mortensen, Nielsen, Nilsson, O'Neill, Polet, Reid, Sala, Sköld, Smith, Sorensen, Tully, Zengin and Rijnsdorpa2016; see Supplementary Material). Trawling intensity was not homogeneous over the area, with the highest trawling intensity exerted along the coastline (Fig. 2). In contrast, intensity was lower offshore (<50 fishing hours over the studied period), leading to a relationship between trawling intensity, depth and current.
Distribution and co-occurrence of vulnerability groups
Group A, composed of the taxa least vulnerable to trawling disturbance, was mainly present in the north and at the southern end of the area, where the trawling pressure is the strongest (Fig. 2(a)); it included Nephrops, angular crab and other non-identified crabs and shrimps (Table S2). Group B was observed in the central and southern areas (Fig. 2(b)); it contained slightly more vulnerable taxa, mostly fish (Table S2). Group C was composed of non-mobile taxa, crinoids and Pennatulacea, for instance, and was clustered on the external border (Fig. 2(c)). Finally, group D consisted of the most vulnerable taxa (i.e. hydrozoans and Alcyonacea), which mainly occurred in the central and southern external border (Fig. 2(d)).
Group C tended to be dominant at the sites in which its species occurred (Fig. 3). Individuals of this group were mostly crinoids (85% of the group total density). In a similar fashion, group D was dominated by hydrozoans (98% of the group total density). The densities of groups A and B were more balanced between the dominant species: crabs, shrimps and Nephrops accounted for 90% of group A's total density, while Actinopterygii and squat lobster represented 89% of group B's total density. Individuals from groups A and B often occurred together at the same site, as did individuals from groups B and D. Conversely, individuals from groups C and D were rarely found together in high proportions.
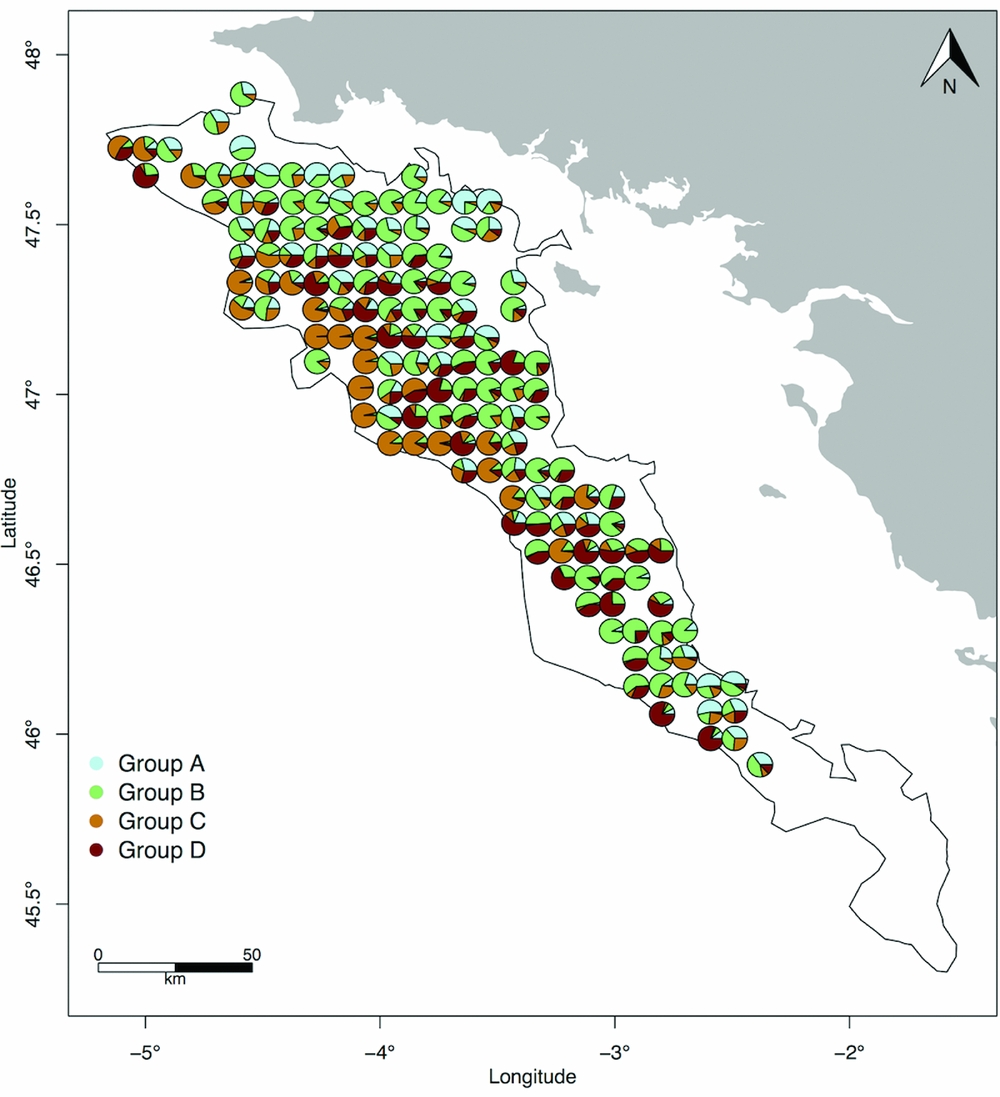
Figure 3 Relative densities of vulnerability groups expressed as the number of individuals of a given group over the overall number of individuals occurring at each site.
Factors influencing vulnerability patterns
All final models appeared to be significantly better than null expectations and no interactions were significant regardless of the vulnerability group (Table 1). The stepwise selection procedure retained at least depth or longitude in each GLM (Table 1). Overall, selected models included quadratic terms, highlighting the complexity and non-linearity of relationships between the distributions of each group and environmental and fishing variables.
Table 1 Outcomes of the stepwise selection procedure on the generalized linear models. The departure of the deviance of the model from the deviance of the null model was tested with a χ 2 test. The significance of each variable was then tested with a χ 2 test whose p-value is given in the ‘Significance’ column.
The distribution of the least vulnerable group, group A, was influenced negatively but non-linearly by depth (Table 1 and Fig. 4). Likewise, the distribution of group B's density was positively and non-linearly influenced by longitude (Fig. 4). Only groups A and B clustered commercial and non-commercial species. When testing environmental and fishing variables against density patterns of each fraction separately, only patterns of commercial taxa differed from previous results (Table S3 and Fig. S1). In both groups A and B, as expected, density patterns of commercial taxa depended on trawling intensity only (Table S3 and Fig. S1). Both depth (and its quadratic term) and current significantly predicted the density pattern of group C. Finally, the distribution of group D's density varied according to all variables except current, and was the only group to be significantly influenced by trawling intensity and sediment type (Table 1 and Fig. 4).
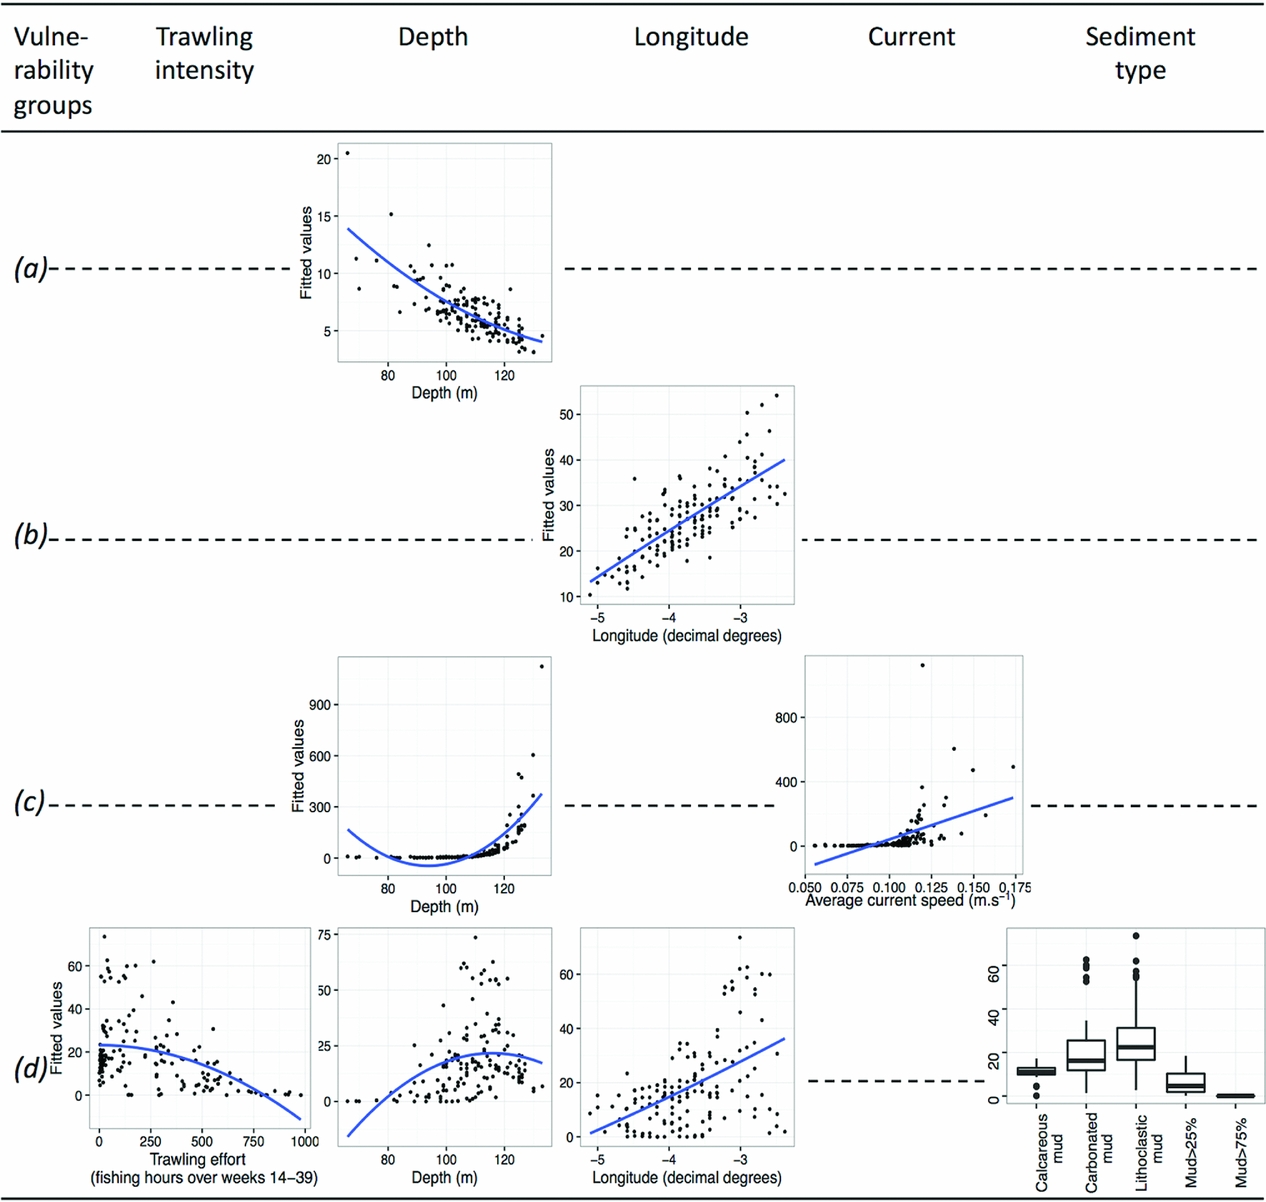
Figure 4 Relationships between the fitted values of the final generalized linear model and the explanatory variables selected (trawling intensity, depth, longitude, current or sediment type) for each of the vulnerability groups A (a), B (b), C (c) and D (d). Linear or second-order polynomial smoothing was fitted to the data depending on whether the relationship with the variable was linear or quadratic.
DISCUSSION
The occurrence of taxa at a site results from environmental constraints and competitive interactions (Weiher & Keddy Reference Weiher and Keddy2001). The vulnerability assessment made here relates to the former, with depth, longitude, current, sediment type and trawling intensity shown to be important constraining environmental conditions in the Grande Vasière.
The distribution of the least vulnerable taxa (group A) seems weakly related to trawling intensity. These small, mobile taxa with a hard shell are less vulnerable to trawling disturbances than other taxa, and they dominated where trawling intensity was the strongest. Many taxa from this group are scavengers such as Nephrops, sea stars and some crustaceans (Thiel & Watling Reference Thiel, Watling, Thiel and Watling2015). Trawling damages animals living on the seabed, thus providing a food source for scavengers (Kaiser & Spencer Reference Kaiser and Spencer1996).
The slightly more vulnerable group B is mainly composed of fish taxa, and occurred in higher density in the south. This observed longitudinal gradient in the group B pattern most likely originated from complex relationships among unmeasured factors (see below).
The overall density patterns of groups A and B were likely driven by non-commercial taxa, which represented 74% of the group A total density and 93% of the group B total density, the latter being dominated by squat lobster and small, non-commercial Actinopterygii. The density patterns of the commercial taxa were significantly driven by trawling intensity. We assume that the positive relationship in the case of group A comes from an expected spatial overlap between fishery activities and the density patterns of Nephrops, which happens to be the only commercial species of this group and is one of the most targeted species in this area. Conversely, the negative relationship of the commercial taxa of group B with trawling intensity might originate from the ability of these mobile taxa to avoid heavily trawled areas or may result from a local depletion of their numbers due to their catch by trawlers.
The two most vulnerable groups, groups C and D, included non-mobile taxa and large filter feeders. The density of group C tended to increase in areas where the current was the strongest, which is typical for the feeding type of this group. This result has to be considered in the light of the correlations between depth, current and trawling intensity, which remain strong after the VIF selection. The stepwise selection can be sensitive to collinearity among explanatory variables. Thus, we suspect that the significant negative effect of trawling intensity on group C in the complete model (results not shown) could have been masked by depth and/or current during the stepwise procedure. Unravelling the pure effect of trawling intensity from the effect of depth and current is difficult in the absence of a reference state, as these variables are interrelated (Handley et al. Reference Handley, Willis, Cole, Bradley, Cairney, Brown and Carter2014). Indeed, the distribution of group C is limited to the external border of the Grande Vasière, where depth reaches 120 m and trawling intensity is very low due to hard substrates hindering trawling activities. The distribution of group D showed marked environmental preference for deeper (100–120 m depth) southern and less trawled stations of lithoclastic and carbonated mud. The spatial mismatch between trawling intensity and the level of vulnerability of communities agrees with other studies (Bremner et al. Reference Bremner, Rogers and Frid2006a, Reference Bremner, Rogers and Frid2006b; Tillin et al. Reference Tillin, Hiddink, Jennings and Kaiser2006; Hinz et al. Reference Hinz, Prieto and Kaiser2009; de Juan et al. Reference de Juan and Demestre2012; Jørgensen et al. Reference Jørgensen, Planque, Thangstad and Certain2016). The negative co-occurrence between groups C and D likely results from diverging environmental preferences, since the taxa forming group C were found on carbonated mud, while the highest densities of taxa forming group D were on lithoclastic mud.
Although our results show that environmental factors mainly drive the density patterns of all groups, we cannot exclude that the north–south gradient observed for groups B and D partly encapsulates unmeasured environmental parameters like dissolved oxygen, the mobility of sediments or the amount of organic carbon (Bremner et al. Reference Bremner, Rogers and Frid2006b). Extreme events (e.g. storms) can impact the seabed (Watling & Norse Reference Watling and Norse1998), but during summer – the more intensive fishing season – resuspension generated by trawling locally exceeds the storm impact (Mengual et al. Reference Mengual, Cayocca, Le Hir, Draye, Laffargue, Vincent and Garlan2016).
Trawling activities could alter the physical structure of the habitats. In the Grande Vasière, Hily et al. (Reference Hily, Le Loc'h, Grall and Glémarec2008) noted a significant decrease in the mud and coarse fraction from 19.8% to 9.1% of the total sampled area since the first extensive study of the area by Glémarec (Reference Glémarec1969). Simultaneously, the sand fraction increased from 50.5% to 68.3%. A homogenization of the type of substrata occurred and an ‘intermediate’ sediment, which was neither very muddy nor very coarse, became dominant. Penetrable substrata are the preferred habitats of burrow builders like Nephrops or crabs (Bremner et al. Reference Bremner, Rogers and Frid2006b), which could be disadvantaged by the shift towards an increase in the sandy fraction (Campbell et al. Reference Campbell, Allan, Weetman and Dobby2009). In the same way, the increase in the sandy fraction could be a threat to filter feeders, such as Pennatulacea or sea anemones that are present on muddy/sandy sediments.
Underwater video can offer a valuable complement to dredge-and-trawl sampling techniques in the evaluation of trawling impacts (Smith et al. Reference Smith, Banks and Papadopoulou2007) and allows for the assessment of changes over larger areas (Hewitt et al. Reference Hewitt, Julian and Bone2011). In particular, the direct visualization of the seabed habitats provides access to unprecedented information, such as the unexpected occurrence of species that are either damaged by conventional trawling surveys or are able to escape. Using non-extractive methods during scientific surveys should be encouraged, especially when fragile species are present. This idea is illustrated by the recording of the sea pen Pennatula phosphorea, which is considered rare, at 76 stations among the 152 sampled in this study. A total of 39 observed taxa were found in trawled areas, including 33 from groups A and B, indicating that the number of taxa is not affected by trawling disturbance. However, the underwater video technique samples only large (>5 cm) epifauna and often cannot be used to identify taxa into species. The use of morphological traits from individuals identified at different taxonomic levels conserves the community structure and richness patterns and leads to results in community analysis that are similar to those at higher taxonomic resolutions (Brind'Amour et al. Reference Brind'Amour, Laffargue, Morin, Vaz, Foveau and Le Bris2014). The vulnerability of individuals thus appears to depend more on their morpho-anatomical characteristics than on their taxonomic classification. The assessment of vulnerability conducted in this study based on biological traits is therefore not penalized by the use of different taxonomic levels and can be compared to the approach by morphospecies of Howell et al. (Reference Howell, Mowles and Foggo2010).
Our assessment contributes to an integrated assessment of the resilience and resistance of this system. The European Marine Strategy Framework Directive for the evaluation of the overall state of marine ecosystems requires describing of the dynamics, the resilience and the resistance of communities to trawling disturbance using more biological traits (e.g. life-history traits such as longevity or reproduction) and biomass (Kaiser et al. Reference Kaiser, Clarke, Hinz, Austen, Somerfield and Karakassis2006; Tillin et al. Reference Tillin, Hiddink, Jennings and Kaiser2006), which are unavailable for many of the taxa considered here. The year 2014 can be considered as representative of the recent period (ICES 2016b); however, fishing intensity based on a single year is likely not representative of mid- or long-term trends in fishing activities. Thus, the timescale considered here does not permit the inferring of processes linking biodiversity patterns, environmental conditions and fishing activities, which was beyond the scope of our study.
An accurate evaluation of the health status of ecosystems would require the definition of a reference state before the intensification of anthropogenic pressures. However, no usable information about historical states is available for this area, and any decline in the abundance of vulnerable taxa might have occurred before any modern monitoring (Roberts Reference Roberts2010). Communities of the Grande Vasière might have already been shaped by fishing activities that can be considered as moderate to high compared to adjacent areas (Eigaard et al. Reference Eigaard, Bastardie, Breen, Dinesen, Hintzen, Laffargue, Mortensen, Nielsen, Nilsson, O'Neill, Polet, Reid, Sala, Sköld, Smith, Sorensen, Tully, Zengin and Rijnsdorpa2016). Without a documented reference state, it is challenging to state that a species is absent from an area because it disappeared in response to excessive fishing pressure, or if the species was never present due to habitat preferences and ecosystem interactions.
This study is a first step in the direction of an integrated management of fisheries in the Grande Vasière based on knowledge of the distributions of vulnerable species. To our knowledge, this is the first study evaluating biodiversity vulnerability based on recorded videos routinely acquired for stock assessment. Such trait-based approaches to mapping the vulnerability level of species and communities could easily be generalized to other fishing grounds surveyed for stock assessment using video and should be very relevant to identifying priority areas for management intervention.
ACKNOWLEDGEMENTS
The authors are deeply indebted to the National Committee for Maritime Fisheries and Fish Farming (CNPMEM) and to the French Directorate of Marine Fisheries and Aquaculture (DPMA) who accepted to provide the vessel monitoring system data to the team from the French Fisheries Information System (SIH), who processed the data. All data used were aggregated so that the confidentiality of vessels was not compromised. Thanks are expressed to the LANGOLF-TV team for video acquisition, as well as the staff of the Celtic Voyager RV and the Marine Institute of Ireland for their contribution to the data collection. We also thank Mickaël Vasquez (IFREMER-DYNECO-LEBCO) for the data extraction from the MARS3D model.
FINANCIAL SUPPORT
This work was part of the TETRIS project supported by France Filière Pêche.
CONFLICT OF INTEREST
None.
ETHICAL STANDARDS
None.
Supplementary material
For supplementary material accompanying this paper, visit https://doi.org/10.1017/S0376892917000480


