


INTRODUCTION
Over half of the world's wetlands occur in the tropics and subtropics (Mitsch & Gosselink Reference Mitsch and Gosselink2007), but fundamental understanding of how wetland biota responds to biophysical changes in these zones is limited. It is, however, in the emerging and developing economies of the tropics that these ecosystems are most susceptible to further degradation, mainly due to aggressive plans for agricultural conversion and water resource developments (Kareiva Reference Kareiva2012).
Spatial distribution models of species in the tropics are limited to those areas where biological monitoring has occurred (Rodríguez Reference Rodríguez2003). The Florida Everglades, for example, is the best studied wetland in the subtropics (Junk et al. Reference Junk, Brown, Campbell, Finlayson, Gopal, Ramberg and Warner2006), where spatial models of distribution of multiple aquatic and terrestrial animals have been developed (DeAngelis et al. Reference DeAngelis, Gross, Huston, Wolff, Fleming, Comiskey and Sylvester1998; Gaff et al. Reference Gaff, DeAngelis, Gross, Salinas and Shorrosh2000). These models, however, incorporate an understanding of complex biophysical and food web interactions provided by decades of monitoring and research.
In contrast, the Tonle Sap in Cambodia remains one of the least explored large wetlands in the world (Parolin & Wittmann Reference Parolin and Wittmann2010; Junk et al. Reference Junk, Brown, Campbell, Finlayson, Gopal, Ramberg and Warner2006). Knowledge of ecological properties and interactions in the Tonle Sap is limited (Lamberts Reference Lamberts2006; Kummu et al. Reference Kummu, Sarkkula, Koponen and Nikula2006), yet this wetland is facing many ecological changes as a result of imminent disruptions to its hydrology (Kummu & Sarkkula Reference Kummu and Sarkkula2008). Hydrological changes in the Mekong basin caused by hydropower and climate change will result in a modified flood pulse, mainly through reductions in seasonal water level variability homogenizing the system (dams) and increasing interannual uncertainty (climate change) (Lauri et al. Reference Lauri, de Moel, Ward, Räsänen, Keskinen and Kummu2012). These hydrological changes may in turn result in permanent alteration of habitats (Arias et al. Reference Arias, Cochrane, Kummu, Killeen, Piman and Caruso2012).
The Tonle Sap is the largest wetland in South-east Asia, located north-west of the Cambodian capital, Phnom Penh (Fig. 1). It is a complex hydroecological system, directly connected to the Mekong River through the largest natural freshwater flow reversal system in the world. The surface hydrology and flood pulse of the Tonle Sap is driven by the South-east Asian monsoon regime, which brings c. 65% of the total annual rainfall to the Mekong Basin between July and October (MRC [Mekong River Commission] 2005). Fifty-four per cent of the annual flow into the Tonle Sap comes directly from the Mekong River via the Tonle Sap River, 34% from the 11 tributaries to the Tonle Sap catchment, and 12.5% from precipitation (Kummu et al. Reference Kummu, Tes, Yin, Adamson, Józsa, Koponen, Richey and Sarkkula2013). During the dry season (October–May), the Tonle Sap River discharges at a maximum rate of 10000 m3s−1 from the lake towards the Mekong (Inomata & Fukami Reference Inomata and Fukami2008). At the end of this period of normal flow, the lake reaches a minimum monthly depth of 1.5 m, with a water surface area of 2600 km2. When the monsoon reaches the Mekong basin, the level of the river rises to a much higher level than the Tonle Sap, forcing the Tonle Sap River to reverse its flow towards the lake. This phenomenon causes the lake's water depth to increase by 9 m and its surface area to increase by 12000 km2. At the peak of the flood (between the end of September and the beginning of October), the total flood extends over 15000 km2. Flood duration varies across the floodplain, from a few days at the outer edge of the floodplain, to 9–11 months in the gallery forest at the edge of the permanently inundated area of the lake. The average flood duration over the entire floodplain is 5.4 ± 3.9 months per year. These extreme conditions, and the marked interphase between aquatic and terrestrial environments, provide the foundation for all major geochemical processes, ecological interactions and human activities interplaying in the Tonle Sap.
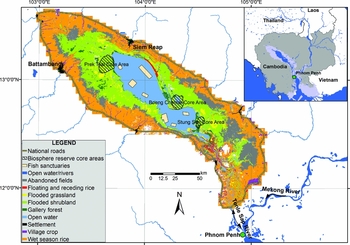
Figure 1 Overview map of the Tonle Sap wetland area. LULC map derived from 2005 aerial photography (Eng & Ouch Reference Eng and Ouch2006).
Both anecdotal and scientific evidence suggest that fauna in the Tonle Sap are highly dependent on the habitat type (Bonheur & Lane Reference Bonheur and Lane2002; Davidson Reference Davidson2006). For instance, migratory fish species access the seasonally flooded habitats to feed during the wet season, while resident fish species inhabit these areas at various points during their life cycles (Valbo-Jørgensen et al. Reference Valbo-Jørgensen, Coates, Hortle and Campbell2009). Moreover, seven species of water snakes, which are subject to the largest snake harvest on the planet, are permanent residents of the gallery forest and adjacent habitats (Brooks et al. Reference Brooks, Allison, Gill and Reynolds2009). Some fish species of the Tonle Sap are reliant on the nutrient-rich habitats made available during the flood pulse aquatic phase to complete their life-cycles; others require the refugial ponds created by the inundation of the habitat to survive the dry season. Various endangered bird species inhabit the Tonle Sap, most of which have particular habitat preferences; for example, the grey-headed fish-eagle (Ichthyophaga ichthyaetus) is typically found in forested areas (Tingay et al. Reference Tingay, Nicoll, Whitfield, Visal and McLeod2010), whereas the Bengal florican (Houbaropsis bengalensis) is predominantly found in grasslands (Gray et al. Reference Gray, Borey, Hout, Chamnan, Collar and Dolman2009). The close linkage of these species to their habitats and the restrictions that this imposes suggests that flooding and annual cyclical changes of habitats in the Tonle Sap are crucial for maintaining biological productivity and biodiversity.
The Tonle Sap is home to a large human population that subsists on the wetland's resources. Based on a 1998 survey, 1.2 million people inhabited the Tonle Sap, and nearly 70% of them were subsistence farmers and fishers (Keskinen Reference Keskinen2006). The population had grown to 1.7 million by 2008 and, although the greatest growth rates occurred in the urban areas, the majority of the population are still dependent on agriculture and fishing (Keskinen et al. Reference Keskinen, Kummu, Salmivaara, Paradis, Lauri, de Moel, Ward and Sokhem2011). The vast majority of the protein that the Tonle Sap inhabitants eat comes directly from fish and other aquatic organisms harvested in the open lake and inundated habitats (Hortle Reference Hortle2007, after Ahmed et al. Reference Ahmed, Hap, Ly and Tiongco1998). Moreover, agricultural fields (mainly rice paddies) are an integral component of the Tonle Sap that represent nearly one-third of the wetland area. Human activities are thus an important factor of the Tonle Sap ecosystem, which imposes the greatest challenge to fauna conservation. In addition to changes in habitat resulting from future hydrological changes, any conservation management planning will need to incorporate an understanding of how hydrological changes will affect human activities on and around the wetland.
The importance of the Tonle Sap for biodiversity and livelihoods has recently drawn significant international and regional interest in conservation and management efforts. In 1997, the United Nations Educational, Scientific and Cultural Organization (UNESCO) established the Tonle Sap as Cambodia's only Biosphere Reserve (UNESCO 2010), and the Cambodian government established the Tonle Sap Authority (TSA) agency in 2007 to coordinate management, conservation and development plans at the ministerial level (Keskinen & Varis Reference Keskinen and Varis2012). Moreover, recognizing its importance, many international conservation organizations, including the Wildlife Conservation Society, Conservation International, the World Wildlife Fund, and Flora and Fauna International have developed monitoring and conservation programmes in the Tonle Sap and adjacent ecosystems.
It is essential that these conservation efforts consider spatial planning in an adaptive and dynamic way, particularly under the inevitable scenarios of rapid and imminent changes in hydrology and population. Given that physical function of the Tonle Sap wetland is well understood, but biological data are limited, development of a spatial modelling framework is a logical way to simulate potential scenarios and impacts of change using established general relationships between fauna and biophysical properties. Such a framework will not only help guide spatial conservation planning, but will also facilitate communication to stakeholders of the future impact on fauna of hydrological changes in the basin.
The main objective of this paper is to quantify the predicted impacts of hydrological alterations on fauna in the Tonle Sap. We first present a database of key animal species and associated habitat usage. We then introduce a modelling framework to link this database to maps of historical and future flood duration and habitats, which are then used to estimate future changes in the area of habitat use. Finally, we highlight how this analysis should be incorporated in spatial conservation planning in the region and how restoration efforts may be possible under future scenarios. The information provided in this paper focuses on the Tonle Sap, but the modelling framework is equally informative to conservation of the broader floodplain wetlands of the Mekong and other tropical freshwater ecosystems subject to modified hydrological changes.
METHODS
The modelling framework presented in this paper uses available biophysical and fauna characteristic datasets and geoprocessing algorithms to create maps of fauna habitat suitability and potential future changes (Fig. 2). Spatial analysis was carried out with a digital elevation model (DEM) derived from bathymetry and topography surveys in the open water and throughout most of the floodplain, and complemented with data from the shuttle radar topography mission (SRTM) in the upland regions (Kummu & Sarkkula Reference Kummu and Sarkkula2008). The DEM had a 100 m horizontal resolution and a vertical range of 0–15 m above sea level. Historical daily water levels in the open water were obtained from the MRC. A land use/land cover (LULC) map derived from aerial and Landsat satellite imagery from 1995–1996 (JICA [Japanese International Cooperation Agency] 1999) was used as a surrogate of historical habitats and land use. Projected water levels under future scenario of hydropower development and climate were derived from two basin-wide hydrological models (Lauri et al. Reference Lauri, de Moel, Ward, Räsänen, Keskinen and Kummu2012; Piman et al. Reference Piman, Lennaerts and Southalack2013).

Figure 2 Process flow of modelling framework for mapping likely fauna habitat.
Information on fauna was extracted from publications that reported species-specific habitat preference or usage, as well as feeding and breeding habits. Published studies with the required information for our analysis were only available for selected animal species, including a limited number of fishes (Lamberts Reference Lamberts2001; Lim et al. Reference Lim, Lek, Touch, Mao and Chhouk1999), water snakes (Brooks et al. Reference Brooks, Allison, Gill and Reynolds2009), Bengal florican (Gray et al. Reference Gray, Borey, Hout, Chamnan, Collar and Dolman2009), grey-headed fish-eagle (Tingay et al. Reference Tingay, Nicoll, Whitfield, Visal and McLeod2010), aquatic invertebrates (Tanaka & Ohtaka Reference Tanaka and Ohtaka2009), and zooplankton/zoobenthos (Ohtaka et al. Reference Ohtaka, Watanabe, Im, Chhay and Tsukawaki2010). Data for other species were inferred by synthesizing Tonle Sap biodiversity data with generally available life-history characteristics (Bonheur & Lane Reference Bonheur and Lane2002; Campbell et al. Reference Campbell, Poole, Giesen and Valbo-Jorgensen2006; Davidson Reference Davidson2006). Seven categories of information were gathered for each species, including diet, breeding time, breeding location and likely location during each of the four seasons dictated by the water regime, namely the rising season (June–August), wet season (September–November), receding season (December–February) and dry season (March–May).
The DEM and historical water level records were combined to create maps of annual flood duration. LULC classes were associated with spatial patterns of flood duration, and this relationship was used to define five habitat groups according to historical flood patterns: namely open water, gallery forests, seasonally flooded habitats (composed of shrublands and grasslands), transitional habitats (composed of abandoned fields, floating/receding rice and lowland grasslands) and rain-fed/agricultural habitats (composed of wet season rice, village crops and lowland shublands) (Arias et al. Reference Arias, Cochrane, Kummu, Killeen, Piman and Caruso2012). If there were no changes in the flood duration, we assumed that the original land use remained the same. If there was a change in the flood duration for a specific area, the area was reclassified to the most common LULC class within the new habitat group.
Changes to the historical water levels caused by hydropower and climate change were used to estimate flood duration and LULC maps for multiple future scenarios. In this paper, we illustrate the methodology with two scenarios representing different levels of water infrastructure development in the Mekong Basin. The first scenario represents the definite future conditions for c. 2015, and considers 47 hydropower dams plus irrigation and water supply demand (Piman et al. Reference Piman, Lennaerts and Southalack2013). This scenario would increase average water levels during the driest months (April and May) by 10 cm and decrease water levels during the wettest months (October and September) by 19 cm (Arias et al. Reference Arias, Cochrane, Kummu, Killeen, Piman and Caruso2012). The second scenario represents the maximum hydropower capacity in the Mekong Basin according to the MRC hydropower database (MRC 2009), which includes 126 dams. This scenario would raise average water levels during the driest months by 79 cm and decrease water levels during the wettest months by 51 cm (M.E. Arias, unpublished data 2013). The application of these two scenarios represents a near future scenario of development and an extreme development scenario; however, the methodology can also be applied to any of the scenarios presented in Piman et al. (Reference Piman, Lennaerts and Southalack2013) or Lauri et al. (Reference Lauri, de Moel, Ward, Räsänen, Keskinen and Kummu2012). We also present additional results illustrating the analysis for a climate change scenario (A1b emissions scenario simulated with the ECHAM 5 global circulation model).
When comparing a future scenario to the baseline LULC map, short- and long-term changes were considered according to the expected adaptability of vegetation to the new hydrological conditions. In the short term, we expect little adaptability, thus this is represented by the fraction of the current LULC that will remain unchanged by hydrological disruptions. This approach is similar to the spatial analysis presented by Kummu and Sarkkula (Reference Kummu and Sarkkula2008). In the long term, we expect habitats to adapt to the hydrological conditions in a similar manner as currently, thus we represent long-term potential habitat shifts using a maximum likelihood approach following the concepts presented in Arias et al. (Reference Arias, Cochrane, Kummu, Killeen, Piman and Caruso2012). There will likely be a transition phase between the short and long term, rather than an abrupt change, however there are no data on vegetation succession in the Tonle Sap that would enable us to simulate gradual shifts dynamically (as they vary over time).
The LULC maps were linked to the fauna database by first determining the habitats that each animal species is likely to use in any given season based on feeding and breeding habits. If several species were found to occupy identical habitats, they were analysed together as one functional group. Total potential habitat area for each species/functional group was estimated for the baseline scenario and for the two dimensions of each hydropower scenario. Comparison between the baseline scenario and each hydropower scenario was expressed numerically as percentage change from the baseline scenario, and spatially through maps displaying the potential area lost or gained by each species.
RESULTS
Species database generalities and spatial distribution
We compiled a list of 61 animal species with documented nutritional, conservation and/or ecological value (Appendix 1, Table S1, see supplementary material at Journals.cambridge.org/ENC). This list includes 13 species of fish, 10 reptiles, 16 birds, 10 mammals and 12 invertebrates. From this list, we identified 23 species that have high nutritional value (mainly fishes and water snakes), 35 species of high conservation value because they are either threatened or because the local population is a significant fraction of the world's population, and 23 species with high ecological value because they are either at the bottom or top of the food web.
A count of species present in each of the habitats revealed the areas of the Tonle Sap that are most important for maintaining species diversity (Fig. 3). Areas covered with gallery forest, closely followed by flooded grasslands and shrublands, were found to provide habitat to the highest concentration of species. Open water provides habitat mainly to fish and aquatic invertebrates. No animals were found to use transitional habitats (lowland grasslands, abandoned fields, floating and receding rice) exclusively; most of the animals using these areas were migrating species of fish and birds that spread throughout multiple habitats during their seasonal stay in the Tonle Sap. Finally, rainfed/irrigated habitats (village crops, lowland shrublands and wet season rice) have been rarely documented as providing habitat for wildlife in the Tonle Sap.

Figure 3 Distribution of fauna species throughout the Tonle Sap. Length of annual flood duration decreases from left to right. OW = open water, GF = gallery forest, FG = seasonally flooded grasslands, FS = seasonally flooded shrublands, LG = lowland grasslands, AF = abandoned fields, TR = transitional zone rice (floating and recession rice), VC = village crops, LS = lowland shrublands, and R = rainfed/irrigated rice.
Changes under future scenarios
On-going hydropower development in the Mekong basin will result in significant flood regime shifts that could modify the spatial distribution of habitats throughout the Tonle Sap (Fig. 4). The flood pulse, or the regular seasonal water level variation, is expected to decrease as a result of higher water levels during the dry season and lower water levels during the wet season, thus homogenizing the annual cycle. Because of the extremely flat terrain, water level changes of less than 1 m would result in disproportionally large changes in spatial flooding patterns. As a result of this, we estimate that 19% (2820 km2) of the 15097 km2 study area will be subject to permanent habitat changes. These changes, however, will not be evenly distributed across the Tonle Sap; areas at the boundaries of the seasonally flooded habitats will be the most vulnerable to changes. Therefore, some of the habitats will be subject to greater shifts than others (Table 1). For instance, the expansion of the open water by 518–895 km2 (+20–35% from baseline) will permanently inundate all of the current gallery forest. However, other areas suitable for gallery forest, under adequate inundation patterns, will develop in other parts of the Tonle Sap as a result of hydrological change. We estimate that areas feasible for gallery forest regrowth in the long term will be 138 km2 and 505 km2 for the definite future and the maximum hydropower scenarios, respectively. Furthermore, the reduction of maximum flood extent will enlarge the area feasible for rain-fed/irrigated rice by 854–1259 km2, which is an increase of 38–56% from the baseline, and consequently represents a loss of habitat for alternative uses.
Table 1 Changes in potential habitat area (km2) caused by hydrological disruptions from future hydropower scenario.


Figure 4 Changes in future habitat cover as a result of hydropower. (a) Simulated baseline land use/land cover (LULC); (b) areas with projected LULC changes in the definite future scenario; (c) areas with projected LULC changes for the maximum hydropower scenario.
Projected changes in the seasonality of the Mekong hydrology as a result of climate change are expected to be less extreme than for hydropower; there is a high degree of uncertainty in the predictions depending on the global circulation model used (Lauri et al. Reference Lauri, de Moel, Ward, Räsänen, Keskinen and Kummu2012). While we opted not to focus on climate change predictions for this paper, the methodology presented is fully applicable to such scenarios. For example, we also modelled a potential climate change scenario (A1b emissions scenario simulated with the ECHAM 5 global circulation model; Appendix 1, Table S2 and Fig. S1, see supplementary material at Journals.cambridge.org/ENC).
Changes in fauna habitat
Analysis of spatial habitat patterns for particular animal species revealed that ongoing hydrological disruption will result in a net loss of habitat in both the short and long term (Table 2; Fig. 5). The most affected animals will be those that are known to use gallery forest as their primary habitat, such as the primates Macaca fascicularis and Semnopithicus cristatus, whose populations are already severely depressed in the wetland. Species, such as the Bengal florican, which are habitat specialists and thus have a restricted range, will be significantly impacted by even small losses or shifts in the habitat types. Animals that are known to use multiple habitats would likely be the least vulnerable, however, this does not account for the required use by many species of particular habitats to complete specific stages of their life cycle. For instance, large waterbirds rely on the gallery forest for nesting, but feed on a variety of other habitats where they can find their prey. A similar situation applies to both migratory and non-migratory fishes that use different habitats throughout the year. Nevertheless, habitat changes will likely have a negative impact on various species, particularly in the short term. Due to an overall predicted reduction in the flood pulse, most animals will experience a greater impact in the short term than in the long term because the combination of permanent inundation of some areas of the floodplain and drying of other areas will homogenize the system and cause rapid changes in habitat type.
Table 2 Potential habitat (area in km2) in baseline and future scenarios by representative fauna. OW = open water, GF = gallery forest, FG = seasonally flooded grasslands, FS = seasonally flooded shrublands, LG = lowland grasslands, AF = abandoned fields, TR = transitional zone rice (floating and recession rice), VC = village crops, and LS = lowland shrublands.


Figure 5 Potential habitat for representative animals and the expected gain/loss from full hydropower development in the Mekong Basin.
Many of the terrestrial and aquatic species are reliant on the gallery forest to complete stages of their life history, either on an annual basis or during their development (Appendix 1, Table S1, see supplementary material at Journals.cambridge.org/ENC). Although the overall loss of habitat is low, the loss of the essential breeding or feeding habitat will negatively affect the life history of most species. For instance, the non-migratory snakeheads (Channidae family), which have a very high nutritional value, spawn in the gallery forests that flood in June and July (Lim et al. Reference Lim, Lek, Touch, Mao and Chhouk1999). With the predicted hydrological changes, most of these forests will be permanently inundated, which could result in complete loss of spawning grounds or changes to the reproduction patterns of Channidae. Although there is future potential for new areas to be recruited to gallery forest habitat in the long term, loss of habitat will occur much more rapidly than habitat gains, and consequently have detrimental effects on the fauna of the lake.
DISCUSSION
Life history according to the flood pulse
Life histories and agricultural practices are synchronous with the seasonality of the flood pulse (Fig. 6; Hellsten et al. Reference Hellsten, Jarvenpaa and Dubrorin2003; Davidson Reference Davidson2006). During the dry season (March–May), water levels can reach as low as 1.5 m as water drains out of the Tonle Sap and the open water/permanent lake area becomes the only water. During the dry season, when the majority of the seasonally flooded habitats are dry, multiple plant species in the floodplain flower. Many adaptive non-migratory fish species remain dormant in shallow ponds or buried in the mud, whilst others mate and spawn in preparation for the flood. At this time, domestic water buffalo also roam through the floodplain grasslands. Permanent residents, including many aquatic fish, snake species, and waterbirds breed at this time, while migratory fish breed outside the Tonle Sap in upstream tributaries and then return from the Mekong and tributaries at the start of June, driven by the flow reversal into the Tonle Sap. The rising season typically begins in June, when the Tonle Sap starts receiving water from the Mekong. Seasonally flooded habitats become inundated; hence multiple plant species fruit at this time. The start of the wet season in September is dictated by a sharp decrease and eventual flow reversal of the Tonle Sap River; water levels reach a maximum of 9 m above sea level and the Great Lake is formed. Fish dispersal is at its maximum during this season; hence large-scale fishing activities are low. Some carnivorous species like Cylindrophis ruffus and Anhinga melanogaster breed during the wet season, presumably because of an increased supply of prey (fish and water snakes). The receding season starts in November and is dictated by a gradual reduction in water levels and out flow from the Tonle Sap. During this season, migratory fish flow out of the system with the river discharge, while wintering birds arrive from the northern hemisphere.

Figure 6 Major biological life history events in the Tonle Sap are synchronized with the flood pulse. See text and database for sources of information.
Disruptions will alter ecological interactions
The Tonle Sap is undergoing environmental changes that have not been experienced in more than 4000 years since it first became a flood-pulse system (Penny Reference Penny2006). Marked changes in the pollen type found in sediment cores suggest that the hydrological shift during the Holocene brought drastic changes to the surrounding biota (Penny Reference Penny2006). Although the current hydrological shift is not as dramatic as that which occurred during the Holocene, this is an indication that significant biological disruption is likely to occur as a result of contemporary changes in the system. The seasonally flooded habitat will be reduced, likely concentrating the fauna into a smaller area, changing population dynamics and prey-predator interactions. Moreover, the loss or reduction of important habitat types, such as gallery forests, flooded grasslands and flooded shrublands, on which many of the fauna rely during their life cycle, will be detrimental to the ecology, biodiversity and productivity of the lake and the system as a whole.
The buffer between natural habitats and agricultural land will probably be smaller. The reduced buffer will impose further risks to wildlife through further habitat loss and direct hunting. Villages and urban centres that surround the floodplain are growing and, in some areas of the floodplain, agriculture has expanded by reducing natural flooding using permanent control structures and reservoirs. A reduced buffer would facilitate the intrusion of humans from the settlements into the natural habitats, thus increasing the vulnerability of wildlife to hunting. In short, we predict that the ongoing and future hydrological disruptions, together with increased human intervention, will have a significant impact on the ecosystem and will impose even greater challenges to conservation and management.
Need to prioritize habitat conservation
Although habitat heterogeneity is essential to maintain species diversity, specific habitats with ‘keystone structures’ enhance animal diversity (Tews et al. Reference Tews, Brose, Grimm, Tielbörger, Wichmann, Schwager and Jeltsch2004). This is certainly true in the Tonle Sap, where we identified a particular reliance of fauna on the gallery forest and flooded shrublands, which provide the tallest and densest canopy among all habitats. Early succession habitats in this wetland, such as grasslands, abandoned fields and rice paddies, occur primarily as a result of human-driven disturbances, such as fire, cattle grazing and ploughing. These disturbances are dynamic in time and space, and have been occurring in the Tonle Sap for centuries. Although highly feasible, restoration of these disturbed habitats into forests and shrublands has not been undertaken in the Tonle Sap at any substantial scale. Implementation of a reforestation programme, including protection and planting, should focus on those areas where the environmental conditions (such as the flooding regime) will remain optimal in the long term, following the concept of assisted colonization (McLachlan et al. Reference McLachlan, Hellmann and Schwartz2007; Hoegh-Guldberg et al. Reference Hoegh-Guldberg, Hughes, McIntyre, Lindenmayer, Parmesan, Possingham and Thomas2008) and taking into consideration predicted changes to the system and the consequent habitat shifts. Regardless of whether or not replanting is undertaken, it is essential that authorities and conservationists ensure that a balance between agricultural and natural habitats is maintained by securing those areas that will be feasible for gallery forests and shrublands in the future.
Implications for conservation planning
How can authorities and conservationists use the information provided in this paper? The first step to guarantee the survival of a species is to ensure that adequate habitat is provided. The data and analysis presented here suggest that the optimal area for seasonally flooded habitats will be smaller in the future. Being able to predict areas of feasible habitat in the future is highly informative for conservation planning, as current conservation areas or reserves may not be the locations for optimal conservation in the future. The UNESCO Biosphere Reserve, for example, was planned with three core conservation areas (Fig. 1), but as Kummu and Sarkkula (Reference Kummu and Sarkkula2008) identified, a large fraction of these areas will be permanently inundated. We have gone one step further than Kummu and Sarkkula (Reference Kummu and Sarkkula2008), and estimated how the habitat cover might change in the near future within the Biosphere Reserve core areas (Table 3). We found that a large fraction (75–98%) of the flooded grasslands and flooded forests (13–97%) are expected to either become permanently flooded or transition into flooded shrublands. These drastic changes are likely to shift optimal habitat for certain species beyond the current boundaries of the protected areas, and therefore, it may be best to remap the conservation core zones to incorporate additional floodplain areas that are at least equivalent to the fraction that will be permanently flooded.
Table 3 Changes in potential habitat area (in km2) caused by hydrological disruptions from future hydropower scenario within the Tonle Sap's Biosphere Reserve Core Conservation Zones (see Fig. 1 for location of each zone).

Conservation planning needs to consider mitigating these losses and ensuring habitat connectivity for those species moving throughout the wetland. Nevertheless, spatial planning is only a first step towards an effective conservation programme; other key activities, such as reforestation, wildlife protection and species monitoring, concurrent with education and outreach, are equally important to the maintenance of a diverse and healthy ecosystem.
CONCLUSIONS
A modelling framework was introduced to quantify changes in the fauna of the Tonle Sap as a result of hydrological disruptions in the Mekong Basin. We used historical and projected water levels in combination with current land-use datasets to map changes in habitats as a function of hydrology. Using key characteristics of ecology and life history, we identified habitats of particular significance to animal species with high ecological, conservation or nutritional importance. We found that species richness is greater in those natural habitats that experience long seasonal inundation, namely gallery forests, flooded shrublands and flooded grasslands. We also found that these habitats will experience the most significant changes in area and location due to the predicted future flooding patterns and resulting human activities; hence animal groups who are permanent residents or reliant on these habitats to complete essential life history stages will be negatively impacted. Even though abrupt losses of natural vegetation may occur in the next few decades, in particular in the gallery forest, our results show that sufficient areas will exhibit conditions suitable for this habitat type to exist under future hydrological scenarios.
The modelling framework can and should be refined to increase the accuracy of predictions as new fauna and biophysical datasets become available. One current limitation is that very little is known about habitat succession in the Tonle Sap (Arias et al. Reference Arias, Cochrane, Kummu, Killeen, Piman and Caruso2012). This impedes the development of dynamic habitat models that can be coupled with hydrological models. Another aspect that would benefit from further investigation is the habitat-species link. The link has been mainly documented for species that remain in one habitat, but the significance of habitat types for individual species that temporarily make use of the inundated landscape and follow the flood pulse is not well known. Moreover, prey-predator interactions play an important role in determining when and where a particular species can be found, and, to our knowledge, there are no studies of multi-species interactions in the Tonle Sap. Recognizing future biophysical shifts, identifying suitable areas for habitats that maximize species richness, protecting these areas from agricultural conversion, and assisting reforestation/colonization should be priorities for spatial conservation and management planning for the Tonle Sap.
The tools and conceptual framework developed for this study can also be applied to other large tropical wetlands using available information on biophysical-fauna interactions. Conservation and restoration efforts of remote and valuable wetlands could benefit from the application of the modelling framework for estimating potential spatial changes in fauna habitat induced by scenarios of climate change, land-use change, hydropower development or other human activities. To this effect, a software package is being developed for easier dissemination of the methodology.
ACKNOWLEDGEMENTS
Funding was provided by the University of Canterbury International Student Doctoral Scholarship and a grant by the Critical Ecosystem Partnership Fund. Special thanks to Lee Hannah and three peer reviewers for providing feedback on this manuscript.


