INTRODUCTION
For thousands of years, humans have built millions of dams and impoundments for various purposes, including flood control, water supply, irrigation, recreation, navigation and hydropower (WCD 2000). In the last 60 years, the number and storage capacity of dams and reservoirs have rapidly increased (Lehner et al. Reference Lehner, Liermann, Revenga, Vörösmarty, Fekete and Crouzet2011). Dams have benefitted human society through mitigating floods, securing water supplies and providing hydropower (WCD 2000; Lehner et al. Reference Lehner, Liermann, Revenga, Vörösmarty, Fekete and Crouzet2011); however, damming is also a dominant form of human impact on riverine ecosystems, as nearly 50% of freshwater eco-regions across the world are affected by large- and medium-sized dams (Liermann et al. Reference Liermann, Nilsson, Robertson and Ng2012).
Dams and reservoirs dramatically change river hydrological regimes: they alter the timing, magnitude, frequency, duration and rate of change of flows (Poff et al. Reference Poff, Allan, Bain, Karr, Pres-tegaard and Richter1997), they alter channel morphology (Gordon & Meentemeyer Reference Gordon and Meentemeyer2006), they impede migratory paths and fragment ecological connectivity (Bednarek Reference Bednarek2001) and they modify thermal, sediment and nutrient regimes (Ligon et al. Reference Ligon, Dietrich and Trush1995). Aquatic habitats are closely associated with the hydrological and geomorphological processes of the associated rivers (Wohl Reference Wohl2004). Any changes in these processes could affect organisms through changes in habitats (Graf Reference Graf2006). For example, the shift from lotic to lentic environments after dam construction often favours generalist over specialist species, and puts endemic species at particular risk of extinction (Poff et al. Reference Poff, Olden, Merritt and Pepin2007). Numerous studies have demonstrated the adverse impacts of dams on vegetation dynamics, macroinvertebrate habitat and fish abundance and diversity (Liermann et al. Reference Liermann, Nilsson, Robertson and Ng2012). Dams constitute a major threat to global freshwater species diversity (Vörösmarty et al. Reference Vörösmarty, McIntyre, Gessner, Dudgeon, Prusevich and Green2010) and have wide effects on species distributions among aquatic trophic levels (Pringle et al. Reference Pringle, Freeman and Freeman2000). This has prompted recent river environment restoration efforts focused on enhancing connectivity through a variety of mechanisms, including dam removal (Stanley & Doyle Reference Stanley and Doyle2003), adjusting reservoir management to provide more natural flow regimes (e.g. environmental flow), levee breaching (Guida et al. Reference Guida, Swanson, Remo and Kiss2015), restoring natural morphology to streams disturbed by channelization, agriculture or urbanization (Eekhout et al. Reference Eekhout, Hoitink, de Brouwer and Verdonschot2015) and improving fish passage (Kemp & O'Hanley Reference Kemp and O'Hanley2010).
As with fish and invertebrate assemblages, the distribution, diversity and abundance of waterbirds have long been recognized as suitable bio-indicators of environmental change in aquatic systems (Caro and O'Doherty Reference Caro and O'Doherty1999), and are often integrated into monitoring programmes for environmental impact assessment and evaluation of ecosystem recovery (Hebert et al. Reference Hebert, Norstrom and Weseloh2000). Waterbirds are linked to aquatic food webs in multiple ways, with many species relying on both aquatic and the adjacent terrestrial areas (Steinmetz et al. Reference Steinmetz, Kohler and Soluk2003). Thus, waterbirds may be considered as proxies for the ecosystem's biotic health. In addition, as birds function at a larger spatial scale than many other taxa, they are highly relevant to understanding the linkages between rivers, riparian habitats and watersheds (Robinson et al. Reference Robinson, Tockner and Ward2002). Numerous studies have assessed the effects of river regulation (especially damming and water diversion) on river-dwelling biota, including invertebrates, fish and waterbirds (Ligon et al. Reference Ligon, Dietrich and Trush1995; Hebert et al. Reference Hebert, Norstrom and Weseloh2000). Moreover, many studies have demonstrated the associations between waterbirds, especially piscivores, and fish and/or other invertebrates (Elmberg et al. Reference Elmberg, Dessborn and Englund2010). However, few studies have investigated the effect of river regulation on fish and waterbirds in an integrated way.
Empirical habitat models, such as generalized linear regression, random forests and artificial neural networks, are based on a description of the abiotic variables that affect the distribution of species (Ahmadi‐Nedushan et al. Reference Ahmadi‐Nedushan, St‐Hilaire, Bérubé, Robichaud, Thiémonge and Bobée2006), which can be generated using methods requiring information on species presence, or species presence and absence (Brotons et al. Reference Brotons, Thuiller, Araújo and Hirzel2004). More recently, structural equation modelling (SEM) is increasingly being used in ecological studies to map these complex relationships and to determine causality (Grace Reference Grace2006), and it might provide a framework for extricating the direct and indirect effects of damming on river birds and fish.
The wetland complex of the middle and lower Yangtze River watershed is the main wintering area for many endangered migratory waterbirds (e.g. scaly-sided merganser (Mergus squamatus) and Siberian cranes (Grus leucogeranus)), and a large number of migratory fish (e.g. Chinese sturgeon (Acipenser sinensis) and Chinese sucker (Myxocyprinus asiaticus)) depend on the Yangtze River for survival. The Yangtze River and its associated lakes are biodiversity hotspots and one of Earth's most biologically valuable eco-regions, harbouring globally important biodiversity and ecological processes. At the same time, the region is also the economic development frontier of China, representing a large number of river regulation projects, including the world's largest dam – the Three Gorges Dam (Dudgeon et al. Reference Dudgeon, Arthington, Gessner, Kawabata, Knowler and Lévêque2006). The environmental and ecological consequences of these developments are still unfolding, and continuous monitoring and assessment are critical in order to avoid catastrophic biodiversity loss (Dudgeon et al. Reference Dudgeon, Arthington, Gessner, Kawabata, Knowler and Lévêque2006).
In this study, we aim to examine the effects of dams on fish and waterbirds within the SEM framework using the scaly-sided merganser (M. squamatus) as an example. The scaly-sided merganser is an endangered, iconic fish-eater, wintering primarily in central and southern China. It has a very small population that is suspected to be undergoing a continuing and rapid decline due to dam construction, illegal hunting and logging (EAAFW 2015). In their wintering sites, scaly-sided mergansers prefer to forage in fast-flowing, clear water rivers with riffles, shoals or sand banks in mountainous areas and with low levels of human disturbance (EAAFW 2015). Almost all rivers in southern China have been dammed, and often the distance between dams is short, which leads to the disappearance of optimal river habitats. Based on a previous study, which established the importance of instream habitats for the scaly-sided merganser in the middle Yangtze catchment (Zeng et al. Reference Zeng, Zhang, Sun, Duo, Wen and Lei2015b), we test whether or not the association between the scaly-sided merganser and habitat changes when adding fish (the main food resource) into the equation. The specific objectives of this study are: to compare the instream physical and landscape variables upstream and downstream of the dams; to quantify the contributions of physical and landscape variables on fish abundance and scaly-sided merganser distribution; and to identify the direct and indirect effects of physical and landscape metrics on scaly-sided merganser occurrence.
MATERIALS AND METHODS
Study area
This study was conducted in the lower reach of Yuan River, one of the largest tributaries of the Yangtze River in central China (Fig. 1). It originates in Guizhou Plateau, and flows through the Wuling Mountain region. The studied river section spans 24 km, and a cascade hydropower dam (Lingjintan) is located at the southwest corner, which was constructed in 2000. The dam is 39 m high with a total reservoir capacity of 6.34 × 10⁸ m3. This river section supports a wintering population of approximately 40 scaly-sided mergansers.
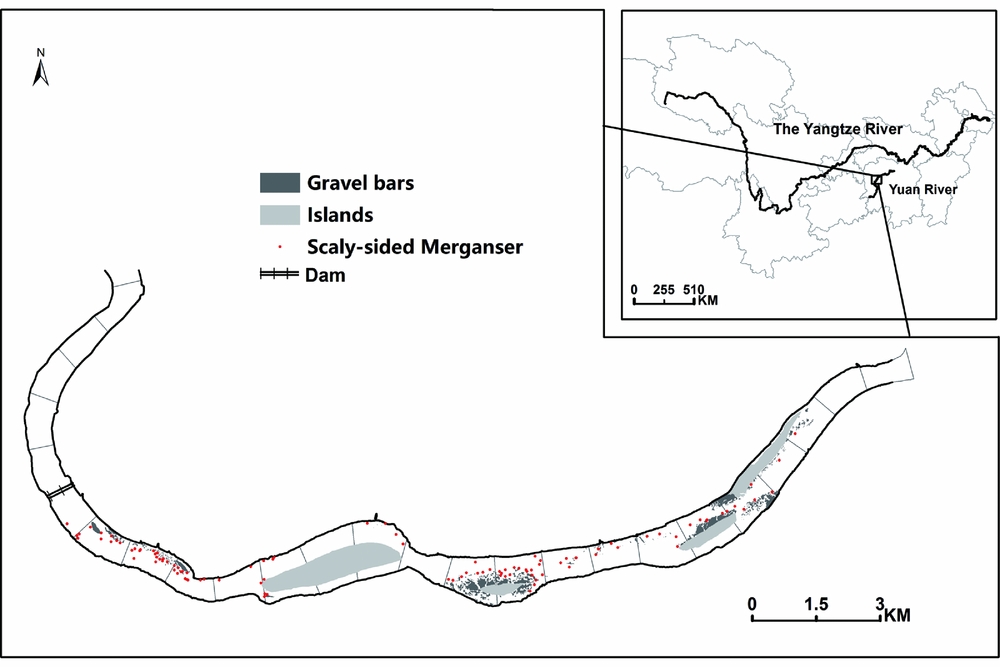
Figure 1 Study area in the Yangtze River Basin and the distribution of scaly-sided merganser flocks and gravel bar patches in the 22-km river section of the lower Yuan River. The dots indicate 90 scaly-sided merganser flocks recorded over three winters. Areas in dark grey are gravel bars and areas in light grey are islands.
Gravel patch data and landscape metrics
We used the Bing Maps aerial image (2011–2012) with a spatial resolution of 0.6 m to derive the landscape vectors. We then classified all of the habitat patches into three types through visual interpretation: water, islands and gravel bars. Islands are much higher and larger than gravel bars; they normally have human residence or activity, and are seldom used by waterfowl.
Considering that the study is carried out at the river reach scale, we drew a central line through the river, and equally divided the studied river section into 24 segments by drawing 23 lines perpendicular to the central line (Zeng et al. Reference Zeng, Zhang, Sun, Duo, Wen and Lei2015b). The 24 river segments were processed in FRAGSTATS 3.3 (McGarigal et al. Reference McGarigal, Cushman, Neel and Ene2002) with landscape-level metrics, namely number of patches (total number of patches in the landscape), edge density (the lengths of all edge segments in the landscape divided by the total landscape area) and Shannon's diversity index.
Scaly-sided merganser occurrence
The distribution data of wintering scaly-sided merganser in the Yuan River were collected through fortnightly surveys from November to February in three winters (2010/2011, 2011/2012 and 2012/2013), resulting in a total of 24 surveys. For each survey, we travelled along the 24-km long river course by boat, using binoculars to identify and locate scaly-sided merganser. The scaly-sided merganser locations were recorded by global positioning system (GPS). As suggested by Zeng et al. (Reference Zeng, Shi, Wen, Chen, Duo and Lei2015a), we kept our boat in the middle of the river to minimize disturbance to the birds, and also to ensure a full view was obtained. Distances of less than 10 m between individuals were defined as a flock (i.e. identified as a single occurrence point in mapping; Zeng et al. Reference Zeng, Shi, Wen, Chen, Duo and Lei2015a).
The scaly-sided merganser occurrences from the three winter surveys were then mapped with ArcGIS software (ESRI Inc., Redwood, CA, USA), and the counts were summed for all points within the 24 predefined 1-km river segments. We termed the ratio of this sum and total points as the occurrence frequency, which is the response variable in our model.
Fish density: hydroacoustic survey
Hydroacoustic surveys can produce comparable estimates of abundance to those obtained by trawling when focusing on small fish (Emmrich et al. Reference Emmrich, Helland, Busch, Schiller and Mehner2010; Ren et al. Reference Ren, Chen, Liu, Duan, Li and Wang2012). The hydroacoustic survey was conducted in late November 2011. We used a BioSonics DT-X digital echosounder (BioSonics, Inc., Seattle, WA, USA) equipped with a 200-kHz split-beam circular transducer with a half-power beam width of 6.8°. The echosounder was fixed on the bow of the research vessel, with a draught of 0.58 m. The vessel zigzagged through the river section at a speed of 6 km h−1 on average. Vessel position was measured with a GPS 17x HVS differentially corrected GPS unit (Garmin Inc., Olathe, KS, USA), and this information was embedded in the acoustic data files.
Acoustic signals were collected with BioSonics Visual Acquisition Software (version 6, BioSonics, Inc., Seattle, WA, USA), and output files were stored to a laptop hard drive. The SV threshold was –65 dB, the pulse length was 0.3 ms and the ping rate was six pulses per second. Thresholds were set to allow detection of all echoes exceeding –75 dB on the acoustic axis.
The recorded data were processed in Visual Analyzer software (version 4.1, BioSonics, Inc., Seattle, WA, USA). The acoustical data were divided into seven depth layers (0–1, 1–2, 2–3, 3–4, 4–5, 5–6 and 6–7 m). Echo integration was used for calculation of the volumetric fish densities.
We divided the hydroacoustic-surveyed river section into the same 24 segments and calculated the fish density in each segment. Two datasets were excluded due to excess noise. Water depth was measured with a Biosonics DT-X sonar system (Biosonics Sound Navigation and Ranging Inc., Seattle, WA, USA), and the depth of each ping was derived by Visual Habitat software (BioSonics, Inc., Seattle, WA, USA).
Structural equation modelling
SEM is a multivariate method that is increasingly being used by researchers in the natural sciences to address questions about complex systems (Grace et al. Reference Grace, Schoolmaster, Guntenspergen, Little, Mitchell and Miller2012). SEM is designed to disentangle the complicated relationships in observed ecological phenomena and allows explicit testing of these direct and indirect dependencies, providing a framework for learning about causal processes. A simplified general conceptual model provides a basic outline of the hypothesized relationships between different components of the river ecosystem: (1) water depth and river landscape, which are latent variables measured by the number of patches, density of edges and diversity index, are both considered to be important drivers of fish abundance and the occurrence of scaly-sided mergansers (Zeng et al. Reference Zeng, Shi, Wen, Chen, Duo and Lei2015a); (2) the density of fish will influence the distribution of wintering scaly-sided mergansers, as fish is their main food (considering the diving range of the scaly-sided merganser, the average fish density in the top 5 m was specified in the model); and (3) water depth and river landscape have indirect effects on scaly-sided mergansers through their influence on fish schools.
Spatial and temporal auto-correlations are frequently encountered in ecological data (Lichstein et al. 2002). To inspect the potential effects of autoregression in fish abundance and scaly-sided merganser occurrence data, we first included a variable that represented distance from the Lingjintan dam (negative for upstream and positive for downstream sections) in the model structure. The trial run indicated that distance was insignificant for both fish (p = 0.46) and waterbirds (p = 0.68), and so was excluded in the final model.
We used both absolute fit indices (model χ 2 and root mean square error of approximation) and incremental fit indices (comparative fit index) to evaluate model fit. We reported the means and standard errors of those indices based on 1000 bootstrapping draws. All analyses were conducted using R (version 3.1.1) with the package lavaan (version 0.5.14; Rosseel Reference Rosseel2012).
RESULTS
Instream habitat and water depth
The average water depth in the river segments varied from 3.48 to 19.48 m, and the average water depth was 6.11 and 16.88 m below and above the Lingjintan dam, respectively. On average, the water depth at river segments upstream of the dam was 10 m deeper than those located downstream, and the difference was significant (two-tailed t-test, df = 5.97, p < 0.001).
While gravel bars and instream islands were abundant at the river segments downstream of the dam (number of patches, edge density and Shannon's diversity index were 28, 76 and 0.42, respectively), open water was the main feature upstream, with no other types of habitat patch identified from aerial images. The landscape metrics were significantly greater downstream (two-tailed t-test, df =16, p = 0.001, p < 0.001 and p < 0.001 for the number of patches, edge density and Shannon's diversity index, respectively).
Fish and bird modelling
The number of single echo detections for the total volume was 336; the average target strength was –53.934 dB. Fish density was significantly higher (two-tailed test, df = 16.07, p = 0.04) downstream than upstream, especially for the 1–5-m stratum (two-tailed test, df = 16.85, p = 0.008; Fig. 2). During the entire survey period, we counted 427 scaly-sided mergansers, which belonged to 90 flocks, all found downstream of the dam (Fig. 1).
Figure 2 Fish densities at each stratum in river sections below and above the dam.
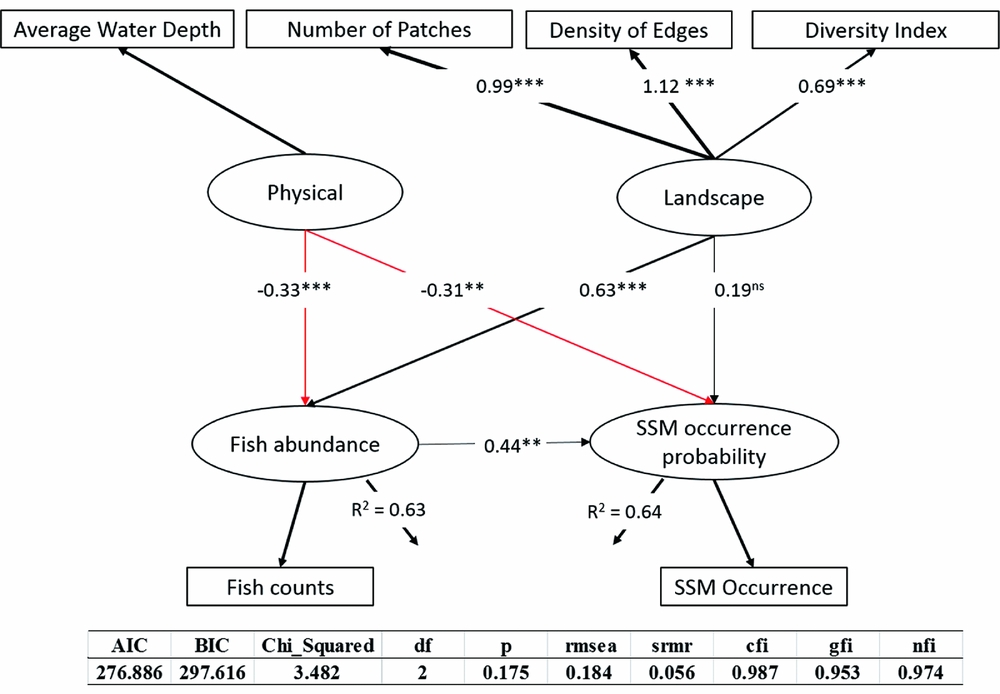
Water depth and river landscape were both included in the final model and had significant effects on fish density and the occurrence of scaly-sided mergansers (Fig. 3). Fish and scaly-sided mergansers were positively affected by landscape (p = 0.141 and p = 0.002 for waterbird and fish regressions, respectively) and negatively affected by water depth (p = 0.028 and p = 0.037 for fish and waterbird regressions, respectively). Density of fish directly influenced the distribution of wintering scaly-sided mergansers, while water depth and river landscape had indirect effects on the bird through their influences on fish abundance (Fig. 3).

Figure 3 Structural equation model used to describe the full covariance matrix among habitat condition, fish and scaly-sided mergansers. The strength of the causality is indicted by the size of the link. Black lines indicate positive effects while red lines indicate negative impacts. **p < 0.01; ***p < 0.001 AIC = Akaike information criterion; BIC = Bayesian information criterion; rmsea = root mean square error of approximation; srmr = standardized root mean square residual; cfi = comparative fit index; gfi = goodness of fit index; nfi = normed fit index; ns = non-significant.
Fish abundance had a direct effect of 0.44 on scaly-sided mergansers; water depth had a total effect of –0.46 on the bird's occurrence – an indirect effect through fish (–0.33 × 0.44 = –0.15) and a direct effect of –0.31, as well as a direct effect of –0.33 on fish abundance; and landscape had a total effect of 0.47 on the bird's occurrence – an indirect effect through fish (0.63 × 0.44 = 0.28) and a direct effect of 0.19, as well as a direct effect of 0.63 on fish abundance (Fig. 3). The model explained 64% of the variation in scaly-sided merganser occurrence probability and 63% of the variation in fish density.
DISCUSSION
We found that there were significant differences in river landscape and water depth between river segments below and above the Lingjintan dam. In general, the river below the dam is shallower and has a diverse habitat of gravel bars and islands. These differences in physical attributes and habitats influenced the densities of fish and scaly-sided mergansers.
The adverse impacts of river regulation such as dam construction on the distribution and habitat selection of waterbirds has been recognized for decades; 92% of 165 studies reported decreased values for recorded ecological metrics on different organism categories (such as birds, fishes, macroinvertebrates and zooplankton) in response to flow alteration (Poff & Zimmerman Reference Poff and Zimmerman2010). Habitat availability and heterogeneity are pivotal for waterbirds (Zeng et al. Reference Zeng, Shi, Wen, Chen, Duo and Lei2015a), which suggests that food availability might underpin waterbird distribution. This study goes beyond previous work by including both food resources (fish abundance) and habitat quality (gravel bar and water depth) in an integrated modelling framework. Our findings confirm that spatial heterogeneity (i.e. gravel bar diversity) and physical setting (water depth), in addition to their well-known direct effects on individual populations (fish and waterbirds in this study), might also affect the trophic interactions among species, although we did not find evidence for a causal link from waterbirds to fish.
The effects of prey
Prey size and prey abundance are the two main availability factors of importance to predators (Griffiths Reference Griffiths1975). In a captive setting under controlled conditions, prey density outweighed prey behaviour (schooling versus solitary trout), exerting the strongest influence on foraging success of the double-crested cormorant (Phalacrocorax auritus), and prey size and light conditions did not measurably affect cormorant prey–capture performance (Enstipp et al. Reference Enstipp, Grémillet and Jones2007). In the wild, common mergansers select their foraging sites based only on density of juvenile salmon, while tide, weather and time of day have no significant effect (Wood & Hand Reference Wood and Hand1985). A merganser's average daily food requirement (c. 400 g) can be satisfied at smolt densities of 0.02–0.30 m–2 (Wood & Hand Reference Wood and Hand1985). In captivity, the average daily food requirement of scaly-sided mergansers is 200–300 g (authors’ personal observations). In our study site, the average fish density downstream of the Lingjintan dam is 0.0014–0.1792 m–2, indicating that some river sections could be satisfactory. We found no literature reporting the effect of prey size on waterfowl foraging site selection and assumed that the size of fish had no significant influence on the distribution of scaly-sided mergansers, because most of the fish at our study site are small (<10 cm) and easy for the mergansers to handle.
Effects of the dam on fish
The SEM demonstrated two causal paths that linked the dam to fish density. The first path was related to river landscape as defined by three landscape metrics (i.e. number of gravel bar patches, density of edges and diversity index), which had a significant positive effect on fish density. This result is in agreement with studies in North America, in that a diverse landscape (e.g. the mosaic of islands and gravel bars) has greater variability in depth, substrate, cover and current velocity, as well as greater habitat complexity. This increases the number and diversity of foraging positions and shelters, which increases the density of Atlantic salmon (Van Zyll de Jong et al. Reference Van Zyll de Jong, Cowx and Scruton1997). The second path was related to the physical attributes of the river, which were measured by the average water depth of a river segment. The path coefficient showed that fish density was negatively affected by water depth. Katano et al. (Reference Katano, Nakamura, Abe, Yamamoto and Baba2006) also showed that fish diversity and abundance were lower at locations downstream of the dam, which was attributed to the interrupted migration. In most circumstances, shallow and slow-flowing habitats were used by small, young fish of several species, while deep areas were primarily inhabited by larger, older fish (Finger Reference Finger1982).
Effects of the dam on scaly-sided mergansers
Three direct and indirect effects of the dam on scaly-sided merganser occurrence were identified. The first path was the direct link between river landscape and bird occurrence probability. Including this link greatly increased the model Akaike information criterion (AIC; ΔAIC = 6.54), which indicated the importance of the link (Burnham & Anderson Reference Burnham and Anderson2004). As shelters from disturbance, as well as sites for roosting and feeding, a diversity of gravel bars within a river is vital for the scaly-sided merganser (Zeng et al. Reference Zeng, Shi, Wen, Chen, Duo and Lei2015a).
The second path was the indirect effect of the river landscape through its influence on fish abundance. The explicit realization and quantification of this causality is one of the main contributions of this study. Previous studies documented the importance of habitat diversity for river-dwelling biota, including fish and waterbirds, as well as the association between fish and waterbirds (Zeng et al. Reference Zeng, Shi, Wen, Chen, Duo and Lei2015a). Our results clearly demonstrate the causal path from habitat diversity to fish abundance to waterbird occurrence. We recognize that several meaningful paths are missing (e.g. connections between physical environment and flow rate, nutrients or water temperature) in our relatively simple conceptual model. In addition, the path coefficients and significant levels of the included causal links might differ if we included the distributions of submergent macrophytes (types of substrate for fish) and the disturbance to waterbirds (Klein Reference Klein1993) in the conceptual SEM. Our intention is neither to illustrate the enormous interconnectivity in nature nor to identify the ‘optimal model’. In this study, we simply formulated a model based on our best knowledge of the system, which aims to illuminate the relative impact of the considered causal factors on the occurrence of the scaly-sided merganser in its known wintering area through a reasonable representation of the observed variability.
The third path indicated the negative effect of water depth on the occurrence of scaly-sided mergansers. This might be related to its foraging behaviour. When searching for prey (i.e. salmon), common mergansers and red-breasted mergansers probe the river bottom with their bills, or insert their bills into cavities and potential refuges among stones (Sjöberg Reference Sjöberg1987). The common mergansers seek their food visually; therefore, they prefer clear or relatively shallow water habitats. The scaly-sided mergansers might use a similar foraging strategy. The longest diving duration of scaly-sided mergansers is 112 seconds, with a diving depth of 2 m and a diving distance of 15 m (Fang et al. Reference Fang, Zhang, Wang, Luo and Jie2009). Scaly-sided mergansers seldom appeared in the upstream area of the dam (authors’ personal observations), which might be related to the water depth limiting their foraging. Similarly, buffleheads (Bucephala albeola) normally do not forage in water that is deeper than 3 m and appear to be physiologically constrained in this manner (Erskine Reference Erskine1972). Therefore, food at depths beyond 3 m is not actually available (Schummer et al. Reference Schummer, Petrie and Bailey2008). Selection and use of foraging patches involve trade-offs between various factors, including food availability, the energy content of available foods, prey handling time, thermoregulatory costs associated with body size and diving ability to greater depths (Krebs & Davies Reference Krebs and Davies2009). For piscivore birds such as mergansers, the recorded diving depths of diving ducks are much greater than their foraging depths (Nilsson Reference Nilsson1972; Croll et al. Reference Croll, Gaston, Burger and Konnoff1992). The effect of water depth on the scaly-sided merganser is in need of further study.
CONCLUSION
Dams have direct and indirect negative effects on the density of fish and the distribution of fish-eaters. In fact, dam construction could be one of the most serious threats to the wintering scaly-sided merganser (Barter et al. Reference Barter, Zhuang, Wang, Cao, Lei and Solovyeva2014). The cascade of development of hydropower has transformed the Yangtze River into a chain of reservoirs, and this has cumulative effects on the whole ecosystem, which could cause the loss and degradation of critical habitats and affect the distribution and survival of fish, birds and other aquatic organisms. Further research on dam design, location and operation is needed in order to ameliorate ecologically deleterious geomorphic changes (Ligon et al. Reference Ligon, Dietrich and Trush1995). The sites and sizes of dams need to be carefully studied before construction. Flow and sediment inputs downstream will interact with the river channel, and different flow release policies introduce changes to the hydrological regime. Habitat restoration techniques should be employed in order to increase habitat heterogeneity and the degree of habitat complexity in channelized river sections. For river segments behind the dam, locally based management actions can be successful in restoring biotic integrity, whereas dam removal actions require more integrated measures at a regional scale (Van Looy et al. Reference Van Looy, Tormos and Souchon2014).
ACKNOWLEDGEMENTS
We appreciate the technical support of Huang Yadong.
FINANCIAL SUPPORT
This work was funded by the National Key Research and Development Program (2017YFC0405303) and National Basic Research Program of China (973 Program; no. 2012CB417005).