


Introduction
The Neotropics harbour c. 50% of tropical and subtropical forests in the world; however, 80% of those forests are subject to unsustainable economic practices (FAO 2011, Cayuela & Granzow de la Cerda Reference Cayuela and Granzow-de la Cerda2012, Allan et al. Reference Allan, Venter and Watson2017). Logging is the most widespread activity in these forests, with few examples of long-term sustainability; most operations follow a mining strategy of selective extraction of valuable timber species (Fimbel et al. Reference Fimbel, Grajal and Robinson2001), and such mature forests have suffered structural changes (McIver et al. Reference McIver, Parsons and Moldenke1992, Huang et al. Reference Huang, Tso, Lin, Lin and Lin2011, Cazzolla Gatti et al. Reference Cazzolla Gatti, Castaldi, Lindsell, Coomes, Marchetti and Maesano2014). These logging operations have also had a great impact on biodiversity by reducing abundances and species richness of taxonomic groups associated with mature forest structures (i.e., closed canopies, thick layers, non-compacted leaf litter and a high density of live trees; Bicknell & Peres Reference Bicknell and Peres2010). The piedmont forest specifically harbours an extraordinary level of biodiversity, with a large number of endemic species, and it is of high conservation value owing to its threatened status (Rivera et al. Reference Rivera, Politi, Lizárraga, Chalukian, de Bustos and Ruíz de los Llanos2015). Currently, the piedmont forest is one of the most threatened ecosystems in Argentina; 90% of its extent has been transformed into agricultural and urban areas, and most remnant forests have been under unsustainable logging operations for a century (Brown et al. Reference Brown, Grau, Malizia, Grau, Kapelle and Brown2001, Reference Brown, Blendinger, Lomáscolo and García Bes2009, Rivera et al. Reference Rivera, Politi, Lizárraga, Chalukian, de Bustos and Ruíz de los Llanos2015). Implementing scientifically based monitoring schemes would allow for the assessment of logging sustainability before forest degradation occurs (Mostacedo & Fredericksen Reference Mostacedo and Fredericksen2001, Sutherland Reference Sutherland2006, Petkova et al. Reference Petkova, Larson and Pacheco2011, Politi & Rivera Reference Politi and Rivera2019).
Currently, monitoring schemes that assess sustainable use focus on charismatic vertebrate species due to all the information about them that is available and due to an assumption of their suitability as surrogates for other taxonomic groups (Hilty & Merenlender Reference Hilty and Merenlender2000, Darwall et al. Reference Darwall, Holland, Smith, Allen, Brooks and Katarya2011, Burivalova et al. Reference Burivalova, Şekercioǧlu and Koh2014, Oberprieler et al. Reference Oberprieler, Andersen, Gillespie and Einoder2019). However, in freshwater ecosystems in Africa, birds and mammals showed low suitability as surrogates for amphibians, crustaceans, molluscs and odonates (Darwall et al. Reference Darwall, Holland, Smith, Allen, Brooks and Katarya2011), and the Australian tropical savanna vertebrates were found to poorly reflect invertebrates, with vertebrate diversity only being weakly associated with that of invertebrates (Oberprieler et al. Reference Oberprieler, Andersen, Gillespie and Einoder2019). In order to assess the sustainability of logging operations concerning groups other than vertebrates, invertebrates should be included in monitoring schemes (Burivalova et al. Reference Burivalova, Şekercioǧlu and Koh2014).
Spiders are a megadiverse taxonomic group, with nearly 50 000 described species, and they are very diverse in forest ecosystems (Foélix Reference Foélix2011, World Spider Catalog 2021). Despite the fact that spiders exhibit a strong association with forest structure and can therefore be used as surrogates for the level of logging impacts (Pearce & Venier Reference Pearce and Venier2006, Pinzón et al. Reference Pinzón, Spence and Langor2012, Reference Pinzón, Spence and Langor2013, Košulič et al. Reference Košulič, Michalko and Hula2016, Alcalde et al. Reference Alcalde, Politi, Corronca and Rivera2018), their inclusion in monitoring schemes has been neglected due to the difficulty of taxonomic identification to the species level (Cardoso et al. Reference Cardoso, Erwin, Borges and New2011, Raub et al. Reference Raub, Höfer, Scheuermann and Brandl2014). However, where the objective is to perform a rapid assessment of diversity patterns and to provide reliable management recommendations, data at the family taxonomic level may be adequate (Brennan et al. Reference Brennan, Ashby, Majer, Moir and Koch2006, Lubin et al. Reference Lubin, Angel and Assaf2011, Cruz et al. Reference Cruz, Torres, González-Reyes and Corronca2018, Pereira et al. Reference Pereira, Nogueira Cardoso, Brescovit, Iuñes de Oliveira Filho, Segat, Riviera Duarte Maluche Baretta and Baretta2021). Simplifying the analysis to be used in monitoring schemes is particularly relevant in highly diverse forest ecosystems where there is a scarcity or complete lack of information about species and their life histories (Maclaurin & Sterelny Reference Maclaurin and Sterelny2009, Pereira Souza et al. Reference Pereira Souza, Beggiato Baccaro, Lemes Landeiro, Franklin, Magnusson, Costa Lima Pequeno and Oliveira Fernandes2016, Rocha et al. Reference Rocha, González-Reyes, Corronca, Rodríguez-Artigas, Doma, Repp and Acosta2016). The objectives of this work are: (1) to evaluate whether spider assemblage structure changes in a logged forest compared to a mature forest; (2) to determine whether spider families are suitable surrogates for assessing logging structural changes without the need to identify species; and (3) to identify spider families associated with structural forest variables characteristic of unlogged forests, which can potentially be used to monitor the ecological sustainability of logging operations.
Methods
Study area
The neotropical piedmont forest extends from southern Bolivia to north-western Argentina, where its greatest extent is in the provinces of Jujuy and Salta (Prado Reference Prado, Brown and Grau1995, Olson et al. Reference Olson, Dinerstein, Wikramanayake, Burgess, Powell and Underwood2001). Piedmont forest has pronounced rainy (September–march) and dry (April–August) seasons, with mean monthly precipitation reaching 300 and 10 mm, respectively, and high temperatures throughout the year (Brown et al. Reference Brown, Grau, Malizia, Grau, Kapelle and Brown2001).
This study was carried out at six sites distributed between 400 and 700 m altitude in the piedmont forest of Jujuy and Salta provinces (Fig. 1). Sites were at least 4 km apart and were classified according to forest management type as reference sites, in which logging has not occurred for 50 years (henceforth ‘unlogged sites’), and sites subjected to conventional logging (henceforth ‘logged sites’), in which the last tree extraction was carried out in 2014 (Sosa, personal communication 2020). Unlogged sites were mature forests, with the structure of primary forest characterized by mature trees, two or three tree strata, a 25-m high continuous canopy and at least 25 m2/ha basal area (Brown et al. Reference Brown, Blendinger, Lomáscolo and García Bes2009). Logging in the study area is characterized by the extraction of tree species of high economic value using a minimum cutting diameter criterion, which has produced a strong retraction in the stock of species such as Cedrela balansae, Amburana cearensis and Myroxylon peruiferum (Brown et al. Reference Brown, Blendinger, Lomáscolo and García Bes2009, Rivera et al. Reference Rivera, Politi, Lizárraga, Chalukian, de Bustos and Ruíz de los Llanos2015). Three replicates per treatment were selected, constrained by the availability of sites that complied with the above characteristics.
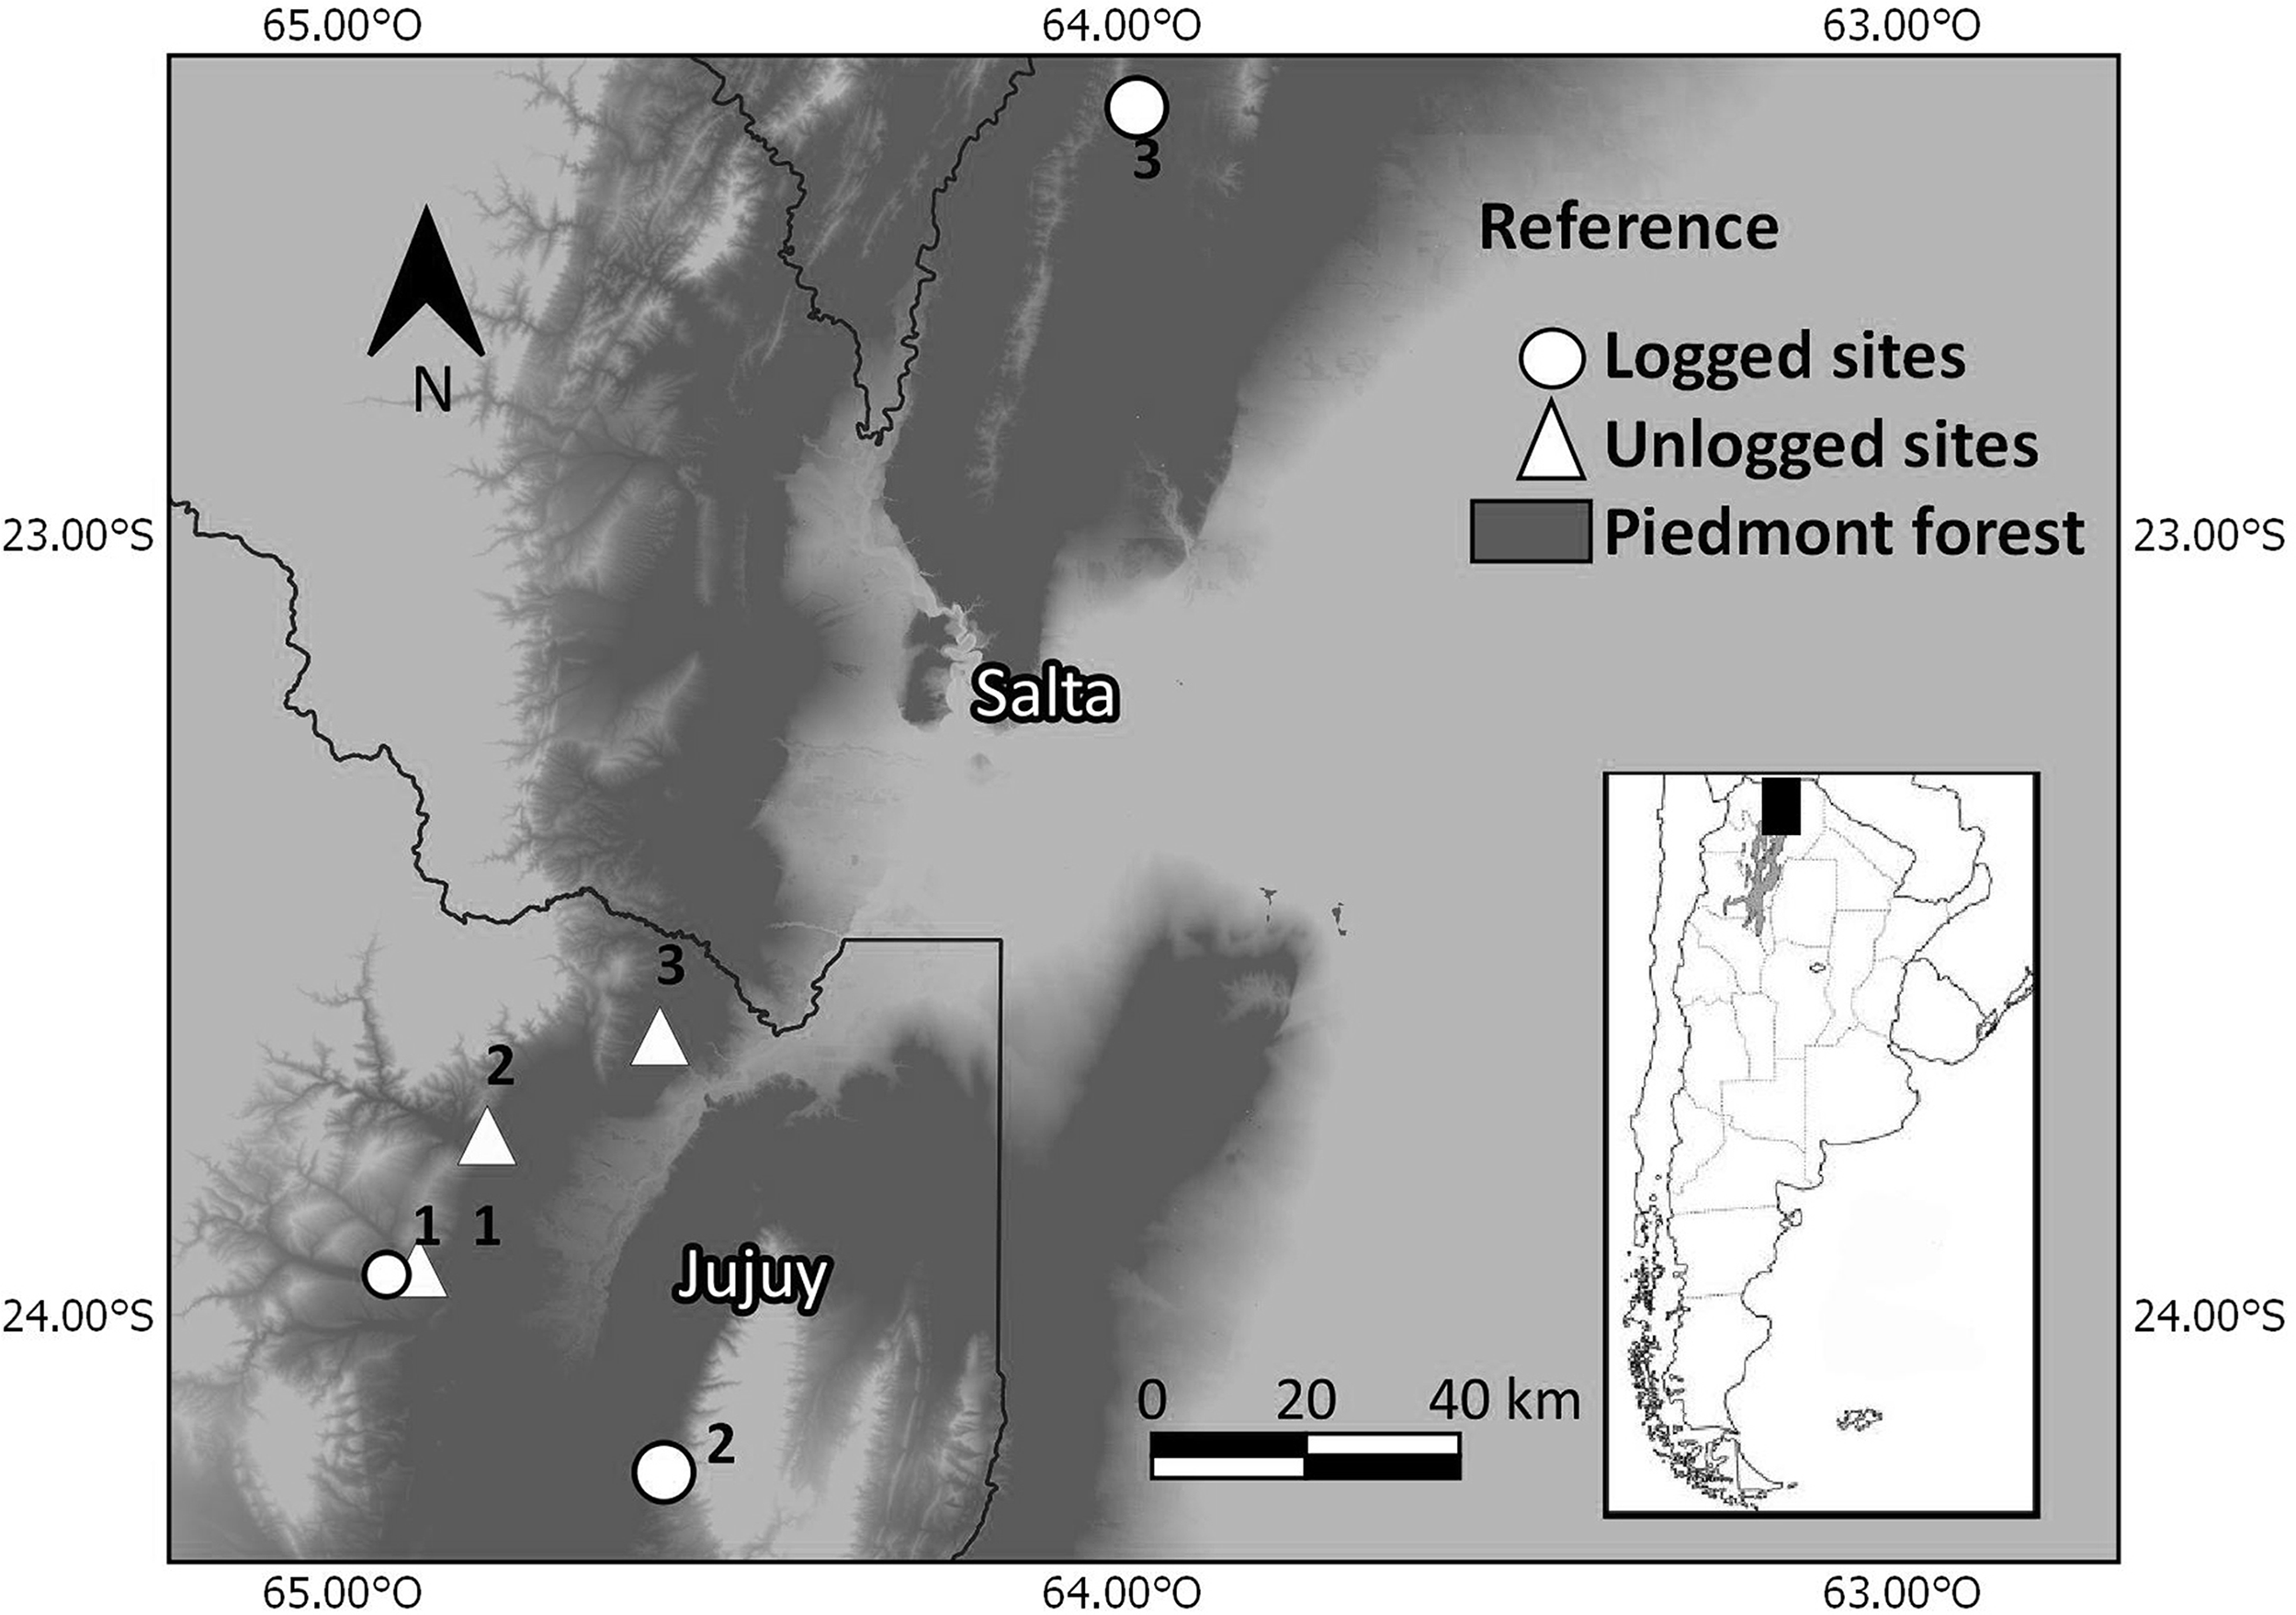
Fig. 1. Location of the study sites in the piedmont forest in north-western Argentina. Unlogged sites (triangles) in (1) Finca Yuchan, (2) Finca San Martín and (3) Calilegua National Park and logged sites (circles) in (1) Finca Higueritas, (2) Finca Piquete and (3) Finca Río Seco.
Sampling
Sampling field trips were carried out at all six sites during November and May of 2015, 2016 and 2017 for both ground-dwelling spiders and forest structural variables. At each site, five plots of 0.1 ha were delimited and separated by at least 50 m (Oxbrough et al. Reference Oxbrough, Gittings, Halloran, Giller and Smith2005, Cava et al. Reference Cava, Corronca and Echeverría2013, Fuller et al. Reference Fuller, Newman, Irwin, Kelly and O’Halloran2014).
Ground-dwelling spiders were sampled using pitfall traps, which are widely used due to their low cost, speed and capture of a large number of individuals and rare species (Topping & Sunderland Reference Topping and Sunderland1992). The pitfall traps used in this study were plastic containers of 11.5 × 12.5 × 9.5 cm (upper diameter × depth × bottom diameter) containing NaCl supersaturated solution with a few drops of detergent (Larrivée et al. Reference Larrivée, Fahrig and Drapeau2005, Torres et al. Reference Torres, González-Reyes and Corronca2017) and finally using tree branches and bark as a roof to keep rainwater and forest debris out of the traps (Sutherland Reference Sutherland2006). In each plot, 10 pitfall traps were set 10 m from each other, arranged linearly, and they were removed after 8 days of activity, which is the mean period of activity used in north Argentina (Cava et al. Reference Cava, Corronca and Echeverría2013, Torres et al. Reference Torres, González-Reyes and Corronca2017, Cruz et al. Reference Cruz, Torres, González-Reyes and Corronca2018). At the laboratory, spiders were assigned to morphospecies (encoded as ‘m’ along with the morphospecies ID number; e.g., m193) and identified to the family level using the Grismado et al (Reference Grismado, Ramírez, Izquierdo, Roig Juñent, Claps and Morrone2014) and Ferretti et al (Reference Ferretti, Pompozzi, Copperi, González and Pérez-Miles2010) taxonomic keys. In Argentina, there is difficulty in taxonomic identification to the species level due to a lack of expertise (Rubio et al. Reference Rubio, Corronca and Damborsky2008), so the assignment to the genus level is appropriate (Pereira et al. Reference Pereira, Nogueira Cardoso, Brescovit, Iuñes de Oliveira Filho, Segat, Riviera Duarte Maluche Baretta and Baretta2021). In order to avoid biases due to sexual dimorphism and differences between juveniles and adults, spiders were assigned to the same morphospecies when they fell into the same pitfall trap. Furthermore, the photographic database of the Institute for the Study of Invertebrate Biodiversity (IEBI; Universidad Nacional de Salta) was used as a reference. The collected material was preserved in 70% ethanol and deposited in the Lab of Biología de la Conservación – Facultad de Ciencias Agrarias, Universidad Nacional de Jujuy.
Sampling of forest structural variables
At five random points in each sampling plot, leaf litter thickness was measured using a 1cm graduated ruler, and the number of marks that penetrated leaf litter was recorded (Rivera & Armbrecht Reference Rivera and Armbrecht2005). In order to determine the vertical vegetation cover, an a priori classification was carried out following the method of Tenorio Monge et al (Reference Tenorio Monge, Solano Durán and Castillo Ugalde2009), which consists of subdividing the total height of the vegetation cover into three thirds. For this, a maximum height of 25 m was used, which corresponds to the canopy height of the piedmont forest in a good conservation state (Brown et al. Reference Brown, Blendinger, Lomáscolo and García Bes2009). Then, every 20 m in each transect, the percentage of vertical vegetation cover was estimated in the vertical strata of low (>3 and <8 m height), medium (>8 and <16 m height) and upper canopy cover (>16 m height), and photographs were taken with an 18mm lens mounted on a Canon T2i camera aiming at the zenith (Huang et al. Reference Huang, Lin, Lin and Tso2014). In order to determine the understory vegetation cover, at each transect four photographs were taken in the direction of the cardinal points. At each cardinal point, two photographs were taken, one at 0–1 m height and the other at 1–2 m height, with a white panel (1 × 1 m) set 10 m away from the cardinal point as the background (Huang et al. Reference Huang, Lin, Lin and Tso2014). In addition, the number of dead fallen trees and live trees with >10 cm diameter at breast height (DBH) was recorded in a 0.1 ha area (Pinzón et al. Reference Pinzón, Spence and Langor2011, Reference Pinzón, Spence and Langor2012).
Data analysis
Data preparation
Spiders collected from the 10 pitfall traps in one sampling plot formed one sample, and each sample was treated as independent. The same procedure was carried out for forest structural variables, where samples obtained from traps in one plot formed one sample, and each sample was treated as independent. The spider and forest structure data from the 2 months and across the 3 sampling years were pooled.
Description of spider assemblages
Spider abundances were calculated as the average of individuals collected per sample (Supplementary Table S1, available online), and spider richness was calculated as the number of morphospecies and families in each management type with a nearly identical value of sample coverage for the two management types (Chao & Jost Reference Chao and Jost2012). Richness comparisons based on sample coverage ensured equal quality and completeness based on the total number of individuals in a given assemblage that belong to the species represented in the sample, allowing powerful and detailed inferences about the assemblages (Chao & Jost Reference Chao and Jost2012). Spider abundances and richness of morphospecies and families were compared between unlogged and logged sites using a t-test, after having tested for data normality (Balzarini et al. Reference Balzarini, Gonzalez, Tablada, Casanoves, Di Rienzo and Robledo2008). Sampling completeness was assessed following the criterion of Cardoso (Reference Cardoso2009) that an inventory has to be considered as ‘reasonable’ when c. 50% of the morphospecies and families was sampled, ‘comprehensive’ when 70–80% was sampled and ‘exhaustive’ when 90% was sampled. Analysis was carried out using the iNEXT package in RStudio (Hsieh et al. Reference Hsieh, Ma and Chao2019, RStudio 2019) and InfoStat software (Di Rienzo et al. Reference Di Rienzo, Casanoves, Balzarini, Gonzalez, Tablada and Robledo2016).
The structure of spider assemblages, for both the morphospecies level and the family level, was compared using the species dominance metric (DV’) of Pinzón and Spence (2010). This metric allows for the analysis of abundance distributions of morphospecies and families and enables a dominance threshold to be ascertained where established taxa are dominant, subdominant, common or rare (Pinzón & Spence 2010). This analysis results in a relative dominance value for each taxon (DV’) and threshold values obtained from the proportional presence (w) and proportional abundance (AP) of each morphospecies or family relative to other morphospecies or families according to the weight of each morphospecies or family (Spence & Pinzón Reference Spence and Pinzón2010).
Forest structural variables
Photographs taken of vertical vegetation and understory vegetation cover were converted to black and white images for the later count of the black pixels based on the percentages estimated in the field (Huang et al. Reference Huang, Lin, Lin and Tso2014). For each plot, low, medium and upper cover percentages were calculated (Tenorio Monge et al. Reference Tenorio Monge, Solano Durán and Castillo Ugalde2009). In order to avoid a positive correlation between forest structural variable relationships, a Pearson correlation (Wei et al. Reference Wei, Simko, Levy, Xie, Jin and Zemla2017) was used to ensure that the coefficient value between variables was less than +0.70 (Fig. S1) (Mammola et al. Reference Mammola, Godacre and Isaia2018). The density of live and dead fallen trees was calculated as the number of trees recorded within each 0.1ha plot. The means of the forest structural variables were compared using a Wilcoxon (Mann–Whitney U) means comparison test (Wilcoxon Reference Wilcoxon1945, Mann & Whitney Reference Mann and Whitney1947). The analysis was carried out using the RStudio interface (RStudio 2019).
Association of spiders with forest structural variables
In order to explore spider morphospecies associations with forest structural variables, a redundancy analysis was carried out after testing the linearity of the mean spider abundances matrix with the forest structural variables matrix (Van Den Wollenberg Reference Van Den Wollenberg1977, Escudero et al. Reference Escudero, Gavilán and Rubio1994, Borcard et al. Reference Borcard, Gillet and Legendre2011). Since structural variables had different units, standardization of the data was performed by scaling the value of each variable at each site to 0 mean and variance of 1 (Oksanen et al. Reference Oksanen, Guillaume Blanchet, Friendly, Kindt, Legendre and McGlinn2019). Furthermore, spider data were relativized using the Hellinger method to reduce the influence of more abundant morphospecies (Fuller et al. Reference Fuller, Newman, Irwin, Kelly and O’Halloran2014). A non-parametric multivariate analysis of similarity (ANOSIM) was performed to assess spider assemblage differences between management types (Clarke Reference Clarke1993). A redundancy analysis and an ANOSIM were later performed at the family level to assess the congruence of the results obtained using the morphospecies taxonomic level. Taxonomic sufficiency at the family level was assessed using a Mantel test (Anderson & Walsh Reference Anderson and Walsh2013), with Bray–Curtis for distance measurement, by correlating the matrices of dissimilarity of the families with those of the morphospecies (Pereira Souza et al. Reference Pereira Souza, Beggiato Baccaro, Lemes Landeiro, Franklin, Magnusson, Costa Lima Pequeno and Oliveira Fernandes2016, Cruz et al. Reference Cruz, Torres, González-Reyes and Corronca2018). In order to achieve greater clarity in the visualization of the results in the plots, we only show variables with scores greater than ±0.5 and morphospecies and families with scores greater than ±0.1 (Borcard et al. Reference Borcard, Gillet and Legendre2011). Analysis was carried out using the Vegan package (Oksanen et al. Reference Oksanen, Guillaume Blanchet, Friendly, Kindt, Legendre and McGlinn2019) in RStudio.
Identification of indicator spiders
A threshold indicator taxa analysis (TITAN) was performed to identify spider families associated with unlogged forest and to detect values along a logging gradient where families showed their greatest association with a given variable (Baker & King Reference Baker and King2010, Macchi et al. Reference Macchi, Baumann, Bluhm, Baker, Levers, Grau and Kuemmerle2019). The forest structural variables selected for this analysis were those that differentiated management types in the redundancy analysis. The TITAN used an indicator value analysis (IndVal; Dufrêne & Legendre Reference Dufrêne and Legendre2016) to identify changes in the frequency of each family between unlogged and logged sites. The TITAN, iterated along the gradient of structural variables, calculated an IndVal value, relativized the IndVal value into a ‘z’ value to reduce the effect of rare families and showed the threshold where each family demonstrated the greatest association (Macchi et al. Reference Macchi, Baumann, Bluhm, Baker, Levers, Grau and Kuemmerle2019). Analyses were carried out using the TITAN package in RStudio (King & Baker Reference King, Baker and Guntenspergen2014, RStudio 2019).
Results
Spider assemblages
In unlogged sites, 91 spider morphospecies and 29 spider families were collected among 1067 individuals, and the sample coverage estimates were 96.63% and 99.53%, respectively. In logged sites, 83 morphospecies and 27 families were collected among 833 individuals, and the estimated sample coverages were 96.40% and 99.28%, respectively. There was no significant difference between unlogged and logged sites in spider mean abundances (Abunlogged = 0.55; Ablogged = 0.43; t = –1.54; p = 0.14) or morphospecies richness (Sunlogged = 21.40; Slogged = 18.27; t = –1.42; p = 0.16), while family richness was higher in unlogged sites (Sunlogged = 13.73; Slogged = 11.33; t = –2.34; p = 0.02). Morphospecies sampling completeness reached 66.91% and 63.19% at logged and unlogged sites, respectively, while family sampling completeness reached 92.30% and 88.18% at logged and unlogged sites, respectively.
In unlogged sites, three morphospecies belonging to Lycosidae (m69, m459 and m656) and one belonging to Hahniidae (m756) were dominant; morphospecies belonging to Linyphiidae (m246), Ctenidae (m598 and m40), Micropholcommatidae (m57), Pholcidae (m193), Salticidae (m780), Nemesiidae (m53), Araneidae (m90), Corinnidae (m757) and Amaurobiidae (m10) were subdominant; the rest of the morphospecies were rare (Table S2). At the family level, the Lycosidae family was dominant, Ctenidae, Linyphiidae, Hahniidae, Pholcidae, Salticidae, Micropholcommatidae, Theridiidae, Nemesiidae, Araneidae, Anyphaenidae, Corinnidae and Amaurobiidae were subdominant and the rest of the families were rare (Table S2). In logged sites, morphospecies belonging to Lycosidae (m459 and m656), Corinnidae (m757) and Linyphiidae (m246) were dominant; morphospecies belonging to Ctenidae (m598), Linyphiidae (m070), Micropholcommatidae (m57), Amaurobiidae (m10), Lycosidae (m69) and Clubionidae (m042) were subdominant; the rest of the morphospecies were rare (Table S2). At the family level, the Lycosidae were dominant, Linyphiidae, Corinnidae, Ctenidae, Salticidae, Micropholcommatidae, Anyphaenidae, Gnaphosidae and Amaurobiidae were subdominant and the rest of the families were rare (Table S2).
Forest structural variables
Upper canopy cover percentage, leaf litter depth and the number of live and dead fallen trees were significantly higher in unlogged sites than logged sites, while lower cover percentages were significantly higher in logged sites than in unlogged sites (Table 1).
Table 1. Forest structure variables for unlogged and logged piedmont forest sites in north-western Argentina. Values are shown as means ± standard deviations. Comparison between management types was conducted using a Mann–Whitney test (W; p-values are shown).
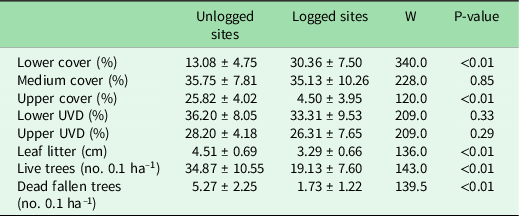
UVD = understory vegetation cover.
Associations of spiders with forest structural variables
Assemblages of morphospecies and families of spiders showed the same pattern of differentiation between unlogged and logged sites (Fig. 2). Morphospecies with the highest association with unlogged sites belonged to Pholcidae (m193 and m107), Nemesiidae (m53), Hahniidae (m756), Lycosidae (m69), Salticidae (m780), Ctenidae (m40 and m54), Mysmenidae (m48), Araneidae (m90) and Scytodidae (m697) (Table S3). These morphospecies were associated with a higher percentage of upper canopy cover and a greater density of live and fallen dead trees (Fig. 2a). Logged sites were represented by morphospecies of the families Corinnidae (m757), Lycosidae (m656 and m459), Gnaphosidae (m80), Linyphiidae (m246 and m070) and Salticidae (m061) (Table S3). These morphospecies were associated with a higher percentage of low canopy cover (Fig. 2b). Morphospecies showed an 85% congruence with the family taxonomic level (R = 0.85; p < 0.05).
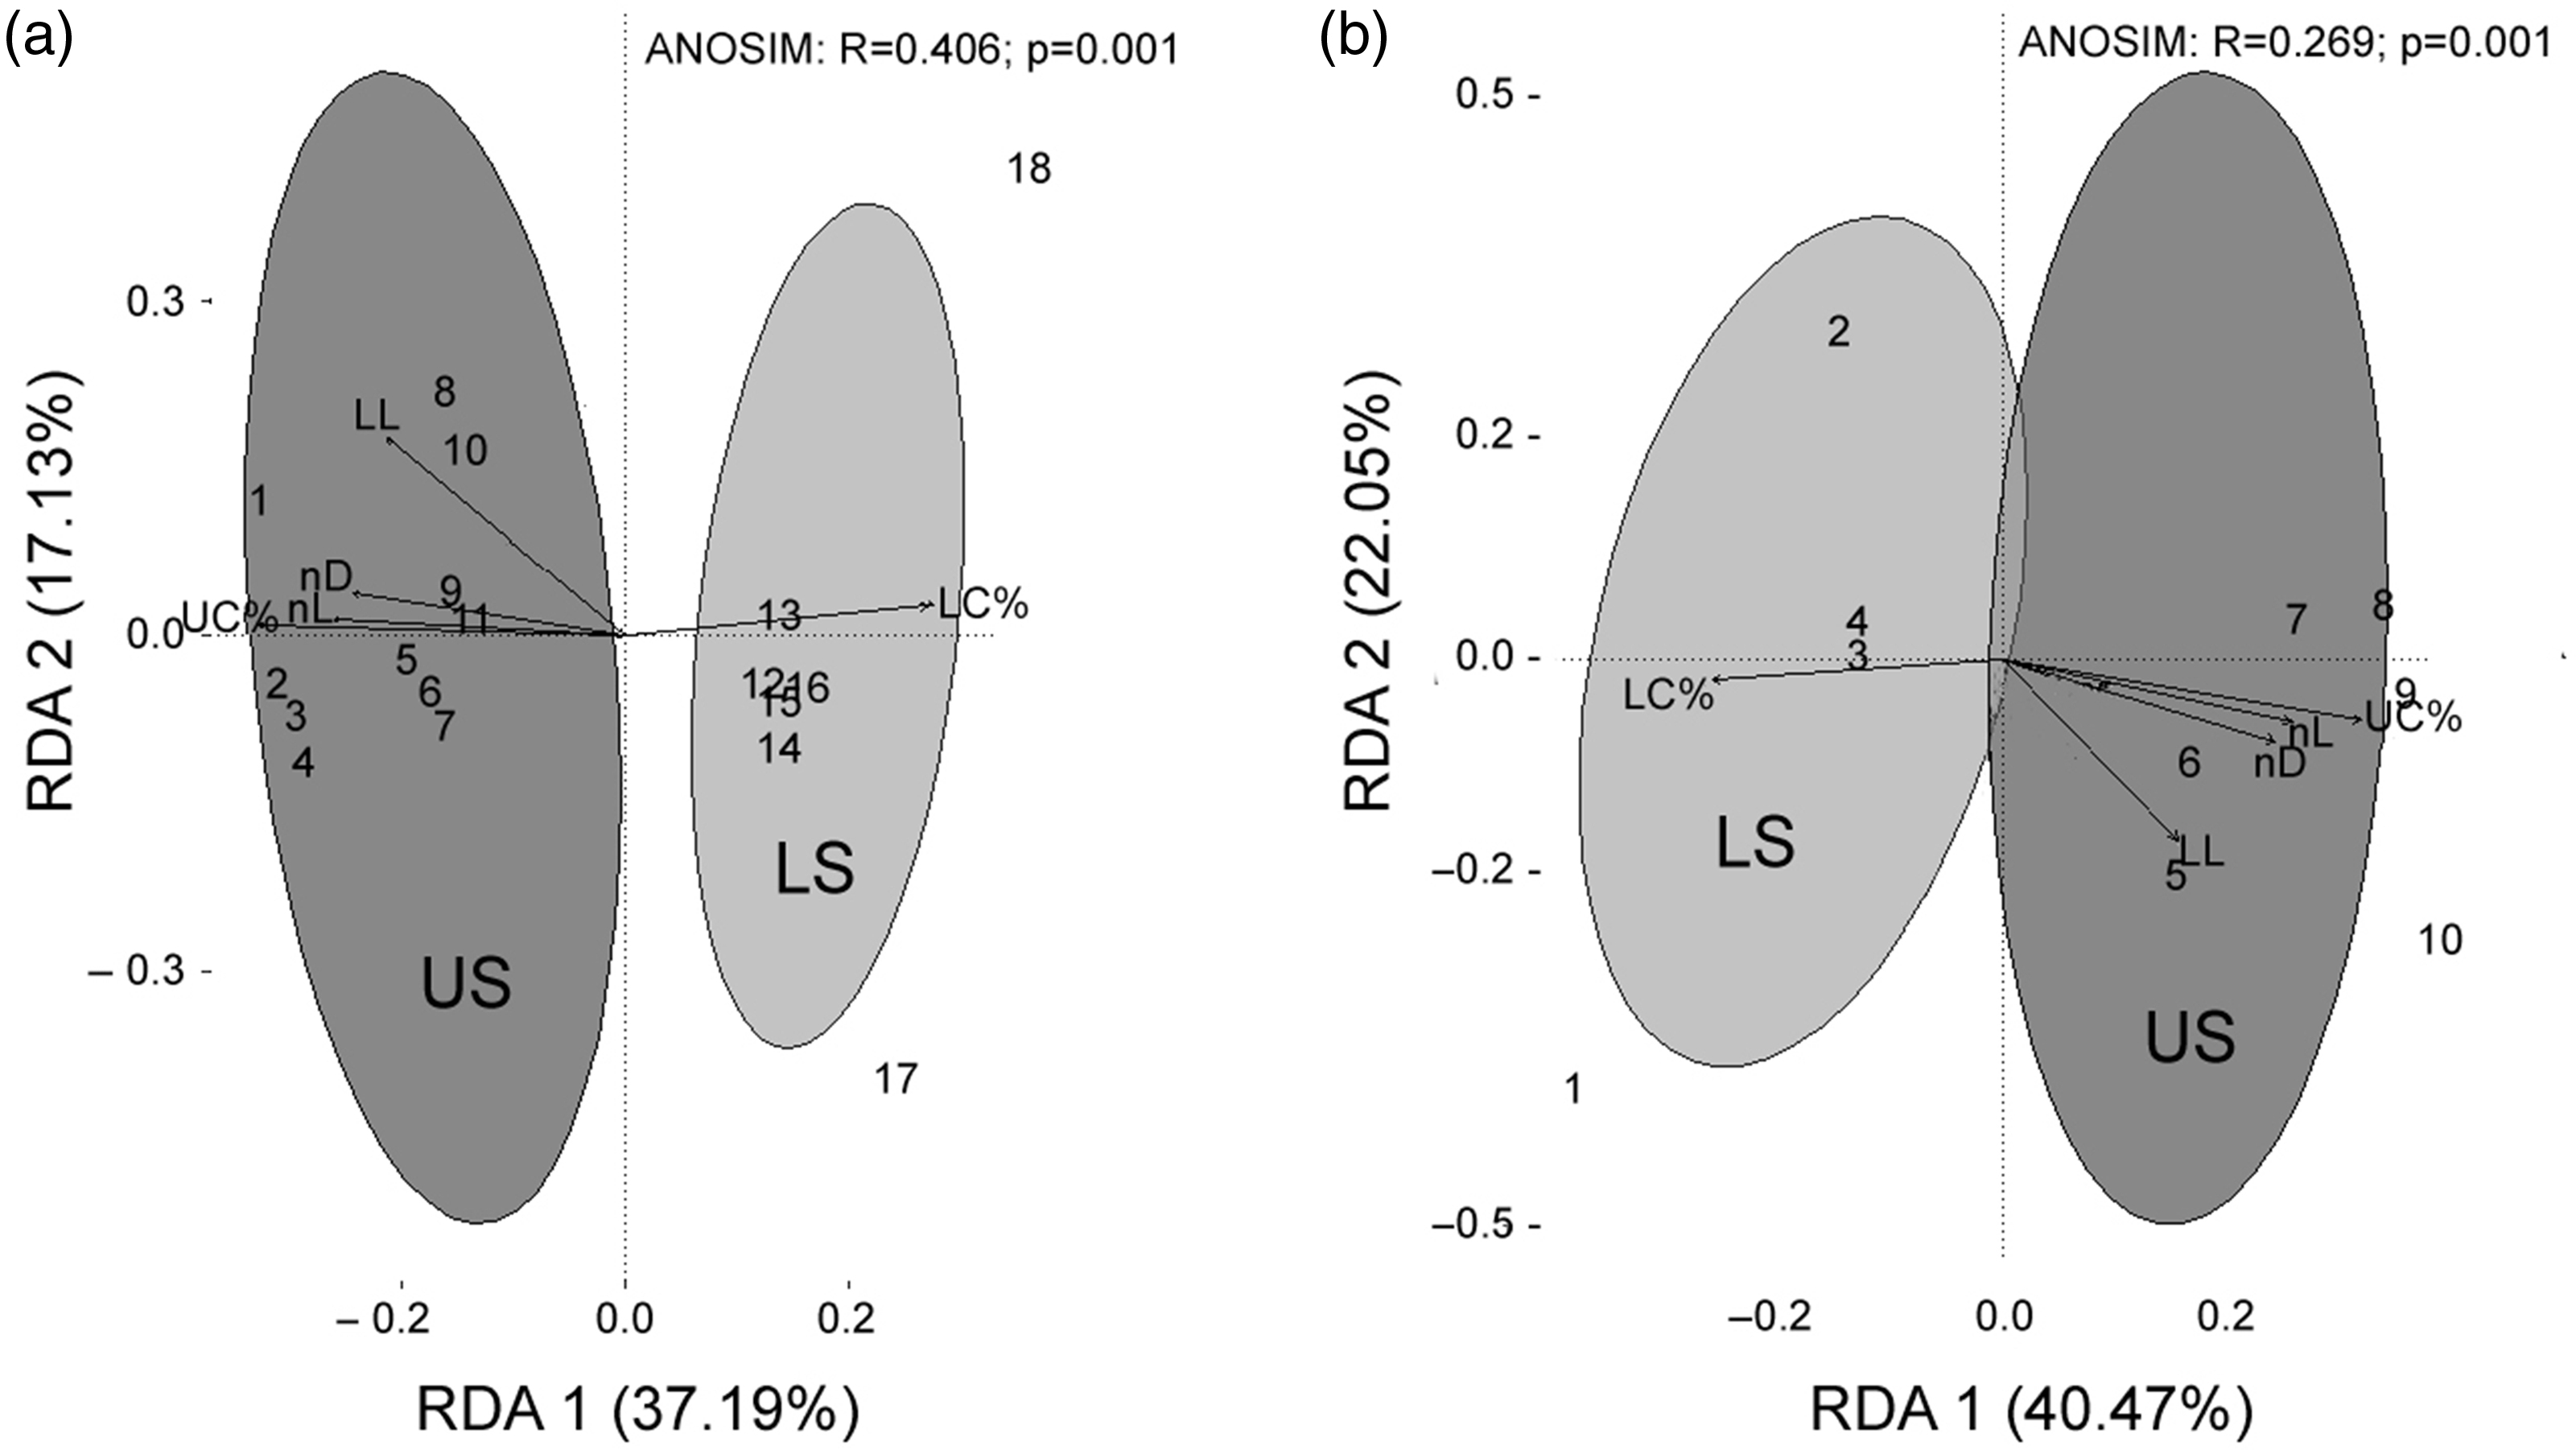
Fig. 2. Redundancy analysis for assemblages of (a) morphospecies and (b) spider families in unlogged (dark grey) and logged (light grey) piedmont forest sites in north-western Argentina. Values in parentheses are axes variation percentages. In (a), 1 = Phol m193, 2 = Neme m53, 3 = Hahn m756, 4 = Lyco m69, 5 = Salt m780, 6 = Cten m40, 7 = Mysm m48, 8 = Cten m54, 9 = Phol m107, 10 = Aran m90, 11 = Scyt m697, 12 = Liny m070, 13 = Salt m061, 14 = Liny m246, 15 = Lyco m459, 16 = Gnapho m80, 17 = Lyco m656, 18 = Cori m757. In (b), 1 = Corinnidae, 2 = Linyphiidae, 3 = Zodariidae, 4 = Oonopidae, 5 = Ctenidae, 6 = Scytodidae, 7 = Mysmenidae, 8 = Hahniidae, 9 = Nemesiidae, 10 = Pholcidae. ANOSIM = analysis of similarity; LC% = low canopy cover percentage; LL = leaf litter; LS = logged sites; nD = number of dead fallen trees; nL = number of live trees; RDA 1 = multivariate variation axis 1; RDA 2 = multivariate variation axis 2; UC% = upper canopy cover percentage; US = unlogged sites.
Indicator spider identification
Five families (Mysmenidae, Nemesiidae, Theridiidae, Pholcidae and Hahniidae) had positive responses to upper canopy cover exceeding 20% (Fig. 3a). The Nemesiidae, Tetragnathidae, Hahniidae and Pholcidae had positive responses to more than two individual dead fallen trees in 0.1 ha (Fig. 3b). Pholcidae, Theridiidae, Mysmenidae, Hahniidae and Tetragnathidae had a positive response to more than 15 individual live trees in 0.1 ha (Fig. 3c). For the tree forest structural variable gradients, the Pholcidae showed the maximum contribution as an indicator at the point of 24% of canopy cover, 2.5 individual dead fallen trees per 0.1 ha and 32 individual live trees per 0.1 ha (Fig. 3).
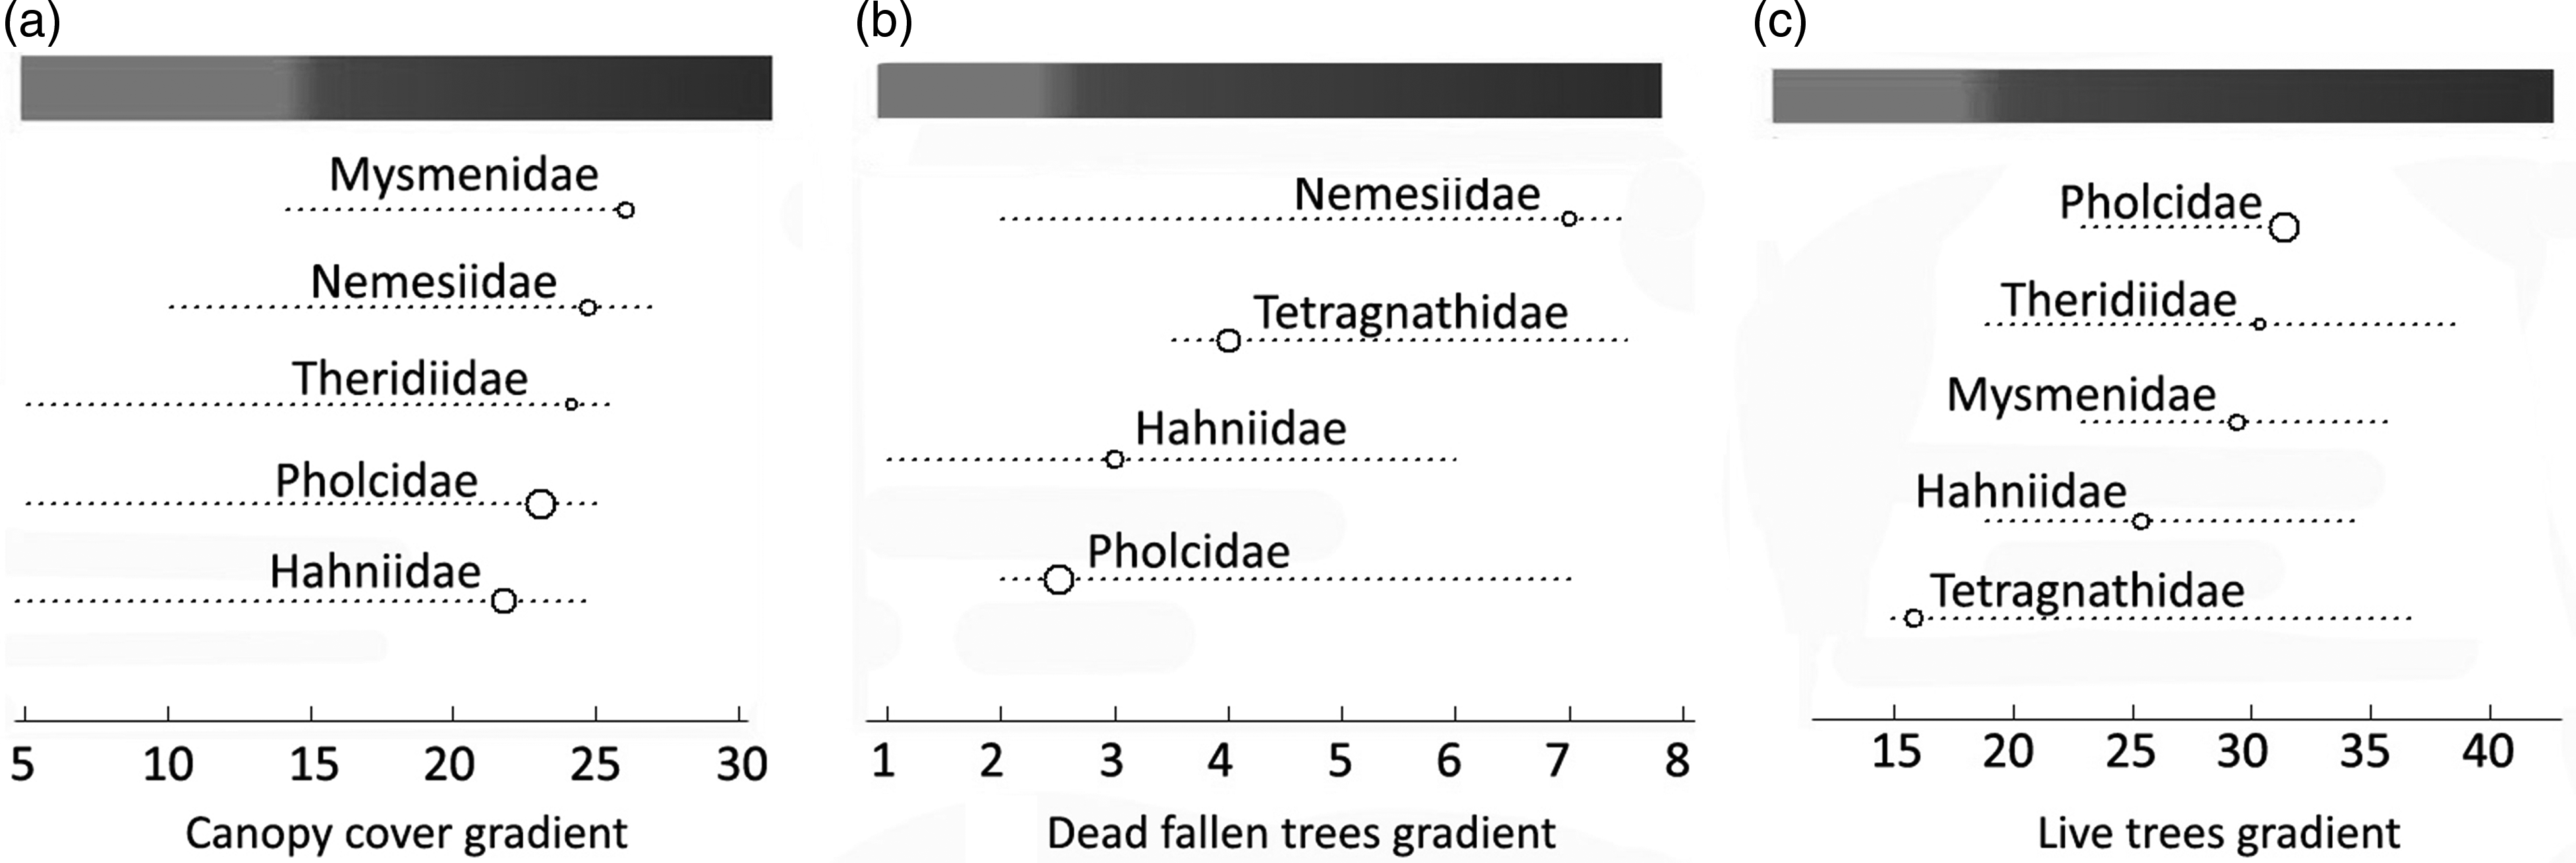
Fig. 3. Responses of spider families identified as relative indicators of unlogged sites to (a) upper canopy cover, (b) dead fallen trees and (c) live trees (>10 cm diameter at breast height) gradients in piedmont forests of north-western Argentina. The size of the circles indicates the relative contribution of the family as an indicator at that point on the gradient. The shaded bar denotes logged (light grey) and unlogged (dark grey) values for the structural variable gradient.
Discussion
We infer that spiders in piedmont forest sites of north-western Argentina responded to logging, which especially reduced family richness and affected spider assemblages associated with a mature forest structure. Logging changed forest structure, diminishing the canopy cover percentage, the number of dead fallen trees and the number of live trees with DBH >10 cm. In Amazonian tropical forests, tree extraction is negatively associated with dung beetle richness, generating a rapid reduction in the diversity of beetles as a consequence of the decrease in biomass that these insects require (França et al. Reference França, Frazão, Korasaki, Louzada and Barlow2017). In Canada, similar effects of logging and clear-cuts on spiders were found, where ground-dwelling spiders were associated with gradients generated by percentage cover of coarse woody debris, leaf litter depth and canopy cover (Larrivée et al. Reference Larrivée, Fahrig and Drapeau2005). Changes in these forest structure variables produce novel microclimatic conditions that are unsuitable for forest specialist arthropods, forcing them to abandon their habitats (Bicknell et al. Reference Bicknell, Phelps, Davies, Mann, Struebig and Davies2014, Burivalova et al. Reference Burivalova, Şekercioǧlu and Koh2014, França et al. Reference França, Frazão, Korasaki, Louzada and Barlow2017). This is perhaps because these spiders have specific habitat requirements, so changes in forest structure associated with mature forest resulted in the observed changes (Georgiev et al. Reference Georgiev, Chao, Castro, Chen, Choi and Fontaine2020). However, taking into account that after the last tree extraction (2014) in logged sites the succession process had already started, all of these results should be interpreted with caution. In this work, only pitfall traps were used for the sampling of spiders, which are known to under-represent more sedentary ground-dwelling arthropods, but the effectiveness of this method is reflected in the sampling completeness values, which were close to or exceeded 70% of the observed richness of morphospecies and families sampled (Cardoso Reference Cardoso2009, Cruz et al. Reference Cruz, Torres, González-Reyes and Corronca2018).
In our study, Mysmenidae, Nemesiidae, Theridiidae, Pholcidae, Hahniidae and Tetragnathidae were associated with upper canopy cover exceeding 20%, more than two dead fallen trees and more than 15 live trees in 0.1 ha, found in unlogged forests. Mysmenidae spiders have small body size, which would make them sensitive to environmental change in forest ecosystems (Blanco Vargas et al. Reference Blanco Vargas, Amat García and Flórez Daza2003, Petcharad et al. Reference Petcharad, Miyashita, Gale, Sotthibandhu and Bumrungsri2016), and they have been associated with undisturbed habitats with a dense vegetation cover in previous studies (Melic Reference Melic2001, Uehara Prado Reference Uehara Prado2009, Malumbres Olarte et al. Reference Malumbres Olarte, Vink, Ross, Cruickshank and Paterson2013, Pereira et al. Reference Pereira, Nogueira Cardoso, Brescovit, Iuñes de Oliveira Filho, Segat, Riviera Duarte Maluche Baretta and Baretta2021). The Nemesiidae are associated with undisturbed forest with a deep and moist layer of litter at the base of large trees where they build their burrows (Uehara Prado Reference Uehara Prado2009, Grismado and Goloboff Reference Grismado, Goloboff, Roig Juñent, Claps and Morrone2014, Pereira et al. Reference Pereira, Nogueira Cardoso, Brescovit, Iuñes de Oliveira Filho, Segat, Riviera Duarte Maluche Baretta and Baretta2021), and because they rarely abandon them, overturning such large trees would negatively affect these spiders (Nadal et al. Reference Nadal, Achitte-Schmutzler, Zanone, Gonzalez and Avalos2018). Although the Theridiidae adapt to different types of habitats (Fuller et al. Reference Fuller, Newman, Irwin, Kelly and O’Halloran2014, Avalos et al. Reference Avalos, Achitte-Schmutzler and De los Santos2018), there is some evidence that they prefer shaded and moist mature forest habitats and are sensitive to structural changes in their habitats (Larrivée et al. Reference Larrivée, Fahrig and Drapeau2005, Muff et al. Reference Muff, Kropf, Frick, Nentwig and Schmidt Entling2009, Petcharad et al. Reference Petcharad, Miyashita, Gale, Sotthibandhu and Bumrungsri2016, Pereira et al. Reference Pereira, Nogueira Cardoso, Brescovit, Iuñes de Oliveira Filho, Segat, Riviera Duarte Maluche Baretta and Baretta2021). There is evidence in the tropical and boreal forests that the Pholcidae and Hahniidae show greater richness and abundance in primary forests than in secondary ones (Floren & Deeleman-Reinhold Reference Floren and Deeleman-Reinhold2005, Larrivée et al. Reference Larrivée, Fahrig and Drapeau2005, Rosa et al. Reference Rosa, Santos, Brescovit, Mafra and Baretta2018, Cernecká et al. Reference Cernecká, Mihál, Gajdos and Jarcuska2020), and because their species are sedentary and associated with characteristics of the forest interior, these spiders would be sensitive to logging practices in native areas (Larrivée et al. Reference Larrivée, Fahrig and Drapeau2005, Halaj et al. Reference Halaj, Halpern and Yi2008, Huber Reference Huber, Roig Juñent, Claps and Morrone2014, Pereira et al. Reference Pereira, Nogueira Cardoso, Brescovit, Iuñes de Oliveira Filho, Segat, Riviera Duarte Maluche Baretta and Baretta2021). Tetragnathidae spiders have been associated with continuous forest habitat in the Atlantic Forest (Nogueira & Pinto da Rocha Reference Nogueira and Pinto da Rocha2016) and are more abundant in undisturbed than in disturbed forest (Maya Morales et al. Reference Maya Morales, Ibarra Núñez, León Cortés and Infante2012). Thus, the reduction in forest structure variables such as canopy cover percentage, number of dead fallen trees and number of live trees under the threshold found here would have negative effects on these families. In oak forests in the Czech Republic, rare and endangered spider species are associated with intermediate percentages of canopy closure, which generates shaded to partially shaded microhabitats, while more open canopies are suitable for spiders that can tolerate more extreme conditions (Košulič et al. Reference Košulič, Michalko and Hula2016). Our results show that the spiders identified as indicators are dominant or subdominant in unlogged sites and become rare in logged sites. Many other taxonomic groups, such as amphibians, beetles and birds, show a decrease in their richness as logging reaches an intensity of 10 trees ha–1 due to their sensitivity to the hotter and drier microclimates generated by canopy openness (Aguilar-Amuchastegui & Henebry Reference Aguilar-Amuchastegui and Henebry2007, Burivalova et al. Reference Burivalova, Şekercioǧlu and Koh2014). Furthermore, ecological specialization has been shown to be responsible for observed changes in several taxonomic groups, where forest specialists are unable to adapt to the new conditions, while habitat generalists are favoured (Malcolm & Ray Reference Malcolm and Ray2000, Woltmann Reference Woltmann2003, Clarke et al. Reference Clarke, Pio and Racey2005).
Additionally, our results show that the family taxonomic level is an adequate surrogate for spider morphospecies and that this taxonomic level summarizes the responses to changes in logged forests of the species they contain. Although our results show that morphospecies richness did not differ from logged to unlogged forest while at the family level it did, two aspects need to be taken into account. On the one hand, while the presence of individual morphospecies across the landscape may be scattered, showing no differences among sites, the accumulation of morphospecies that show a common collective behaviour within a family would allow detection of these changes (Gill et al. Reference Gill, Woinarski and York1999). On the other hand, as suggested by results obtained from the ordinations for morphospecies and families, the ecological responses of the spider assemblages to changes in forest structural variables are quite similar at both levels of taxonomic resolution. In other arthropods, the similar suitability of families for summarizing species responses to environmental changes has been shown, where correlations between species richness and genus, family or order were strong, highlighting the benefits of higher-taxa analysis as species-level identification hinders the analysis of common responses to logging and other disturbances due to the ecologies of the morphospecies being unknown (Basset et al. Reference Basset, Charles, Hammond and Brown2001, Heino & Soininen Reference Heino and Soininen2007, Pereira et al. Reference Pereira, Nogueira Cardoso, Brescovit, Iuñes de Oliveira Filho, Segat, Riviera Duarte Maluche Baretta and Baretta2021). Brennan et al (Reference Brennan, Ashby, Majer, Moir and Koch2006) suggest that spider families offer trustworthy preliminary information on forest conservation status without identifying genera or species. Lin et al (Reference Lin, You, Vasseur, Yang, Liu and Guo2012) reported that the species richness of spiders was strongly correlated with both genus and family levels and that the responses of the three taxonomic levels showed the same pattern in different environmental conditions, and even though their results show that genus is a more reliable predictor for morphospecies/species than family, they recognize the importance of the latter higher taxon in rapid assessment. Reducing the complexity of identifying to lower taxonomic levels is particularly useful in speciose ecosystems, such as the piedmont forest of north-western Argentina, where information about spiders is scarce and there are few taxonomic specialists (Rubio et al. Reference Rubio, Damborsky and Corronca2004, Ferretti et al. Reference Ferretti, Pompozzi, Copperi, Schwerdt, González and Pérez-Miles2014, Torres et al. Reference Torres, González-Reyes and Corronca2017, Cruz et al. Reference Cruz, Torres, González-Reyes and Corronca2018).
We suggest that spider families represent an adequate tool for monitoring the ecological sustainability of logging operations. As stated by Baldissera et al (Reference Baldissera, Oliveira de Quadros, Galeti, Lopes Rodrigues, Lazzarotto and de Oliveira2020), spider families are made up of species that show similar behaviours in the way they use the microhabitat. In addition, recent studies have focused on the use of family diversity to assess the responses of spider assemblies to disturbances (Rosa et al. Reference Rosa, Santos, Brescovit, Mafra and Baretta2018, Baldissera et al. Reference Baldissera, Oliveira de Quadros, Galeti, Lopes Rodrigues, Lazzarotto and de Oliveira2020, Pereira et al. Reference Pereira, Nogueira Cardoso, Brescovit, Iuñes de Oliveira Filho, Segat, Riviera Duarte Maluche Baretta and Baretta2021), and they conclude that such an approach is appropriate for rapid biodiversity assessments and highlight its importance for sites where the taxonomy of spiders is poorly known. In particular, the Pholcidae and Hahniidae are families associated with mature unlogged forests with high upper canopy cover and a density of live and fallen dead trees (Floren & Deeleman-Reinhold Reference Floren and Deeleman-Reinhold2005, Huber Reference Huber, Roig Juñent, Claps and Morrone2014), and they could also be useful for monitoring. Both families were identified as accurate indicators of native forest areas in other studies carried out in the Neotropics (Rinaldi & Ruiz Reference Rinaldi and Ruiz2002, Pereira et al. Reference Pereira, Nogueira Cardoso, Brescovit, Iuñes de Oliveira Filho, Segat, Riviera Duarte Maluche Baretta and Baretta2021), which would allow us to suggest that these spiders would be accurate indicators within the neotropical forests.
Furthermore, although in this work no spider abundance values were identified for the determination of thresholds, our results provide threshold values for some key forest structural variables that should be retained in logging operations to ensure the conservation of spider assemblages of mature forests with more than 20% upper (>16 m) canopy cover, at least 20 dead fallen trees and 150 live trees per hectare. These structural variable values can be easily measured by foresters and can be incorporated in adaptive forest management monitoring programmes (Bunnell & Dunsworth Reference Bunnell and Dunsworth2009). This is particularly relevant bearing in mind that the piedmont forest of north-western Argentina, like many other neotropical forests, is being logged in the absence of sustainability criteria, and despite it having great biodiversity, taxonomic specialists for identifying species are very few (Rivera et al. Reference Rivera, Politi, Lizárraga, Chalukian, de Bustos and Ruíz de los Llanos2015, Cruz et al. Reference Cruz, Torres, González-Reyes and Corronca2018, Politi & Rivera Reference Politi and Rivera2019). Therefore, providing a monitoring scheme that sets easily measurable targets can be an effective tool for ensuring the conservation of biodiversity in logged forests. Although it remains to be understood whether spiders are indicative of other ground-active arthropods, we suggest including spiders in monitoring schemes to complement the information obtained from more readily used groups, such as charismatic vertebrates (Zou et al. Reference Zou, Van Der Werf, Liu and Axmacher2019).
Supplementary material
To view supplementary material for this article, please visit https://doi.org/10.1017/S0376892921000230.
Acknowledgements
We thank the SECTER – UNJu and CEBio Foundation for their support during fieldwork; IdeaWild, who provided equipment for spider identification; Santa Bárbara Forest and Ledesma Companies and the National Parks Administration for allowing sampling on their land; and Environment and Sustainable Development Secretary of Salta province and Environment Ministry of Jujuy province for sampling permission. We also appreciate the help of S Madregal, R Terán, A Blanco, A Barconte, M Nicolás, volunteers, students and colleagues during sampling field trips and the help of P Tanco with editing. Finally, we thank to the editor and the three anonymous reviewers who improved our manuscript.
Financial support
This work was supported by a grant given by the National Scientific and Technical Research Council (CONICET) as well as funds provided by Agencia Nacional de Promoción Científica y Tecnológica (PICT 2012-0892, PICT 2014-1338), CONICET (PIP 112-201201-00259 CO) amd CONICET/UNJu (PIO 1402014100133).
Conflict of interest
None.
Ethical standards
None.


