


INTRODUCTION
This paper revisits my earlier analysis of the global wood market (Clark Reference Clark (now Ajani)2001), which sought unsuccessfully to identify evidence of a looming global wood shortage. Instead I found that real (inflation adjusted) export prices for wood declined over the long term, caused partially by resource saving by manufacturers of wood products (paper, sawn timber and wood panels) dampening the derived demand for wood. Since my previous analysis, another nine years of FAO data have become available, and China's economic expansion has taken hold. China's strong growth in wood products consumption stimulates an investigation of its derived demand for wood through the theory of induced innovation (Hicks Reference Hicks1932; Hayami & Ruttan Reference Hayami and Ruttan1970). The theory proposes that commercially practised innovation is directed to saving the limiting (usually actual or expected higher priced) factors of production.
By saving wood, producers of paper and solid wood products increase wood productivity (wood products produced per unit of wood input) and enhance their competitiveness. Significant resource saving opportunities have been identified for the wood products industry and include plantation tree selection and breeding, wood-saving pulp and other product manufacturing technologies, substitute product development, recycling and innovation in product application (Sedjo & Lyon Reference Sedjo and Lyon1990; von Weizäcker et al. Reference von Weizsäcker, Lovins and Lovins1997; Hawken et al. Reference Hawken, Lovins and Lovins1999). These analyses focus on the firm or product level. However, investigations into the future demand for wood concentrate on predicting the future for wood products in total (see for example Zue et al. Reference Zue, Tomberlin and Buongiorno1998), invariably giving less consideration to resource productivity when converting these projections into future wood requirements. Fossil-based energy price increases and growing awareness of the carbon stocks in natural forests (Keith et al. Reference Keith, Mackey and Lindenmayer2009, Reference Keith, Mackey, Berry, Lindenmayer and Gibbons2010) are likely to stimulate greater investigation of opportunities for wood saving through increased resource productivity.
In this paper, I investigate the growth in global consumption of wood to make paper and solid wood products and the continuing uncoupling of wood from finished wood products through wood saving. The research addresses the following questions:
(1) How has global consumption of wood trended since the 1980s relative to earlier decades?
(2) How is wood saving by paper makers affecting the demand for wood?
(3) How is wood saving by producers of solid wood products affecting the demand for wood?
(4) What is the potential for additional wood saving in the global wood products industry?
(5) Are price trends indicating a looming global wood shortage?
(6) What is the global economic contribution of the wood and wood products industry and is this contribution changing?
The analysis of the global wood market is just one information component required for building coherent wood-based industry and forest policy. In the discussion, linkages are made between trends in global wood consumption, biodiversity conservation and climate change as a contribution to the task of building such a policy.
METHODS
In this study, I define wood as the fibre under the bark of trees, extracted as logs, chips and other wood particles. The focus of this paper is wood used to make industrial wood products, namely solid wood products (such as sawn timber and wood panels) and paper. Industrial wood products account for around half of the wood used globally each year (FAO [Food and Agriculture Organization of the United Nations] 2009); the remainder (wood used for fuel) was not included in this analysis. Wood for fuel is a different market requiring additional analysis beyond the scope of this paper. I define plantations as trees planted and managed in an agricultural context primarily for wood; regeneration requires harvesting and replanting. Natural (or native) forests are defined as forest ecosystems in which the tree species are predominantly native (or indigenous) to the locality and where natural regenerative processes operate either fully or in part for the recovery of canopy structure following natural or artificial disturbance. This includes most previously logged natural forests (usually referred to as regrowth or secondary forests). I calculated consumption from FAO data by deducting exports from production and adding imports. Sawn timber is an exception, with production, not consumption, data used in the global analysis because of anomalies in sawn timber import and export statistics. Changes in stock levels cannot be allowed for because stocks data are not available. Short term oscillations in stock levels will not distort the conclusions from the medium- to long-term analysis of this paper. Despite being the most comprehensive publicly available global forestry data, the FAO advises that their data sets contain anomalies, and revisions are a standard practice.
I calculated growth rates over long periods using ordinary least squares logarithmic regression incorporating all annual data over the period of the analysis. This removes the distortions of compound growth rate calculations based on end-point data.
The selection of a suitable time period depends on the purpose of the analysis and requires judgment. I selected the 27-year period from 1980 to 2007 (latest FAO published data at the time of the research) for most of the analyses using the subjective assessment that, whilst not removing all of the immediate aftermath of the 1970s oil shocks, it gave enough of the time period before China's exponential economic growth to observe its effects. Some of the paper industry analysis has been constrained to the period since 1990, to avoid distortions induced by FAO product reclassifications.
For clarification, the analysis investigates the worldwide trend increase in wood productivity as evidenced in the differing consumption growth rates for wood and wood products. Projecting future wood and wood products consumption and wood supply is beyond the scope of this paper; however, such projection work should include wood productivity trends.
RESULTS
How has global consumption of wood trended since the 1980s relative to earlier decades?
Globally, the volume of wood used to make wood products increased by an average 1.6% per annum during the western world's economic expansion of the 1960s through to the late 1980s. The stagnant 1990s, and Russia's economic collapse that followed, were offset by the rising economies of China, in particular, and India (Fig. 1). Over the medium term, another dip in wood consumption can be expected with the current global economic downturn followed by an upturn driven largely by economic expansion in China and India.
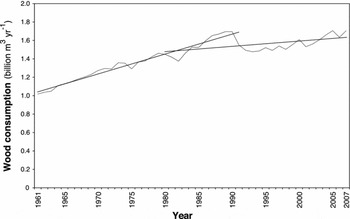
Figure 1 Global wood consumption 1961–2007. Lines are linear trends over 1961–1990 and 1980–2007. Source: FAO (2009).
In the ups and downs, one thing stands out: wood as an input to global paper, sawn timber and wood panels manufacturing is no longer a high-growth extractive industry. Over the quarter century, post the 1970s oil shock period (1980 to 2007), global consumption of wood to make paper, sawn timber and wood panels increased by an average of only 0.4% per annum (Table 1). Slowing growth in wood products consumption (particularly sawn timber) in high-income countries (Clark Reference Clark (now Ajani)2001) and resource saving strategies across the wood products industry (discussed below) explains the remarkably low growth in global wood use. Since the early 1980s, these structural changes have offset substantially the pressure on global wood resources from rapidly-growing low per person income economies, most notably China. These trends in consumption and wood resource productivity are best understood through an analysis of the main wood product groupings presented below.
Table 1 Growth in global wood and wood products consumption. Source: FAO (2009). aPaper consumption data reported in tonnes have been converted to m3 assuming 1 m3 of paper weighs on average 0.75 tonnes. bDue to anomalies in global sawn timber import and export data, sawn timber production data are reported in the table: consumption data are used for China and India to allow for their sawn timber imports. India's trend growth in sawn timber consumption uses FAO data with many years of production non-reporting. As India's measurement and reporting of sawn timber statistics improves, substantial revisions can be expected. cData on wood embodied in imported wood products are not available (na).

How is wood saving by paper makers affecting the demand for wood?
FAO statistics disaggregate global paper production, imports and exports into four major paper groups: wrapping and packaging; printing and writing; newsprint; and household and sanitary. Wrapping and packaging papers account for half the volume of paper consumed globally. These papers, together with printing and writing papers, accounted for nearly 80% of global paper consumption in 2007 (Table 2). With the exception of newsprint, growth in global consumption of all paper groups has been high and sustained (Table 2).
Table 2 Global paper consumption by paper grade. Source: FAO (2009).

In aggregate, paper is made predominantly from wood pulp and recycled paper, each contributing roughly equal volumes for papermaking. Non-wood pulp (made from fibrous vegetable materials other than wood) accounted for 5% of material input for paper production in 2007 (Fig. 2). The mix of material inputs differs by paper grade. Wrapping and packaging papers are made predominantly from long-fibred softwoods (to capture their strength properties) and recycled paper (to avoid the relatively high cost of wood pulping). Short-fibred hardwoods are increasingly favoured for the smoother surfaced printing and writing papers with quality-conscious paper makers remaining less attracted to recycled fibre input. From a technical perspective, these different fibre inputs, including recycled paper, are highly substitutable for making most papers (Higgins Reference Higgens1991; Goik Reference Goik1994).

Figure 2 Fibre input for global paper production. Source: FAO (2009).
Despite the high growth in paper consumption, the associated wood consumption is growing much more slowly. This reflects factors operating at both the wood to pulp, and the pulp to paper processing stages. The increased pulp yields achievable through plant breeding and selection in a plantation regime (i.e. agriculture) means cost-conscious pulp and paper producers can reduce the amount of wood to make the same amount of pulp. Macrae et al. (Reference Macrae, Cotterill and Brolin1999) reported 20% reductions in wood input per unit of pulp output using selected species in plantation growing regimes. Cost reduction also motivates pulp producer interest in high-yielding pulping technologies. For example, Sedjo and Lyon (Reference Sedjo and Lyon1990) reported chemi-thermo-mechanical (CTM) pulping that almost doubles traditional chemical pulp yields per unit of wood input. Quantification of these two resource saving strategies is not possible using FAO forestry data because the FAO does not separate plantation (agricultural tree cropping) from natural forest (self-regenerating ecosystems) wood or report the actual amount of wood used to make pulp or paper.
Recycling is the third factor dampening the paper industry's derived demand for wood. By recycling paper, paper makers can spread their higher cost virgin pulp across a bigger volume of paper production and therefore reduce wood inputs. Slightly more paper is now being made using non-wood pulp. The FAO reports recycled fibre and non-wood pulp used to make paper (Fig. 2).
The net result is an uncoupling of paper consumption growth from wood pulp growth, which can be investigated using FAO data. (The preferable comparison is paper consumption growth with wood input for paper making, but data limitations prevent this.) While global paper consumption increased by an average 3.2% per annum over 1980 to 2007, the use of wood pulp to meet this paper consumption grew by only 1.4% per annum over the same period. The use of recycled paper grew by 5.2% per annum and non-wood pulp by 3.0% per annum (Fig. 2). Relative to the 1980s, the period since 1990 saw a slowing in wood pulp and non-wood pulp use and acceleration in recycled fibre use.
Notwithstanding the data limitations (notably the failure to report plantation and natural forest wood input for pulp production), as wood pulp input for global paper production grew at 1% per annum since 1990 (Fig. 2), growth in actual wood input is likely to be less than 1% per annum.
China
China accounted for 20.5% of global paper consumption in 2007. Its mix of papers consumed mirrors that of the rest of the world, but with a greater emphasis on packaging papers sold to the manufacturing sector (Table 3). China is self-sufficient in paper, producing 99% of the paper it consumed in 2007 (FAO 2009). Its fibre input for paper making, however, differs markedly from most developed countries. Most of China's wood pulp (60%) is imported. As a consequence, and possibly with higher consumer acceptance, China's paper producers have favoured recycled paper over imported wood pulp to feed their soaring paper production. Recycled papers accounted for 70% of the fibre input for China's paper production in 2007 (Figure 3). This compares with the rest of the world where recycled paper accounted for 46% of fibre input in 2007. China imported 43% of the recycled paper used to make paper in 2007 (FAO 2009).
Table 3 Mix of papers consumed in China and the rest of the world in 2007 (%). Source: FAO (2009).


Figure 3 Fibre input for Chinese paper production. Source: FAO (2009).
From a resource productivity perspective, China's paper industry performs significantly better than the rest of the world. In 2007, China's paper producers on average used 0.2 tonnes of wood pulp to make a tonne of paper compared with an average 0.5 tonnes of wood pulp in the rest of the world. While resource productivity in China's paper industry has continued to improve since the early 2000s, it has remained stagnant in the rest of the world (Fig. 3).
A surge is evident in the share of wood pulp used in Chinese paper production over the second half of the 1990s (1996 to 2001; Fig. 3). While growth in paper consumption eased slightly, the use of wood pulp from coming-on-stream pulp mills soared by 80% and recycled paper use increased by 40%. Chinese domestic production and imports contributed equally to the surge in wood pulp use. This positioning has reversed since 2001, as the use of recycled paper grew at slightly more than double the rate of wood pulp input.
Another distinguishing trend in China's paper industry is its increasing use of higher yielding pulp technologies, namely semi-chemical pulp. Semi-chemical pulp uses 40 to 50% less wood than chemical pulping (Forest Industries Association of Tasmania 1990; Beca Simons et al. Reference Beca1997), which is the current mainstay of wood pulping globally. While semi-chemical pulping generated just 6% of the world's wood pulp in 2007, it accounted for 26% of the wood pulp used by China's paper producers: China produces three quarters of this pulp and imports the rest (FAO 2009).
China, whilst drawing increasingly on global wood resources to meet its burgeoning paper consumption, has engaged in significant resource saving through a major shift to recycled paper sourcing and investment in high-yielding pulp technologies. To date, China has avoided pressuring global wood supply into wood price increases (discussed below) that would drive up its paper industry's costs. As a result, China's paper industry has lifted global wood resource productivity with its relatively high domestic paper recycling and importing of recycled paper resources from countries whose paper industries either treat this resource as waste or offer a less attractive price. It is uncertain, however, whether China's performance can be reproduced at the global scale. Constraining factors, namely the amount of paper available for recycling, the number of times fibres can be re-used, minimum fibre strength requirements, feasible input proportion for fillers and low grade recycled paper and systems of collection and sorting, are not fixed. Rather they are influenced by technology change, economics and government policy. If China's resource saving practices, principally through increased paper recycling and uptake of higher yielding pulp technologies could be replicated globally, an estimated 196 to 358 million m3 per annum of wood would be saved, equal to 11 to 21% of global wood production in 2007. This estimated wood saving was calculated using FAO (2009) data, assuming one tonne of chemical pulp requires 4 m3 of wood, mechanical pulp 2.1 m3 and semi-chemical pulp 2.25 m3 and that non wood fibres account for between 17% of fibre input for paper making (as is the current situation in China) and 5% (as is the current worldwide situation).
How is wood saving by producers of solid wood products affecting the demand for wood?
Global consumption of sawn timber and wood panels grew in volume terms by slightly less than 1% per annum over the period 1980 to 2007 (Table 1). Within this modest growth lies a steady and substantial displacement of sawn timber by wood panels such as medium density fibreboard, particleboard and oriented strand board. With the exception of plywood and veneer sheets (33% of wood panels production in 2007), wood panels can be made using particles of wood. Needing neither whole nor relatively large logs, these reconstituted wood panels are made using relatively low-value raw materials manufactured in large processing facilities. They are out-competing sawn timber and plywood in traditional markets, including tropical hardwood sawn timber for furniture (FAO 1997). Reconstituted wood panels have increased their market share against sawn timber, plywood and veneer by an average of 3.6% per annum since 1980, with the rate increasing in the latter half of this near three-decade long period (FAO 2009).
The displacement of sawn timber, plywood and veneer by reconstituted wood panels saves wood because more useable wood can be recovered from logs. In their financial assessment of investment options in world competitive wood processing facilities, Beca Simons et al. (Reference Beca1997) reported wood recovery rates (from logs) for an array of reconstituted wood panels (oriented strand board, particleboard and medium density fibreboard) ranging between 20–25% higher than sawn timber and between 6–10% higher than plywood. With reconstituted wood panels capturing a greater market share, wood input for solid wood products is growing at less than the growth in finished product consumption. Furthermore, the decline in global sawn timber consumption and corresponding growth in reconstituted wood panels (Table 1) suggests that any future tightening in sawlog supply is likely to be ameliorated by increased substitution of sawn timber by reconstituted wood panels and possibly greater sawn timber recycling. The industry has achieved only modest wood savings to date (estimated 4% reduction in global wood consumption since 1990) because reconstituted wood panels are still in their market infancy.
China
China is now a major global producer and consumer of wood panels (Table 4). In 2006, China for the first time since the early 1980s produced more solid wood products than it consumed. A long period of steadily increasing imports of solid wood products plateaued in the early 2000s, started declining in 2004 and transformed into a solid surplus of plywood and reconstituted wood panels for export in 2007 (FAO 2009).
Table 4 China's consumption of solid wood products in 2007. Source: FAO (2009).

Wood imports underpin China's increasing production and consumption of solid wood products (China's wood import trends are discussed below). However, as in its paper industry, resource saving strategies in the solid wood products sector are running ahead of the rest of the world. If the rest of the world consumed solid wood products in the same mix as China (reconstituted wood panels taking a higher market share), it is estimated that 4% of global wood production (74 million m3) could have been saved in 2007. I calculated estimated wood savings using FAO (2009) data, assuming 1 m3 of sawn timber requires 2.4 m3 of wood, plywood and veneer 2.0 m3 and reconstituted wood panels on average 1.87 m3.
What is the potential for additional wood saving in the global wood products industry?
Since 1980, global wood productivity (wood products produced per unit of wood input) has increased by an average 1.3% per annum. In 1980, the global wood products industry on average used 1.9 m3 of wood to make 1 m3 of wood products. By 1995, this had contracted to 1.7 m3 and contracted further to 1.4 m3 by 2007 (Fig. 4). Improved resource productivity is concentrated heavily in the paper industry with paper recycling already a practised wood saving strategy. Therefore, just the increasing share of paper in the global wood products mix (as happened up to the mid 1990s) has lifted resource productivity for the global wood products industry as a whole. Since then the proportion of paper in the global wood products mix has remained steady, at slightly more than 40%: the increased resource productivity since the mid 1990s is therefore due to tangible resource saving by producers of solid wood products and paper.
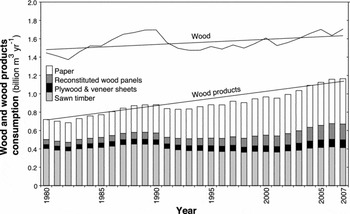
Figure 4 Global consumption of wood and wood products. Paper data reported in tonnes have been converted to m3 assuming 1 m3 of paper weighs on average 0.75 tonnes. Lines are linear trends. Source: FAO (2009).
China's outstanding wood productivity (Fig. 5) is due largely to its strategic decision to target recycled paper as the main feedstock for its soaring paper production and, to a lesser degree, higher consumer uptake of reconstituted wood panels instead of sawn timber. If these two components of China's current wood resource productivity could be emulated worldwide, an estimated 270–432 million m3 less wood would have been required in 2007, equivalent to 16–25% of global wood production in 2007. This is a substantial resource saving potential.
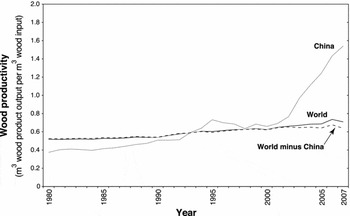
Figure 5 Wood resource productivity for China and the rest of the world. Paper data reported in tonnes have been converted to m3, assuming 1 m3 of paper weighs on average 0.75 tonnes. Source: FAO (2009).
Three main qualifiers are needed. First, pulp made from non-wood fibres (such as straw, bamboo, bagasse, hemp, cotton linters and rags) is a significant material input for China's paper industry (17% of fibre input in 2007, compared to 5% worldwide). Substituting such non-wood inputs for wood in paper production may increase wood productivity, but not necessarily biomass productivity as a whole. I calculated the lower wood saving estimate (270 million m3) by assuming that non-wood fibres made up 5% of the fibre input for global paper making (i.e. the current worldwide situation). I calculated the higher wood saving estimate (432 million m3) by assuming that non-wood fibres made up 17% of the fibre input for global paper making, as is the current practice in China. Second, it is uncertain whether China's high use of recycled paper, which depends on imported recycled paper, can be replicated globally. If China enhances its own paper recycling collection system, more recycled paper will be available for other countries to lift their recycled paper use rates. The constraints to increased recycled paper use are not fixed, but are influenced by technology change, economics and government policy. The third qualifier opens the potential for even higher wood productivity than would be achieved from worldwide emulation of China's performance through continuing invention and innovation.
Are price trends indicating a looming global wood shortage?
The global wood products industry is heavily focused to commodity markets (as distinct from specialties). Globally, commodities make up around 80% of the output volume of the wood and wood products industry (Clark Reference Clark (now Ajani)2004). Most sawn timber, structural beams and wood panels, much of veneer and plywood, pulp and most paper are commodities. The wood used in their manufacture is highly commodified. Most sawlogs and all chiplogs and woodchips are commodities. The highly standardized nature of commodities focuses individual producers (those who have been unable to reduce or eliminate their competition) on price-based competition. Profits are maintained using cost reduction particularly through technological innovation. As a result, commodity prices trend down over the long-term (Ruthven Reference Ruthven1995; Clark Reference Clark (now Ajani)2001; Sustainability Institute 2003).
Since the commencement of the FAO's wood and wood products statistical reporting in the early 1960s, real (inflation adjusted) export prices across all the major wood and wood products groups have trended down (Fig. 6). This is despite rapid global population and economic growth. Inputs (wood and semi-processed wood products) dominate the sharpest price reductions (Table 5), as producers of finished wood products use resource-saving strategies to cut their input volumes and therefore costs. These price trends are common for commodities sold in unstressed markets.
Table 5 Growth in real unit values for global exports of wood and wood products 1980 to 2007. Growth rates calculated for unit fob (free on board, which is the price excluding customs, insurance and freight costs) export values and deflated by the USA CPI (consumer price index) 1982–1984 = 100 using ordinary least squares regression using all annual data points. Source: FAO (2009).


Figure 6 Real unit value profiles for global exports of major wood and wood products 1961–2007. Products as listed in Table 5. Unit values are calculated using fob (free on board, which is the price excluding customs, insurance and freight costs) export values and deflated by the USA CPI (consumer price index) 1982–1984 = 100. Source: FAO (2009).
To date, China's economic growth has not flowed into surging import prices for wood or semi-processed wood products (Fig. 7). China's four-fold (423%) increase in wood imports over the decade commencing 1997 (to supply 30% of its wood needs by 2007) saw real import prices declining by an average 3.7% per annum. Strategically, Chinese importers secured most of the price decline early in the decade. The two main imported semi-processed inputs for China's paper making reveal the same pattern: virtually no change in real prices over the decade ending 2007, despite a seven-fold increase in recycled paper imports and a nearly three-fold increase in chemical pulp imports.
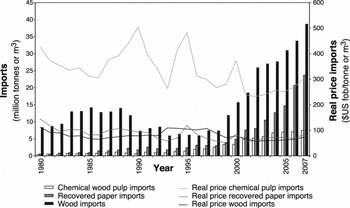
Figure 7 Imports of wood and semi-processed wood products into China and real unit values 1980 to 2007. Unit values are calculated using fob (free on board, which is the price excluding customs, insurance and freight costs) import values deflated by the USA CPI (consumer price index) 1982–1984 = 100. Source: FAO (2009).
China's wood import prices in more recent years are evidence of a tightening wood supply. The post 2007 economic slowdown, globally and in China, will ease this pressure in the immediate future. Thereafter, China's wood planting programme should take effect, if planting targets are met and plantation productivities are satisfactory. Through its State Forestry Administration, the Chinese Government has set a target of establishing 13.3 million hectares of fast growing high yielding plantations over the period 2001 to 2015 (approximately 45% as feedstock for pulp and paper production) with the aim of reducing its dependence on imports (Barr & Cossalter Reference Barr and Cossalter2004). Low interest loans, grants and subsidies on capital costs, subsidies similar to those provided in other developed countries in the past and today (see, for example, Ajani Reference Ajani2007 for the Australian situation), are on offer to stimulate plantation investment in China.
China's plantation area increased by 8.43 million hectares from 2003 to 2008 (based on figures provided by Butterworth & Zhang Reference Butterworth and Zhang2005 and Petry & Zhang Reference Petry and Zhang2009). This increase includes 6.55 million hectares of fast growing and high yielding plantations established since 2002 (Fordaq Reference Fordaq2009), which suggests China is on track for meeting its 13.3 million hectare target by 2015. However, and despite China's Seventh National Forest Inventory (Petry & Zhang Reference Petry and Zhang2009) revealing improved wood yields, tree stocking and age structure, concerns about the capacity of China's plantations to meet its wood needs are strong (Barr & Cossalter Reference Barr and Cossalter2004; Bull & Nilsonn Reference Bull and Nilsonn2004; Wang et al. Reference Wang, Innes, Lei, Dai and Wu2007). The challenges cover plantation productivity and management issues, forest ownership and user rights and the role of China's government in implementing its policy of separating ecological and commercial forests (Barr & Cossalter Reference Barr and Cossalter2004; Wang et al. Reference Wang, Innes, Lei, Dai and Wu2007). China's State Forestry Administration has acknowledged these challenges and, in the context of the Government's strategy for tackling climate change, recently announced increased vigour in pursuing forest right reform to increase plantation productivity and shifting planting south to more favourable weather and water areas (Petry & Zhang Reference Petry and Zhang2009). Despite China's aim to reduce its wood import dependence, imports are expected to remain high over the medium term (Petry & Zhang Reference Petry and Zhang2009). If China's wood import dependency increases over the medium term due to continuing strong wood products manufacturing and poorly performing plantations, a tightening global wood market may be anticipated, with price increases (or expectations of price increases) for wood stimulating even greater attention to wood saving strategies that will flow back to moderate demand and hence wood prices.
It appears the Chinese paper industry anticipated their capacity to generate a tightening wood supply. Indeed, global wood trade (imports), which hovered between 5 to 6% of global production through the 1980s and most of the 1990s, rose since the late 1990s to 7.7% of global wood production in 2007 (FAO 2009). Thus far, China has averted an outcome of tighter wood markets generating increased wood prices by a combination of pre-emptive use of its buying power to negotiate lower wood prices and induced innovation (paper recycling, semi-chemical pulping and government facilitation of plantation investment). As a consequence, despite China's average 9% per annum growth in paper consumption over the 27 years ending 2007, global wood consumption has remained constrained and export prices for wood have not escalated.
What is the global economic contribution of the wood and wood products industry and is this contribution changing?
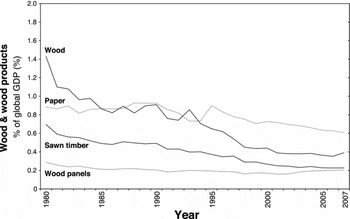
The wood and wood products industry's relative contribution to the global economy is declining because of the slow growth in wood consumption and declining real prices for all major wood and wood products. Producers of wood contributed just 0.4% to world economic activity in 2007; down from 1.4% in 1980 (Fig. 8). The contribution of finished wood products has also declined, but at slower rates, as much of the price-cost pressure of commodity production is passed back onto wood producers through wood saving.
DISCUSSION
The above analysis of the global wood market is important information for building wood-based industry and forest policy. Climate change brings a new urgency to coherent forest policy with its long history of clashing interests between wood production and biodiversity conservation. The relationship between biodiversity and climate change mitigation and adaptation was considered by the Ad Hoc Technical Expert Group on Biodiversity and Climate Change (2008). The United Nations Conference of the Parties to the Convention on Biological Diversity convened this Group to provide biodiversity related information to the United Nations Framework Convention on Climate Change. The following key principles are distilled from the Group's findings.
• In their natural state, ecosystems are generally more carbon dense and biologically more diverse. Well functioning ecosystems have greater resilience to climate change that will aid in their natural adaptation and ongoing climate change mitigation function.
• Primary forests are generally more carbon dense, harbour the highest biodiversity and have higher resilience than other forest ecosystems (notably plantations).
• Land use activities that involve clearing and logging reduce the standing stock of living biomass carbon, cause collateral damage to soil and dead biomass carbon, reduce biodiversity and thus ecosystem resilience. This creates a carbon debt that takes decades or centuries to recover.
From these principles flow the following ecologically-based priorities for climate change mitigation and adaptation for the forest land-use sector, starting with the highest priority:
• Avoid emissions from deforestation and forest degradation by protecting existing carbon stocks in primary forests and woodlands (i.e. do not clear or log these ecosystems).
• Maintain, or where necessary, re-establish the restorative capacity of deforested and degraded natural ecosystems to ensure maximum carbon uptake as they return to their full carbon carrying capacity.
• For natural forests and woodlands devoid of restorative capacity, reforest using mixed native species to enhance resilience and therefore long-term carbon storage capacity. Reforestation should make use of remnant natural forests and woodlands.
New carbon stocks can be established using a plantation growing regime, namely where trees are planted and managed in an agricultural context and regeneration requires harvesting and replanting. Critically, the plantations should not be established by clearing natural forests or intensively managing natural forests to generate a plantation regime. The Ad Hoc Technical Expert Group on Biodiversity and Climate Change (2008) advised that plantations may sequester and store considerable amounts of carbon but are not as beneficial for biodiversity conservation as natural forests. Mixed plantings of native species have potential for higher biodiversity value than monocultures or exotic species. The Group also advised that plantations store less carbon than natural forests because stands are usually harvested at a relatively young age and young trees store less carbon than older trees. Also logging causes emissions from collateral damage to living and dead biomass and soil carbon. This is also why modified natural forests store less carbon than primary forests.
Replacing production-based definitions of ‘forest’ with ecosystem-based definitions for natural forests and plantations, biodiversity/climate change interests rank natural forests ahead of plantations. The ‘forestry’ industry has the opposite ranking. Plantation grown wood offers cost savings in harvesting, transporting and processing. Such a ranking appears at odds with the forestry industry's access to abundant supplies of low-priced wood from natural forests. The ranking is informed not by a snapshot of today's log prices (one cost item), but by an understanding of the dynamic forces embedded in the highly commodified global wood and wood products industry and its on-going seeking of cost reduction strategies along the entire production line (Clark Reference Clark (now Ajani)2004). Whilst access to cheap wood from natural forests works to dampen investment in plantations, the global plantation estate continues to increase (Brown Reference Brown2000), encouraged by countervailing government financial assistance for plantation establishment (see for example Barr & Cossalter Reference Barr and Cossalter2004 for China, and Ajani Reference Ajani2007 for Australia).
With the vast majority of the global forestry industry having a preference for a plantation grown wood resource, and biodiversity-climate change mitigation and adaptation interests having a preference for protecting natural forests, at this most fundamental level, forest contests are not irresolvable. This framing stimulates a key question. With global wood consumption likely to continue at relatively low rates, how much can be met by the existing plantation estate as it matures, and what opportunities are opened for protecting carbon stores and rebuilding them by halting commodity wood production in natural forests?
Globally, the definitions for forests and plantations and wood data are not sufficiently robust to answer the question adequately, but the associated research does give some insight. Brown (Reference Brown2000), using the then FAO definition of an industrial plantation where significant ‘forestry’ countries such as Finland, Germany and Canada report having no plantations, estimated that the 103 million hectares of industrial plantations established globally by 1995 had the potential to supply 22% of the global (industrial) wood consumption in 1995. Whether they did or not remains unknown, because neither the FAO nor any other body reports global wood production for its two major growing regimes (agriculture and self-regenerative natural forests) separately. Based only on the plantations established by 1995, Brown (Reference Brown2000) estimated they could supply around 600 million m3 per annum of wood by 2010. This is equivalent to 35% of global wood consumption in 2007 (noting that wood consumption is unlikely to increase at trend rates over the next three years dominated by global economic recession, and may actually decline). Since Brown's analysis, the FAO has generated a more inclusive plantation definition by ruling in those semi-natural forests of native species established through planting, seeding or coppice of planted trees (FAO 2006, 2007). Using this prevailing plantation definition, industrial plantations covered 271 million hectares in 2005 and had the potential to supply an estimated 1.2 billion m3 of industrial wood per annum in 2005, or 70% of global consumption in 2005 (Carle & Holmgren Reference Carle and Holmgren2008). Clearly, definitions and the criteria and processes used to disaggregate ‘forests’ into their ecosystem components are important.
The XIII World Forestry Congress held in Buenos Aries in 2009 worked up three main forest groupings: conservation forests, natural production forests and plantations. Trade-off between conservation and wood production is implicit in the ‘natural production forest’ classification. Rather than putting the cart before the horse, ‘forest’ classifications based on ecological concepts should be first developed, followed by on-the-ground rules for classifying ‘forests’ and then the political process of making trade-offs.
The climate change debate attracts attention to the ecological concepts of self-regeneration and resilience and adds force to the long-running calls for greater biodiversity protection in natural forests. Replacing the historical production definition of ‘forests’ with system-based definitions of natural forests and plantations is needed for coherent policy development in the era of climate change.
CONCLUSIONS
Globally, growth in wood consumption has trended along at an average of just 0.4% a year since 1980. In contrast, global consumption of wood products increased steadily: paper by an average 3.2% per annum and solid wood products (sawn timber and wood panels) by 0.8% per annum since 1980. Wood saving explains these significantly different growth trajectories in unprocessed wood and processed wood products.
China's high growth wood products industry has lifted wood resource productivity to new levels. Consistent with the theory of induced innovation, China's wood products industry has so far avoided triggering a global wood shortage and associated wood price increases through a progression of strategies: successful pre-emptive price negotiations, increased use of recycled paper, adoption of high-yielding pulp technologies, substitution of reconstituted wood panels for sawn timber and tree planting. If China's current wood resource productivity achievements were emulated worldwide, an estimated 270 to 432 million m3 less wood would have been required in 2007, equivalent to 16 to 25% of annual global wood production.
Integrating the ecological principles presented by the Ad Hoc Technical Expert Group on Biodiversity and Climate Change (2008) with the factors driving the economic trends presented in this paper, opens the potential for a new forest policy frame centred on allocating natural forests and plantations to the jobs they do best. Natural forests are best used for biodiversity conservation, carbon storage and uptake, while plantations are best used for wood production.
ACKNOWLEDGEMENTS
For comments received on earlier drafts of this paper, I thank Margaret Blakers, Jim Douglas and Gordon McAulay, and remind readers that the views expressed in this paper do not necessarily align with theirs. I also thank two anonymous reviewers for their comments.


