


INTRODUCTION
Tropical forests and deforestation
Tropical forests cover less than 10% of Earth's terrestrial surface (Mayaux et al. Reference Mayaux, Holmgren, Achard, Eva, Stibig and Branthomme2005), yet they are thought to host at least 50% of terrestrial species (Lovejoy Reference Lovejoy, Reaka-Kudla, Wilson and Wilson1997) and contain 45% of the above-ground carbon in vegetation (Watson et al. Reference Watson, Noble, Bolin, Ravindranath, Verardo and Dokken2000). The annual global deforestation rate of humid tropical forests is estimated to have been 0.5% between 1990 and 1997, with regional annual rates of up to 5.9% (Achard et al. Reference Achard, Eva, Stibig, Mayaux, Gallego, Richards and Malingreau2002). However, large uncertainties still exist, with a range of ±24% at the 95% confidence level for the global estimate, and ±56% for Latin America. Achard et al.'s (Reference Achard, Eva, Stibig, Mayaux, Gallego, Richards and Malingreau2002) estimate for annual deforestation of humid tropical forests at the global level from 1990–1997 is 23% less than that of the United Nation's Food and Agriculture Organization (FAO 2000) from 1990–2000, and 41% less for Africa. Uncertainties aside, much forest data produced to date is of limited utility. FAO forest studies do not produce spatially explicit maps, which are essential for forest fragmentation analysis, and for analyses incorporating other spatial datasets. Maps of 1 km resolution are an improvement, but are still of limited use for fragmentation analysis and are on a scale that misses much detail relevant to biodiversity conservation. More precise and detailed information on the extent and distribution of tropical forests and their rate of clearing are essential to estimating threats to biological diversity and carbon emissions.
Deforestation threatens species survival and diminishes biodiversity by destroying forest habitat, creating forest fragments too small to maintain viable populations and increasing ‘edge effects’ at forest/non-forest interfaces (Harris Reference Harris1984). Edge effects due to fragmentation typically affect an area several times larger than the forest destruction itself (Harris Reference Harris1984; Skole & Tucker Reference Skole and Tucker1993), affecting micro-meteorology over short distances (Kapos Reference Kapos1989), and increasing exposure to damaging winds (Ferreira & Laurance Reference Ferreira and Laurance1997), fire frequency (Cochrane Reference Cochrane2001), and access for livestock, other non-forest animals and hunters (Enserink Reference Enserink1999; Cullen et al. Reference Cullen, Bodmer and Padua2000). To assess the impact of tropical deforestation on biological diversity, not only the area deforested, but also the isolation of forest patches and the area of edge habitat must be determined.
Madagascar
Madagascar's separation from Africa approximately 165 million years ago, and from India 70 million years ago (Rakotosamimanana Reference Rakotosamimanana, Goodman and Benstead2003) is reflected in extremely high biological endemism (Table 1). More than 90% of Madagascar's endemic animal species live exclusively in forest or woodland (Dufils Reference Dufils, Goodman and Benstead2003). The tropical forests of Madagascar are among the highest priority areas in the world for biodiversity conservation (Myers et al. Reference Myers, Mittermeier, Mittermeier, Fonseca and Kent2000).
Table 1 Species richness and endemism in Madagascar.

Estimates of forest and woodland cover prior to human arrival between the fourth and seventh centuries ad have varied widely, with some arguing that forest covered 90% or more of the island (Humbert & Cours Darne Reference Humbert and Cours Darne1965), while others argue that it was less (Kull Reference Kull2000). By 1600 ad, deforestation was reportedly already advanced in the central highlands, with the use of fire in zebu cattle grazing and slash-and-burn agriculture playing an important role (Gade Reference Gade1996). By the late 19th century, concern about forest destruction had led to enactment of laws against agricultural burning (Jarosz Reference Jarosz1993), to little effect. A human population of 17.9 million, growing at 2.8% yr−1 (UNPF [United Nations Population Fund] 2004), coupled with widespread dependence on subsistence agriculture and fuelwood cutting, makes deforestation in Madagascar difficult to slow. Recent field studies have confirmed negative effects of deforestation and forest fragmentation in all of Madagascar's forested regions (Langrand & Wilmé Reference Langrand, Wilmé, Goodman and Patterson1997; Vallan Reference Vallan2000; Watson et al. Reference Watson, Whittaker and Dawson2004).
The first systematic forest map of Madagascar, produced by F. Blasco based on visual interpretation of aerial photography from 1949–1957 (Blasco Reference Blasco, Humbert and Cours Darne1965; Humbert & Cours Darne Reference Humbert and Cours Darne1965), reported 159 959 km2 of forest and mangrove suffering little or no degradation (Table 2). Faramalala (Reference Faramalala1988) estimated forest cover in c. 1973 to be 106 400 km2 (see also IEFN [Inventaire Ecologique et Forestier National] 1996) based on visual interpretation of 1:1 000 000 scale Landsat image prints. A national forest inventory based on visual interpretation of Landsat 5 images, indicated 103 000 km2 of ‘little- to non-degraded’ forest in 1994 (IEFN 1996). The FAO (2000) reported total forest cover (including natural forest and plantations) in 1990 to be 129 010 km2 and cover in 2000 of 117 270 km2; they estimated natural forest cover in 2000 to be 113 770 km2 (FAO 2000). Using 1-km SPOT Vegetation data, Mayaux et al. (Reference Mayaux, Gond and Bartholome2000) estimated there was 101 000 km2 of primary forest in 1999.
Table 2 Historical estimates of Madagascar's forest cover. *Secondary and degraded forest classes not included in cover estimates from Humbert and Cours Darne (Reference Humbert and Cours Darne1965), Faramalala (Reference Faramalala1988) and the IEFN (1996). †Estimates include plantations. ‡Estimate does not include plantations.

The differences among these estimates are caused by differences in definitions of forest, mapping techniques and resolution of data used. Work in other regions has demonstrated that forest cover, fragmentation and clearance estimates are most accurate when produced from digital analysis of high-resolution images covering the entire study area, used in conjunction with ground or aerial verification (Townshend & Justice Reference Townshend and Justice1988; Tucker & Townshend Reference Tucker and Townshend2000; Steininger et al. Reference Steininger, Tucker, Townshend, Killeen, Desch, Bell and Ersts2001).
METHODS
Overview
For this study, we used orthorectified Landsat images from NASA's Geocover project (Tucker et al. Reference Tucker, Grant and Dykstra2004) for the 1970s, c. 1990 and c. 2000, and we digitized the Humbert and Cours Darne (Reference Humbert and Cours Darne1965) map from the 1950s. We mapped humid and dry forest, spiny forest and woodland, mangrove, non-forest, water cloud/cloud shadow. Similar to previous studies of tropical forest cover (see for example Skole & Tucker Reference Skole and Tucker1993, Steininger et al. Reference Steininger, Tucker, Townshend, Killeen, Desch, Bell and Ersts2001), we defined ‘forest’ as areas of primary vegetation dominated by tree cover at least seven metres in height, with neighbouring trees crowns touching or overlapping when in full leaf. In practice, this means that the canopy is at least 80% closed. ‘Spiny forest and woodland’ is primary vegetation dominated by closed-canopy trees or shrubs in the arid southern and south-western regions of Madagascar, sometimes as low as two metres in height in the extreme south. We did not include open-canopy areas, secondary formations or plantations in our estimates of forest and woodland areas. Lightly degraded primary forest and mature secondary forest may be indistinguishable from primary forest in Landsat imagery. However, we saw little evidence of forest regeneration in Madagascar. Thus, the forest classes include virtually all natural forest habitat upon which 90% of Madagascar's fauna depend.
Mapping methods
For the 1970s, we used Landsat Multispectral Scanner (MSS) data from the period 1972–1979, predominantly 1973; for c. 1990, we used Landsat Thematic Mapper (TM) data from 1989–1996, predominantly 1990; and for c. 2000, we used Landsat Enhanced Thematic Mapper Plus (ETM+) data from 1999–2001, predominantly 2000. All dates of satellite imagery were co-registered to sub-pixel precision to minimize false change caused by locational inconsistency between dates. Our analyses were conducted at a 57-m spatial resolution for the 1970s and at a 28.5-m spatial resolution for c. 1990 and c. 2000.
The c. 1990 and c. 2000 data were classified together in a single multi-date image to produce a direct estimate of change. Classification of multi-date images, rather than classifying single-date images individually and then combining them to derive change estimates, reduces false-change errors caused by differences between image dates in vegetation phenology, illumination conditions and atmospheric interference.
A supervised methodology was used to classify each two-date ‘image pair’. Our classification was based on a simple set of classes: forest, non-forest, water, cloud/shade (no data), and mangrove. Because we classified two-date images, we had to train the classification for all observed combinations of these basic classes (for example forest to forest, forest to non-forest, non-forest to cloud). For these ‘basic class combinations’ it was often necessary to create multiple sub-classes or ‘signatures’, in order to capture the full range of spectral variation in an image pair. Each of these signatures, in turn, consisted of a number of polygonal training sites drawn on top of the satellite image by the classifier. These training sites were identified through visual interpretation of the satellite imagery informed by literature research, consultation with biologists familiar with Madagascar's landscape, purchased aerial photos and five days of overflights.
The process of classification was iterative. A set of signatures representing all observed combinations of basic classes was created; the classification was run and the resulting thematic image was inspected for errors with reference to both dates of the satellite image pair; errors were corrected by editing the training sites of existing signatures and/or creating additional signatures. This iterative process continued until visual inspection of the classification revealed no further obvious errors. The sub-classes of the final classifications were recoded into the general classes of the final product. The recoded classifications were filtered using two passes of a three-by-three orthogonal neighbourhood majority filter, followed by a 2-ha ‘eliminate’ function in Erdas Imagine 8.4. The filtered classifications were then joined to produce a seamless country mosaic.
We classified the 1970s images separately because of their lower spatial resolution, and different spectral bands and radiometric sensitivity. This imagery was analysed with reference to the c. 1990–c. 2000 images and classifications to minimize the aforementioned sources of error. The 1970s analysis was merged with the c. 1990–c. 2000 analysis to create a three-date map of forest cover and deforestation.
We used a number of rules in combining the 1970s data with the c. 1990–c. 2000 data in order to minimize errors in the cover and change estimates. For example, areas that were seen to be forest on either date in the c. 1990–c. 2000 map, but as non-forest or water in the 1970s map, were recoded to be forest in the 1970s, because the superior quality of the later imagery made it more reliable.
Internal geometric differences between the 1950s photo-based data and the Landsat data of later years made it impractical to merge the 1950s map with the Landsat-based map. Thus, only an aggregate numeric forest change estimate could be made for the 1950s–1970s period, versus the spatially explicit forest change estimates for the 1970s–c. 1990 and c. 1990–c. 2000 periods.
A bioclimatic mask was used to separate the mapped forest into humid forest, dry forest and spiny forest; mangrove forest was already a distinct class (Fig. 1). The bioclimatic mask is based in part on the Missouri Botanical Gardens ‘Bioclimate 5’ product (Schatz & Lescot Reference Schatz and Lescot2003), the humid zone being a combination of the ‘humid’, ‘sub-humid’ and ‘montane’ zones in Bioclimate 5. We defined the spiny forest and woodland zone using local expertise, and defined the dry forest zone as the remainder of the country.
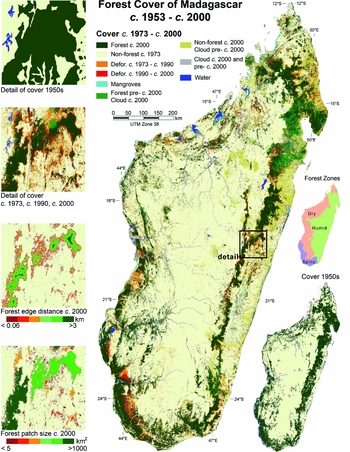
Figure 1 Madagascar forest cover from the 1950s to c. 2000. Forest cover changes from the 1970s to c. 2000 are shown in the main figure, and forest cover in the 1950s is shown in the lower-right inset.
Calculation of deforestation rates
The extent and rate of forest loss in each forest class was calculated for each two-date time period using only pixels that were cloud-free in both dates in question. Forest extent and fragmentation indices were calculated for each of these four forest classes for each date.
We calculated average annual deforestation rates from the mosaic map, based on change intervals of 20 years (c. 1953– c. 1973), 17 years (c. 1973–c. 1990), and 10 years (c. 1990–c. 2000). Using these average intervals instead of the actual dates of each image pair classified decreases the temporal precision of the calculations. But, given the large study area and the large number of images, we believe the impact on the accuracy of our figures is small, especially for the c. 1990–c. 2000 period when most image dates were tightly clustered around the target dates of 1990 and 2000.
Fragmentation
Fragmentation was represented by two variables: forest patch size and proximity of forest to non-forest edge. The presence of clouds required us to make a number of assumptions in order to provide the most realistic estimates of fragmentation. Cloud cover can make a large forest patch appear like two or more smaller patches. To minimize this effect, for a given date, any areas of cloud cover that were forested in the most recent previous cloud-free date were counted as forest. This was done only for the assessment of fragmentation and thus the total areas for forest and woodland in Tables 3 and 4 differed from those in Table 5. We defined forest and woodland edge habitat as areas within a specified distance from non-forest patches >5 ha.
Table 3 Madagascar's known forest cover 1950s–c. 2000. *Known forest cover is visible forest plus cloud- or shade-obscured areas that were visible forest at a later date. †Unknown indicates an area obscured by cloud or shadow at a given date, whose land cover type cannot be deduced with certainty from data from earlier or later dates. n/a = not available. The increase in spiny forest cover from the 1950s to the 1970s seems likely to have been due to differences in forest definition and mapping methods.

Table 4 Madagascar's deforestation 1950s–c. 2000. Deforestation rates were calculated over average time periods of 20, 17 and 10 years. Figures for the actual area deforested in the 1950s–1970s are omitted because deforestation was not directly observed for this time range; percent deforestation rates are calculated from aggregate forest areas. n/a = not available.

Table 5 Fragmentation of Madagascar's forests, 1950s–c. 2000. Fragmentation is measured by distribution of forest area (1) by patch-size, and (2) by distance of forest from a non-forest edge. All forest types are aggregated in these figures.

Validation
We collected GPS-linked digital photography and video imagery during five days of low altitude flights in September 2002. We used one subset of these data to assist interpretation and another to estimate the accuracy of our c. 2000 classification. Based upon our error analysis of 342 areas distributed among the three forest zones, we estimated 89.5% accuracy in identification of forest and non-forest. To directly estimate the error of our deforestation class would have required two dates of validation data, corresponding to the two dates of satellite imagery in question, but this was unavailable. The error in the deforestation class is not the product of the error for forest and non-forest in the two dates of classification because we conducted a direct multi-temporal classification. We believe it is reasonable to assume that the error rate for the deforestation class was about the same as the error rate for the forest and non-forest classes.
Supplementary information
A list of image dates used for this analysis, and information on obtaining full-resolution digital files of the forest cover, deforestation and fragmentation maps are available via the internet at http://science.conservation.org/portal/server.pt?open=512&objID=755&&PageID=127564&mode=2&in_hi_userid=124186&cached=true
RESULTS
In the 1950s, there was 160 000 km2 of forest cover in Madagascar, comprising 55% humid, 26% dry and 19% spiny forest (Table 3). The c. 2000 data showed a total 89 800 km2 of forest, with an estimated accuracy of about 90%. An additional area of more than 11 200 km2 was obscured by cloud and of that area, almost 9200 km2 were forested in the most recent previous clear image; the remaining 2100 km2 were cloud obscured in all three dates of satellite imagery. Cloud cover was generally associated with the humid forest-covered slopes of the north-eastern mountains. Thus total forest cover in Madagascar in c. 2000 was in the range 89 800–101 100 km2, with a probable area of around 99 000 km2. This forest cover estimate is within 5% of the IEFN (1996) and Mayaux et al. (Reference Mayaux, Holmgren, Achard, Eva, Stibig and Branthomme2005) estimates (Table 2). Faramalala's (Reference Faramalala1988) estimate, based on data from the early 1970s, is closer to our c. 1990 estimate than our 1970s estimate.
Average rates of deforestation were 0.3% yr−1 from the 1950s to the 1970s, 1.7% yr−1 from the 1970s to c. 1990, and 0.9% yr−1 from c. 1990 to c. 2000 (Table 4; Fig. 1). The greatest loss occurred in the humid and dry forests, which between the 1950s and c. 2000 lost 43% and 41% of their area, respectively. Spiny forest area decreased 28% over the same period, but had the highest clearance rate during the 1990s of almost 1.2% yr−1.
In the 1990s, the greatest clearance of spiny forest occurred in the region centred around the city of Toliara. Two contiguous areas of spiny forest >100 000 ha were cleared to the north and north-east of the city, along with widespread smaller patches of deforestation, primarily to the south. Deforestation rates for the humid and dry forests slowed during the 1990s. Even so, several contiguous patches of 20 000–50 000 ha were cleared in the dry forests of the west-central part of the island during the 1990s. The more general pattern of deforestation in the dry and humid forests was of small-scale clearance at forest edges.
By the 1950s, over 26% of all forest occurred in patches <500 km2 and over 43% within 1 km of a non-forest edge. By c. 2000, over 45% of all forest was in patches <500 km2 and over 80% within 1 km of a non-forest edge. A quarter of the remaining forest in c. 2000 was within 57 m of a non-forest edge and nearly a quarter was in isolated forest patches of less than 10 km2 (Table 5; Fig. 2). For most parts of the island, with the exception of the eastern humid forest and south-western dry and spiny forest, forest patches were <100 km2 (Fig. 1).

Figure 2 Trends in fragmentation of Madagascar's forest and woodland from the 1950s to c. 2000. Fragmentation is measured by distribution of forest area (1) by patch-size, and (2) by distance of forest from a non-forest edge. (a) Percentage of forest in patches > 500 km2 in area. (b) Percentage of forest in patches < 100 km2 area. (c) Percentage of forest > 1 km from a forest edge. (d) Percentage of forest < 250 m from a forest edge.
Dry forests were by all measures the most fragmented forest type throughout the study period, and increased in fragmentation primarily from the 1950s–c. 1990. Despite an overall decrease in humid forest cover, fragmentation of the humid forest increased only slightly from the 1970s–c. 2000, whereas spiny forest fragmentation increased continuously over the study period (Fig. 2).
DISCUSSION
By the 1950s, only 27% of Madagascar was forested and even a conservative estimate of pre-human forest cover suggests it had already lost more than half of its forest cover; the loss may have been as much as two-thirds, or more. Forest cover further declined to approximately 16% in c. 2000, a loss of 40% in 50 years. Taking fragmentation into consideration, the impact was even more dramatic. From the 1950s to c. 2000, the area of ‘core forest’ (forest >1 km from a non-forest edge) decreased from >90 000 km2 to <20 000 km2. The area in patches of >100 km2 decreased by more than half. The slowing rate of deforestation in the humid and dry forests after c. 1990 is encouraging, but the deforestation rates among all forest types are still disturbing, given their small remaining area and fragmented state.
These results demonstrate extensive loss and degradation of the forest habitat on which 90% of Madagascar's fauna depend. Given the probable lag-time of species extinction following habitat destruction (Brooks et al. Reference Brooks, Pimm and Oyugi1999; Cowlishaw Reference Cowlishaw1999), it is likely that many species are living on ‘borrowed time’. These results emphasize the need for redoubled forest conservation efforts in Madagascar. We suggest (1) halting further primary forest clearance as soon as possible, and (2) exploring the potential of strategically located forest restoration efforts for mitigation of species extinctions.
The data here contribute to the goal of halting deforestation by providing precise information necessary to study the causes of deforestation in Madagascar. Only with such understanding may effective policy be formulated. These data may also be used to help prioritize forest conservation activities by identifying forest habitat critical to biodiversity. Critical forest habitat may be identified by combining these forest data with the range polygons of forest-dependent species, protected area polygons, and spatial analyses of levels of endemism and number of threatened species. Similar analysis, with the addition of data on forest fragmentation and secondary forest cover, may be used to identify strategic locations for forest restoration. We do not know how much forest has been lost since 2000. We recommend regular updates to these data to enable more rapid and adaptive response to deforestation threats in Madagascar.
ACKNOWLEDGEMENTS
This work was supported by Conservation International (CI), the Center for Biological Conservation (CBC) in Madagascar, and NASA's ‘Mission to Planet Earth’. We thank the CBC for support for the aerial surveys; François Blasco of the University of Toulouse for use of the 1950s maps, and Sara Musinsky, Leanne Miller and Minnie Wong of CI for assistance with the work.


