INTRODUCTION
Developing countries, including low- and middle-income countries, often support high levels of biodiversity, but are particularly threatened by habitat degradation (Laurance et al. Reference Laurance, Sayer and Cassman2014). Conservation planning provides excellent tools for prioritizing conservation actions (Pressey et al. Reference Pressey, Cabeza, Watts, Cowling and Wilson2007), but developing countries typically lack both the capacity and the necessary spatial datasets to develop state-of-the-art conservation plans. Where that is the case, conservation planning is done, if at all, with limited information. Hence, there is an urgent need to enhance conservation planning in such countries (Grau et al. Reference Grau, Gasparri and Aide2005; Michalski et al. Reference Michalski, Peres and Lake2008; Fajardo et al. Reference Fajardo, Lessmann, Bonaccorso, Devenish and Muñoz2014).
Conservation planning requires spatial datasets representing both biodiversity patterns and conservation threats (Meyer et al. Reference Meyer, Kreft, Guralnick and Jetz2015). Species distribution data are among the most commonly used datasets in conservation planning, such as when aiming to protect species of conservation concern (Lawler et al. Reference Lawler, Wiersma, Huettmann, Drew, Wiersma and Huettmann2011). In developing countries, however, species observation records are typically scarce, and available species distribution information is often limited to continental and global-scale biodiversity assessments with low spatial resolution (IUCN 2015). Unfortunately, these datasets do not capture the fine-scale spatial variability needed to support local conservation planning (Rondinini et al. Reference Rondinini, Wilson, Boitani, Grantham and Possingham2006; Rodrigues Reference Rodrigues2011).
Knowing the location of wilderness areas (i.e., the most ecologically intact, or natural, places in a region) is also necessary for conservation planning (Mittermeier et al. Reference Mittermeier, Myers, Thomsen, da Fonseca and Olivieri1998). Creating detailed datasets on wilderness areas and species distributions could therefore help advance conservation planning in developing countries. Mapping human influence using geographic proxies such as human population density, land transformation, road density and other anthropogenic variables is a common approach to identifying wilderness, but again, the available global datasets are too coarse to be useful (Sanderson et al. Reference Sanderson, Jaiteh, Levy, Redford, Wannebo and Woolmer2002; Theobald Reference Theobald2013).
At the same time, while conservation planning is just emerging in many developing countries, the dual goals of economic growth and reduction of deforestation have led many of these countries to establish national or regional land-use plans since 2000 (Table S1; available online). Such plans are already in place in numerous countries across Latin America, Africa and Asia, and more countries have passed legislation that mandates the establishment of land-use plans. These plans typically designate zones for different land uses. For example, some forests and their associated biodiversity may be protected, while other forests are open for logging or agricultural expansion. However, the criteria used to designate these zones may not incorporate conservation goals or make best use of available information about species of conservation concern. Without explicit consideration of the distribution of species of conservation concern, these plans could reduce habitat availability and forest connectivity (Wich et al. Reference Wich, Gaveau, Abram, Ancrenaz, Baccini and Brend2012; Vergara et al. Reference Vergara, Pérez-Hernández, Hahn and Soto2013), threating biodiversity conservation. Typically, these national and regional land-use plans are revised regularly (e.g. every 5–10 years), which provides opportunities for updating them. Given that land-use plans represent considerable institutional investments, improving existing land-use plans can be an effective option for improving biodiversity conservation.
Our goal was to develop and showcase a straightforward approach to enhancing existing land-use plans so that they minimize conservation threats and maximize conservation outcomes, using widely available datasets and spatial analysis techniques. We tested our approach in the Southern Yungas ecoregion of Argentina, a global biodiversity hotspot that is under increasing anthropogenic threat (Myers et al. Reference Myers, Mittermeier, Mittermeier, da Fonseca and Kent2000). Argentina has developed a forest conservation planning scheme in which native forest cover is classified according to conservation value (i.e., high, medium and low), and in each category different types of land use are permitted. However, a very limited amount of biological data were considered when these land-use plans were developed. Our specific objectives were: (i) to identify wilderness areas in the Southern Yungas; (ii) to determine the current distribution of elements of conservation concern (in our case, a set of threatened and near-threatened species and a forest type); (iii) to assess the representation of wilderness and elements of conservation concern in the forest land-use plan; and (iv) to quantify potential changes in species’ habitat availability and forest connectivity resulting from the forest land-use plan. We identified potential threats and opportunities for conserving biodiversity in the Southern Yungas within the current land-use plan and made recommendations for improving it.
METHODS
Study area
The Southern Yungas in north-western Argentina is the southernmost neotropical montane forest. It occurs along the Andean slopes between the dry forests of the Chaco to the east and the high-elevation deserts of Puna to the west (Fig. S1). The Southern Yungas includes piedmont forest (400–700 m elevation), montane forest (700–1500 m), cloud forest (1500–2200 m) and high-elevation grasslands (2200–3700 m; Cabrera Reference Cabrera1976), and it harbours high levels of species richness and endemism (Myers et al. Reference Myers, Mittermeier, Mittermeier, da Fonseca and Kent2000). Human activities are a major threat, especially in the lowlands, and 75% of piedmont forest has been transformed into agriculture (Brown & Malizia Reference Brown and Malizia2004). We focused on the Argentine provinces of Salta and Jujuy, which contain most of the Southern Yungas ecoregion. Our study area covers 5.3 million ha, of which 74% is forest, 15% is transformed land (mostly agriculture and urban) and 11% is high-elevation grasslands.
The Argentine Forest Law
In 2007, Argentina's National Congress passed the ‘Forest Law’ (N. 26 331) to ensure the conservation of native forests and to promote their sustainable management. This law required that provinces classify native forest cover through a participatory planning process into three categories: (i) high-conservation-value forests, in which only tourism, scientific research and the gathering of non-timber products are allowed; (ii) medium-conservation-value forests, where productive activities such as grazing, silvopasture and sustainable harvesting of timber and non-timber products are allowed; and (iii) low-conservation-value forests, which can be converted to agriculture, pasture or timber plantations if an environmental impact assessment is approved (see Seghezzo et al. Reference Seghezzo, Volante, Paruelo, Somma, Buliubasich and Rodríguez2011). The forest plan must be updated every 5 years as a prerequisite to accessing federal funds.
In our study area, the governments of Salta and Jujuy classified 74% of the forested area as medium-conservation-value forest, 18% as high-conservation-value forest and 8% as low-conservation-value forest (Gobierno de Jujuy 2008; Gobierno de Salta 2009; Fig. S1). The three categories were supposed to be defined based on multiple criteria, including ecological and biodiversity characteristics, conservation status, agricultural potential, watershed protection potential and cultural uses, but maps of species distributions and wilderness areas were not available. The forest categorization was largely based on slope, existing protected areas and distance to the nearest river, assisted by a Landsat-based land cover map. Existing protected areas and major forest corridors were assumed to have the highest ecological and biodiversity value, and were included in the high-conservation-value class.
Data and analysis
Identification of wilderness areas
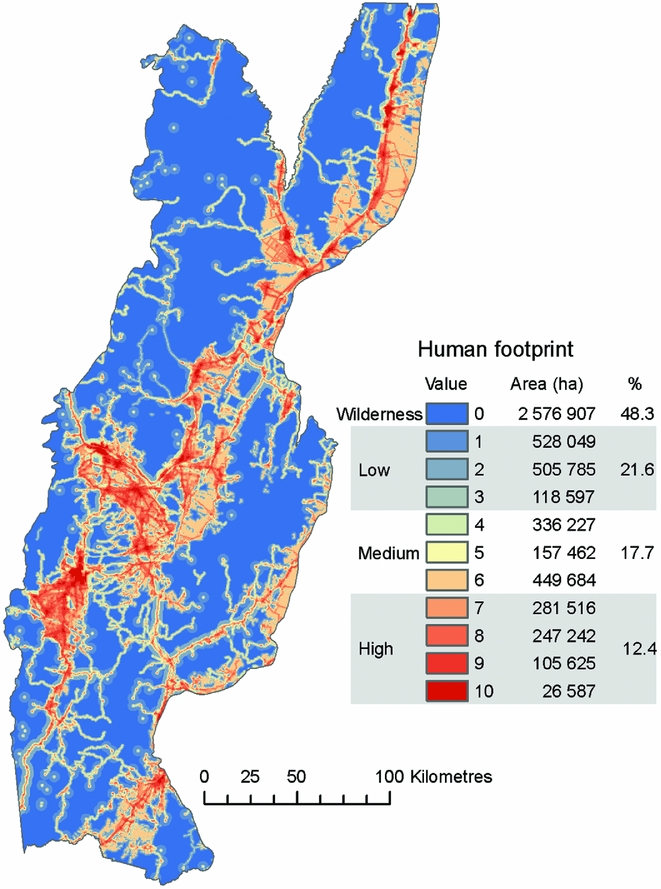
We identified wilderness areas using the human footprint approach of Sanderson et al. (Reference Sanderson, Jaiteh, Levy, Redford, Wannebo and Woolmer2002), which integrates variables of human influence on ecosystems, including land cover, settlements and infrastructure, into one continuous variable. The lower the human influence, the wilder the area. First, we identified our spatial resolution, in this case 1 ha (as in Woolmer et al. Reference Woolmer, Trombulak, Ray, Doran, Anderson and Baldwin2008). Second, we selected spatial datasets representing the primary conservation threats, which in our region included human settlements, agricultural lands, roads, quarries and railroads. We extracted these from the available land cover map and governmental Geographic Information Systems datasets (IGN 2014). Third, we assigned human influence scores to each dataset on a scale of 0 and 10, taking into account whether land transformation was reversible and how human influence varied with distance (Appendix S1). We assigned human influences based on prior studies (Sanderson et al. Reference Sanderson, Jaiteh, Levy, Redford, Wannebo and Woolmer2002; Theobald Reference Theobald2013; González-Abraham et al. Reference González-Abraham, Ezcurra, Garcillán, Ortega-Rubio, Kolb and Creel2015). For example, for irreversibility, urban pixels received the maximum score (10), whereas agricultural lands received a score of 6 because vegetative cover is maintained. At the same time, the level of human influence typically declines with distance from human features. Settlements, agricultural use and roads facilitate human access to forests for poaching, fire wood collection, illegal dumping and recreation, and increase wildlife road kills, predation by domestic and feral dogs and cats and the spread of introduced species (Di Bitetti et al. Reference Di Bitetti, Albanesi, Foguet, De Angelo and Brown2013; Marinaro et al. Reference Marinaro, Grau, Macchi and Zelaya2015). We used buffers of different sizes around human features and applied decreasing scores with increasing distances, following Woolmer et al. (Reference Woolmer, Trombulak, Ray, Doran, Anderson and Baldwin2008) (Appendix S1).
Finally, we combined the human influence scores across our different datasets using Theobald's fuzzy algebraic sum of human modification scores (Theobald Reference Theobald2013; González-Abraham et al. Reference González-Abraham, Ezcurra, Garcillán, Ortega-Rubio, Kolb and Creel2015). The values in our final human footprint map ranged between 0 (i.e. minimum human influence, our surrogate for wilderness) and 10 (maximum human influence).
Distribution of elements of conservation concern
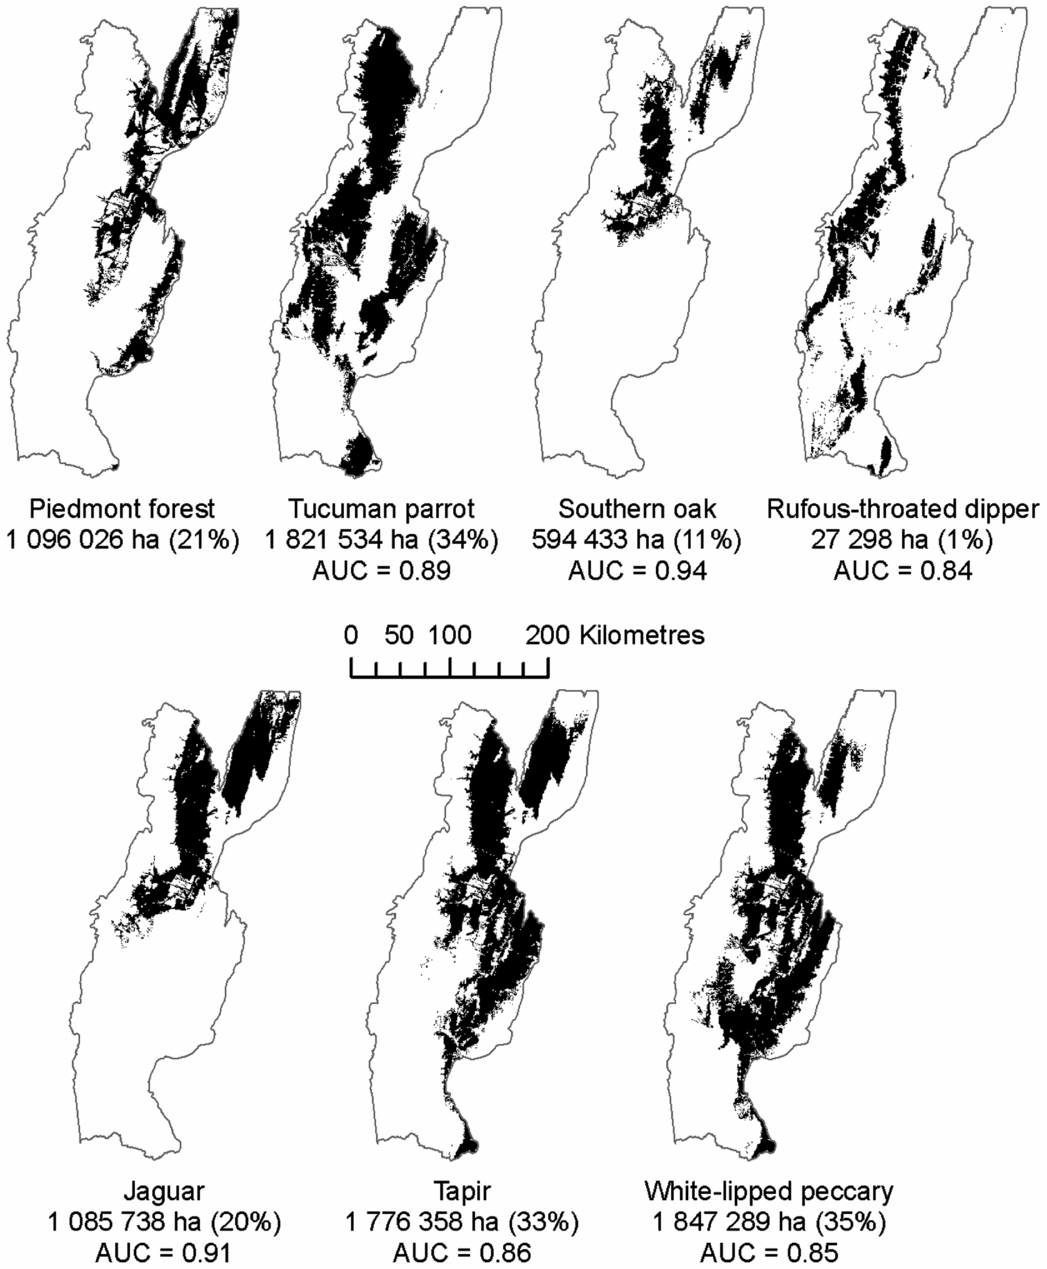
We focused on seven elements of conservation concern (hereafter focal elements), including five vertebrate species (Tucuman parrot (Amazona tucumana), rufous-throated dipper (Cinclus schulzi), jaguar (Panthera onca), tapir (Tapirus terrestris) and white-lipped peccary (Tayassu pecari)), one tree species (Southern oak (Amburana cearensis)) and one forest type (piedmont forest). We considered several factors, including conservation threat status, legal status and ecological function, when selecting these elements. The vertebrate and tree species are listed as threatened or near-threatened (IUCN 2015); the piedmont forest is of high conservation concern due to high deforestation rates (Brown and Malizia Reference Brown and Malizia2004); the jaguar and white-lipped peccary are considered umbrella species; and the jaguar is a national monument under Argentine national law. While other species within the southern Yungas are also of high conservation concern, for many there are few distributional data (e.g. yellow-striped brush finch (Atlapetes citrinellus) or white-browed tapaculo (Scytalopus superciliaris)) and/or there is no national protection in place. Selecting the jaguar and white-lipped peccary as elements in our analysis ensures that at least several other species benefit from the maintenance of the habitat conditions that allow these umbrella species’ persistence.
We mapped species distributions using Maxent software (Phillips et al. Reference Phillips, Anderson and Schapire2006). We obtained species occurrence data from previous studies and public species occurrence databases (Rivera et al. Reference Rivera, Politi and Bucher2007; Taber et al. Reference Taber, Chalukian, Altrichter, Minkowsli, Lizarraga and Sanderson2008; Fundación CEBio 2015; GBIF 2015; Politi et al. Reference Politi, Rivera, Lizarraga, Hunter and Defosse2015). To minimize sample bias, we applied a hexagonal grid with 2500-m sides (1624-ha area) and we limited records to no more than two per species per hexagon. The final number of observations for each species varied from 29 to 54, which is sufficient for Maxent modelling (Wisz et al. Reference Wisz, Hijmans, Li, Peterson, Graham and Guisan2008). As predictors, we used eight 1-km resolution bioclimatic variables representing 1950–2000 conditions (WorldClim; Hijmans et al. Reference Hijmans, Cameron, Parra, Jones and Jarvis2005), which have been useful for prior wildlife modelling in the Southern Yungas (Pidgeon et al. Reference Pidgeon, Rivera, Martinuzzi, Politi and Bateman2015) and include annual precipitation (BIO12), annual mean temperature (BIO1), seasonality of precipitation (BIO15) and temperature (BIO4), extreme data for precipitation of wettest quarter (BIO16), precipitation of driest quarter (BIO17), maximum temperature of warmest month (BIO5) and minimum temperature of coldest month (BIO6).
Maxent requires background data for model training, so we generated 10 000 pseudo-absences from within 100 km of the species occurrences. We tested different buffer sizes, and a 100-km buffer provided the most accurate and biologically meaningful results (VanDerWal et al. Reference VanDerWal, Shoo, Graham and Williams2009). All other Maxent options were set to default. To assess model performance, we conducted a 10-fold cross-validation (Bateman et al. Reference Bateman, VanDerWal and Johnson2012) and calculated the area under the receiver operating curve (AUC) for each species.
To create maps of species’ potential distributions, we first transformed the predictions from Maxent into binary maps of suitable versus unsuitable conditions using the 10th percentile presence logistic threshold. This threshold considers the probability at which 10% of the training presence records are omitted and is recommended because it accounts for potential uncertainty in occurrence locations (McFarland et al. Reference McFarland, Rimmer, Goetz, Aubry, Wunderle and Sutton2013). Then, because our species occur only in forests, we deleted the non-forested areas from each species’ potential distribution map based on the land cover map (as in Pidgeon et al. Reference Pidgeon, Rivera, Martinuzzi, Politi and Bateman2015). Furthermore, the rufous-throated dipper is restricted to fast-flowing, rocky mountain, forested streams (Ormerod & Tyler Reference Ormerod, Tyler, del Hoyo, Elliott, Sargatal, Christie and de Juana2015), so we refined the distribution for this species by including only pixels that overlapped with streams, and we included topographic variables (elevation, slope and aspect) in the Maxent model due to the topographic complexity of the species’ habitat. However, we did not include topographic variables in the other species models because climate and elevation are often highly correlated. Lastly, we mapped the distribution of piedmont forest by intersecting the forest land cover with digital elevation data, classifying as piedmont the forests at elevations <700 m (Cabrera Reference Cabrera1976). Finally, we overlaid the seven distribution maps and calculated the number of focal elements in each pixel, similarly to a ‘richness’ map.
Representation of wilderness areas and focal elements in the current forest plan
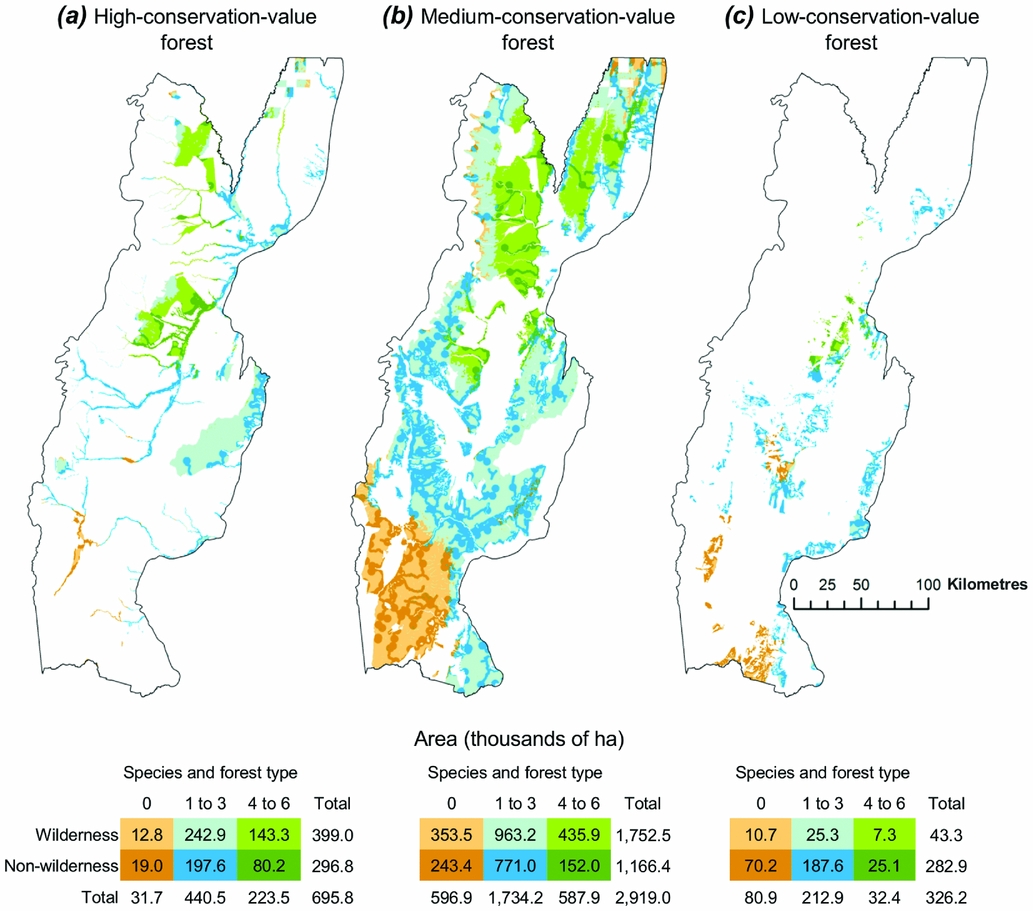
To assess the current forest land-use plan, we evaluated how wilderness areas and the focal elements were distributed among the high-, medium- and low-conservation-value forests. For this, we combined the map of the location of wilderness areas, the map with the sum of focal elements (simplified to three ‘richness’ classes; i.e. 0, 1–3 and 4–6) and the forest land-use plan, and we reported the total area (ha) of all possible combinations of wilderness and richness status (e.g. wilderness and high richness; non-wilderness and low richness; and so on) within each forest conservation category.
Potential threats to biodiversity from the current land-use plan
We studied the potential threats to biodiversity by evaluating the effect that deforestation allowable by the forest plan (i.e. the area designated as low-conservation-value forests) can have on species’ habitat loss and forest connectivity. Low-conservation-value forest is the only category that can legally be deforested, and this is why we conducted the analysis for this category only. For habitat loss, we calculated the amount of potential habitat (ha) of each focal element within the low-conservation-value forests, and reported these values as percentage habitat loss.
For forest connectivity, we used spatial pattern analysis based on GUIDOS’ Morphological Spatial Pattern Analysis software (MSPA; Vogt Reference Vogt2016) and monitored forest bridges. MSPA assigns each forest pixel to one of seven shape classes based on a user-specified edge width (Appendix S2). We focused on the class bridge, defined as sets of continuous, non-core forest pixels that connect core areas at their ends, which are measures of structural connectors or corridors (Wickham et al. Reference Wickham, Riitters, Wade and Vogt2010; Vogt Reference Vogt2016). We ran MSPA on the forest cover with the low-conservation-value forests included or removed and reported the amount of bridges (ha) under both scenarios. To assess the robustness of the results and to capture the various corridor types that may be used by different species, we ran MSPA using 100-, 500- and 1000-m edge widths. Finally, we grouped the other MSPA classes into forest core and forest edge (encompassing all of the other classes combined) and compared them.
RESULTS
Wilderness areas
We found that 48% of the study area was wilderness (i.e. human footprint = 0), which occurred mostly in the mountains. In particular, the north and east of the study area included large, continuous patches of wilderness (Fig. 1). Areas with the highest human footprint values (7–10) covered 12% of the study area and included urban centres and major transportation corridors. Productive lowlands, areas peripheral to urban centres and montane transportation networks had low to medium human footprint values (1–6; Fig. 1).

Figure 1 Gradient of human footprint values and distribution of wilderness areas in the Southern Yungas.
Distribution of focal elements
The AUC values of the species distribution models ranged from 0.84 to 0.94 (Fig. 2). Tucuman parrot, white-lipped peccary and tapir had the largest predicted habitat areas (about 1.8 million ha each, 33–35% of the study area), whereas rufous-throated dipper had the smallest (27 000 ha, 0.5%), and piedmont forest, jaguar and southern oak were in-between (0.6–1 million ha, 11–21% of the study area; Fig. 2). The northern part of the study area supported the largest number of focal elements (up to six; Fig. S2).

Figure 2 Potential habitat distributions of our elements of conservation concern. For visualization purposes, the map for rufous-throated dipper displays the species’ predicted distribution in forested areas without restricting it to forested streams. The reported area (ha), however, corresponds to the final predicted habitat estimate after restricting it to forested streams. AUC = area under the receiver operating curve.
Representation of wilderness areas and focal elements in the current forest land-use plan
We found substantial variation in the distribution of both wilderness areas and focal elements within and among the different forest plan categories (Fig. 3). Of wilderness that supported high concentrations of focal elements, only 143 000 ha were located in forests designated as of high conservation value, while 436 000 ha were located in medium-conservation-value forests and 7300 ha were located in low-conservation-value forests (Fig. 3).

Figure 3 Representation of wilderness areas and elements of conservation concern in the three forest land-use zones in the plan (i.e. (a) high-conservation-value forests, (b) medium-conservation-value forests and (c) low-conservation-value forests).
Most of the high-conservation-value forests (95%) provided habitat for at least one of the focal elements (Fig. 3(a)), and three major patches of high-conservation-value forests occurred in the northern, central and eastern parts of the study area, respectively. Two of these patches supported potential habitat for four to six focal elements (Fig. 3(a)). However, not all high-conservation-value forest was wilderness, and 43% was under some type of human influence (Fig. 3(a)).
Forests designated as being of medium conservation value did not differ greatly in their proportions of wilderness from forests of high conservation value (60% vs. 57%, respectively), nor in the proportions of area supporting at least one focal element (80% vs. 95%; Fig. 3(b)). However, the medium-conservation-value forest was much more widespread (Fig. 3(b)). As a result, the largest extents (ha) of wilderness and forested areas supporting four to six focal elements occurred in forests of medium conservation value. Further, the wilderness area within the medium-conservation-value forest (1.8 million ha) was larger than the total area of high- and low-conservation-value forests combined (1.0 million ha), which explains why the medium-conservation-value forests also supported vast areas of forest under human influence (1.2 million ha; Fig. 3(b)).
Finally, and contrary to the other forest plan categories, the low-conservation-value forests were largely (87%) non-wilderness (Fig. 3(c)). However, most of the low-conservation-value forests (75%) also supported potential habitat for some focal elements. For example, 10% of the low-conservation-value forests supported potential habitat for up to four to six focal elements (Fig. 3(c)).
Potential threats to biodiversity from the current land-use plan
Deforestation of all low-conservation-value forests would cause a substantial decrease in both forest connectivity and habitat availability for all focal elements. MSPA showed that all forest structural classes (bridge, edge and core) would decrease (Fig. S3). Among these, forest bridges showed the greatest relative declines, equivalent to 40–90% losses, depending on the buffer width. Core forests, on the other hand, showed the greatest absolute declines (up to 290 000 ha; Fig. S3). Forest bridges represented <1% of the total forest area, but were common in agriculture-dominated landscapes, and many of them disappeared when low-conservation-value forests were removed (see Appendix S2).
In terms of habitat loss, piedmont forest and white-lipped peccary exhibited the greatest change rates (14% and 8%, respectively) and total areas (144 000 and 156 000 ha, respectively; Fig. S3), and rufous-throated dipper exhibited the least (0.7% and 180 ha, respectively). The other species were somewhere in between, with projected rates of between 2% and 6% (Fig. S3).
DISCUSSION
Improving existing land-use plans could be an option for enhancing conservation of biodiversity. In the Southern Yungas, basic information on wilderness areas, species distributions and straightforward spatial analysis techniques revealed substantial spatial variation in conservation values within current land-use plan categories, making it possible to identify potential threats as well as opportunities for conserving biodiversity.
The largest wilderness areas in the Southern Yungas and the largest areas supporting elements of conservation concern (in our case, a set of threatened or near-threatened species and a forest type) are officially designated as medium-conservation-value forests. This finding has major conservation implications because these lands are all privately owned and not protected. Activities allowed by the forest plan in this category, such as logging and grazing, will negatively affect native species if conducted without sustainable management guidelines (Mastrangelo & Gavin Reference Mastrangelo and Gavin2012; Zamorano-Elgueta et al. Reference Zamorano-Elgueta, Cayuela, González-Espinosa, Lara and Parra-Vázquez2012) and will increase the human footprint in these wilderness areas. Ideally, human activities in the medium-conservation-value forests should be concentrated outside of wilderness areas and should avoid areas supporting multiple species of conservation concern. The fact that the medium-conservation-value forests cover a large area (i.e. three-quarters of all forests) provides an opportunity to balance conservation with sustainable human use. For sustainable forest management in the Southern Yungas, for example, retaining trees that have potentially usable cavities is recommended, since cavities are very rare, but are critical resources for many wildlife species (Politi et al. Reference Politi, Hunter and Rivera2010).
At the same time, the human footprint map suggested that some high-conservation-value forests – which are intended to protect reserves, biodiversity features and riparian corridors in perpetuity – could be threatened. Within this category, riparian corridors were the most affected, most likely due to their proximity to roads, agricultural areas and urban centres. Easy human access could facilitate activities such as wood extraction, illegal garbage dumping or hunting, thereby compromising the conservation value of these critical areas. Although it was beyond the scope of our study to predict how widespread these activities are, the fact that many high-conservation-value riparian forests are under human influence should attract the attention of the local government and conservationists.
In addition, we found that deforestation, as allowed under the existing land-use plan, could threaten biodiversity conservation. Based on our spatial pattern analysis, many corridors (our forest bridges) will be lost, limiting the movement of organisms and thus increasing isolation (Beier & Noss Reference Beier and Noss1998), ultimately threatening population persistence. Connectivity loss will particularly affect wildlife species attempting to move between eastern and western forests and through agriculturally dominated lowlands (Di Bitetti et al. Reference Di Bitetti, Albanesi, Foguet, De Angelo and Brown2013). Furthermore, we found that deforestation as allowed by the current land-use plan could remove up to 14% of the potential habitat available for our focal elements, likely compromising these already-threatened species further and eliminating some of the little remaining wilderness in piedmont. Thus, under the current land-use plan, important biodiversity features are likely at risk.
Our recommendations for conservation planning in the Southern Yungas are three-fold. First, we suggest upgrading the conservation category for private lands that are currently wilderness and supporting many focal elements. This is feasible because large areas would still remain that could be allocated to human activities. Economic compensation schemes, which are included in the National Forest Law, could be used to reward landowners who maintain their holdings as high-conservation-value forest. Second, we suggest limiting the deforestation of corridors and considering ecological restoration in piedmont forest to facilitate the movement of species and to help protect threatened species. An effective way to accomplish this would be to designate corridors as medium- or high-conservation-value forest. Third, we suggest incorporating information about the spatial variability of wilderness areas and focal elements in the next revision of the forest land-use plan, as well as in daily decision making by government planners considering land use. Currently, landowner petitions to deforest are approved by the government with little or no consideration of the potential effect on biodiversity. Our datasets are publically available and can easily be used to assess conservation values for more informed decisions. Finally, most provinces of Argentina designed their forest land-use plans without using information on species distributions or on the location of wilderness areas. The national GIS database we used to map wilderness in the Southern Yungas can be used in other provinces as well. In situations of limited technical capacity, collaboration with research institutions could be a source of spatial analysis support.
As with any modelling effort, our study is also subject to some limitations. For example, calculation of the human footprint can be sensitive to the variables and approach used (Di Marco et al. Reference Di Marco, Rondinini, Boitani and Murray2013), although we expect general patterns to stay the same (Sanderson et al. Reference Sanderson, Jaiteh, Levy, Redford, Wannebo and Woolmer2002). In particular, our human footprint assessment did not include information on timber plantations or oil drilling sites because of the lack of GIS data. Fortunately, these activities cover relatively small areas. In addition, although we used quite different elements of conservation concern (i.e. animals, a plant, umbrella species and a forest type), land-use planners should not assume that our elements capture the region's full set of biodiversity. Instead, our study should be considered as a starting point for enhancing biodiversity conservation in the current land-use plan. Similarly, our forest connectivity analysis was based on the spatial relationships between the forest elements, but without information on species movement. Incorporating species movement could further enhance our understanding of connectivity. Finally, we did not include information on the effect of climate change on species distributions because the scope of our study covered the land-use planning within a short period of approximately 5 years, but planning efforts for longer time frames should consider climate change.
Looking beyond the boundaries of our study area, many developing countries have established or are establishing land-use plans (Table S1), and that means that our approach can be used to enhance land-use planning far beyond the Southern Yungas. In Bolivia, land-use plans are common instruments and observation records have recently been compiled for >25 000 species across the country (Fernández et al. Reference Fernández, Navarro, Apaza-Quevedo, Gallegos, Marques and Zambrana-Torrelio2015), providing a unique opportunity to incorporate that knowledge into the existing land-use plan. Similarly, in Indonesia, oil palm expansion is a major driver of both economic growth and biodiversity loss, and agricultural expansion is allowed by the current land-use plan (Fitzherbert et al. Reference Fitzherbert, Struebig, Morel, Danielsen, Brü, Donald and Phalan2008). Our approach could be used to identify potential threats of oil palm expansion, for which little knowledge exists. In addition, an increasing number of developing countries are interested in planning for multiple socio-environmental benefits as part of REDD+ efforts (Reducing Emissions from Deforestation and Forest Degradation), which requires regional land-use planning. Accordingly, our approach can be used to anticipate the potential effects of those efforts and associated land-use plans on local biodiversity conservation.
The global increase in data and technology access (e.g. Global Biodiversity Information Facility (GBIF); Map of Life; Group on Earth Observations Biodiversity Observation Network (GEO BON), etc.) and the increased availability of GIS data by local governments offer new opportunities to advance conservation planning in developing countries (Fajardo et al. Reference Fajardo, Lessmann, Bonaccorso, Devenish and Muñoz2014; Fernández et al. Reference Fernández, Navarro, Apaza-Quevedo, Gallegos, Marques and Zambrana-Torrelio2015), potentially reducing some of the obstacles limiting sophisticated conservation planning. However, we suggest that governments are unlikely to adopt conservation plans that require a complete overhaul of existing land-use plans. Our study and the information gained in the Southern Yungas of Argentina highlight how basic spatial analysis techniques and widely available spatial datasets can be used to greatly enhance land-use plans. This may be a more acceptable approach for governments, and is one that provides great opportunities to advance conservation in developing countries.
ACKNOWLEDGEMENTS
We are grateful to S. Alcalde and Y. Tejerina for updating the species database. The comments by the editor and two anonymous reviewers greatly improved our manuscript.
FINANCIAL SUPPORT
We are grateful to the Whitley Fund for Nature, SECTER B/046 and PIO 0133 CONICET-UNJU for supporting this project. S. Martinuzzi was supported by the CONICET visiting scholar programme.
CONFLICT OF INTEREST
None.
ETHICAL STANDARDS
None.
Supplementary material
For supplementary material accompanying this paper, visit https://doi.org/10.1017/S0376892917000455