


Introduction
Biological diversity represents a significant livelihood option for human survival (IPBES 2019). Although reducing global biodiversity loss and halting species extinction are central to the Convention on Biological Diversity and United Nations Sustainable Development Goals, success to date has been extremely limited (United Nations 2015). The lists of species facing extinction threats have increased exponentially over the past several decades. To develop effective conservation strategies, particularly for already listed rare, endangered and threatened (RET) species, background knowledge regarding their distribution and predicting their habitat suitability under a changing climate is highly important (Marcer et al. Reference Marcer, Sáez, Molowny-Horas, Pons and Pino2013, Megan Reference Megan2021). Thus, the use of technology in generating climate scenarios and potential species distributions for current and future climate scenarios has increased manifold (Terribile et al. Reference Terribile, Olalla-Tárraga, Diniz-Filho and Rodríguez2009, Mouquet et al. Reference Mouquet, Lagadeuc, Devictor, Doyen, Duputié and Eveillard2015). Species distribution models (SDMs) are extremely helpful for studying niche specificity and species’ responses to climate change (Yi et al. Reference Yi, Cheng, Wieprecht and Tang2014) and for optimizing protection networks for climate change adaptation by identifying target areas highly suitable for the reintroduction or rehabilitation of species (Fois et al. Reference Fois, Cuena-Lombraña, Fenu, Cogoni and Bacchetta2016). However, because SDMs vary hugely in predicting species distributions, unimodal SDM studies to produce projections are deemed superficial (Dyderski et al. Reference Dyderski, Paz, Frelich and Jagodzinski2018). Therefore, the application of an ensemble of projections from a range of climate models is highly preferred, particularly for the conservation planning of RET plants, where a range of climate change projections must be considered. Among various SDMs, the maximum entropy (MaxEnt) modelling approach is valuable for delineating species occurrence probabilities (Kaky et al. Reference Kaky, Nolan, Alatawi and Gilbert2020) and, combined with ensemble projections from multiple general circulation models (GCMs), it is highly preferred because it minimizes the predictive uncertainty of single models (Knutti et al. Reference Knutti, Sedláček, Sanderson, Lorenz, Fischer and Eyring2017). Thus, using MaxEnt with multiple GCMs for mapping species distribution appears highly promising and helpful for conservation planning.
Kashmir Himalaya (KH) is a biodiversity hotspot that forms the north-western province of the Indian Himalayan Region (IHR). The most recent investigation of its floral biodiversity lists 1123 plant species used specifically for medicinal purposes (Tali et al. Reference Tali, Khuroo, Nawchoo and Ganie2019). Amongst these, Aconitum heterophyllum Wall. Ex Royle (Ranunculaceae), commonly called Indian Atees (altitude 2800–4000 m), Fritillaria cirrhosa D.Don (Liliaceae), known as yellow Himalayan fritillary (altitude 2500–4200 m), Meconopsis aculeata Royle (Papaveraceae), called blue poppy (altitude 2500–4700 m), and Rheum webbianum Royle (Polygonaceae), known as Indian rhubarb (altitude 2600–4500 m), are found at higher altitudes in narrow pockets (Fig. 1). While M. aculeata is endemic to KH, the other species have relatively extended distributions and are highly valued with known pharmacological properties (Paramanick et al. Reference Paramanick, Panday, Shukla and Sharma2017, Cunningham et al. Reference Cunningham, Brinckmann, Pei, Luo, Schippmann, Long and Bi2018, Bahukhandi et al. Reference Bahukhandi, Sekar, Barola, Bisht and Mehta2019). Of the total of 152 potential medicinal and aromatic plant (MAP) species reported from the region based on medicinal value, market demand, availability and uses in traditional herbal systems, A. heterophyllum and F. cirrhosa are included amongst 43 potential MAPs prioritized for cultivation and conservation in the Western Himalaya (Negi et al. Reference Negi, Kewlani, Pathak, Bhatt, Bhatt and Rawal2018). However, overexploitation and unlawful trading of these species have put severe pressure on their natural populations and thus while F. cirrhosa, M. aculeata and R. webbianum are identified as endangered, critically endangered and vulnerable in the regional Conservation Assessment and Management Plan (CAMP 2003), A. heterophyllum (Fig. 1) is identified as globally endangered and listed under the International Union for Conservation of Nature (IUCN) Red List (Ved et al. Reference Ved, Saha, Ravikumar and Haridasan2015). Despite this, the earlier work across KH has mostly focused on the distribution and documentation of these plants’ medicinal uses (Dad & Khan Reference Dad and Khan2011, Tali et al. Reference Tali, Ganie, Nawchoo, Wani and Reshi2014). However, given the projection that by the end of twenty-first century the region in its average annual temperature might witness an increase of between 3.98°C and 6.93°C under Representative Concentration Pathway (RCP) 4.5 and RCP8.5 scenarios, respectively (Romshoo et al. Reference Romshoo, Bashir and Rashid2020), the individual responses of these highly vulnerable species to anticipated climate change need to be known. Previous studies have demonstrated that changing climate will hugely impact vegetation distribution across KH, with severe impacts on grasslands and forest ecosystems (Rashid et al. Reference Rashid, Romshoo, Chaturvedi, Ravindranath, Sukumar and Jayaraman2015), but its effects on the distribution of MAPs have not been evaluated. As these plants exhibit distinct spatial patterns and are hugely influenced by various environmental factors, we aimed to elucidate how key climate factors, including temperature and precipitation, influence the distribution of four medicinal plants, namely A. heterophyllum, F. cirrhosa, M. aculeata and R. webbianum, across KH, to understand their current distribution patterns and to predict their future distribution using an ensemble of four GCMs. Within a broader framework of devising long-term conservation strategies in KH, we discuss the implications for medicinal plant conservation across KH.
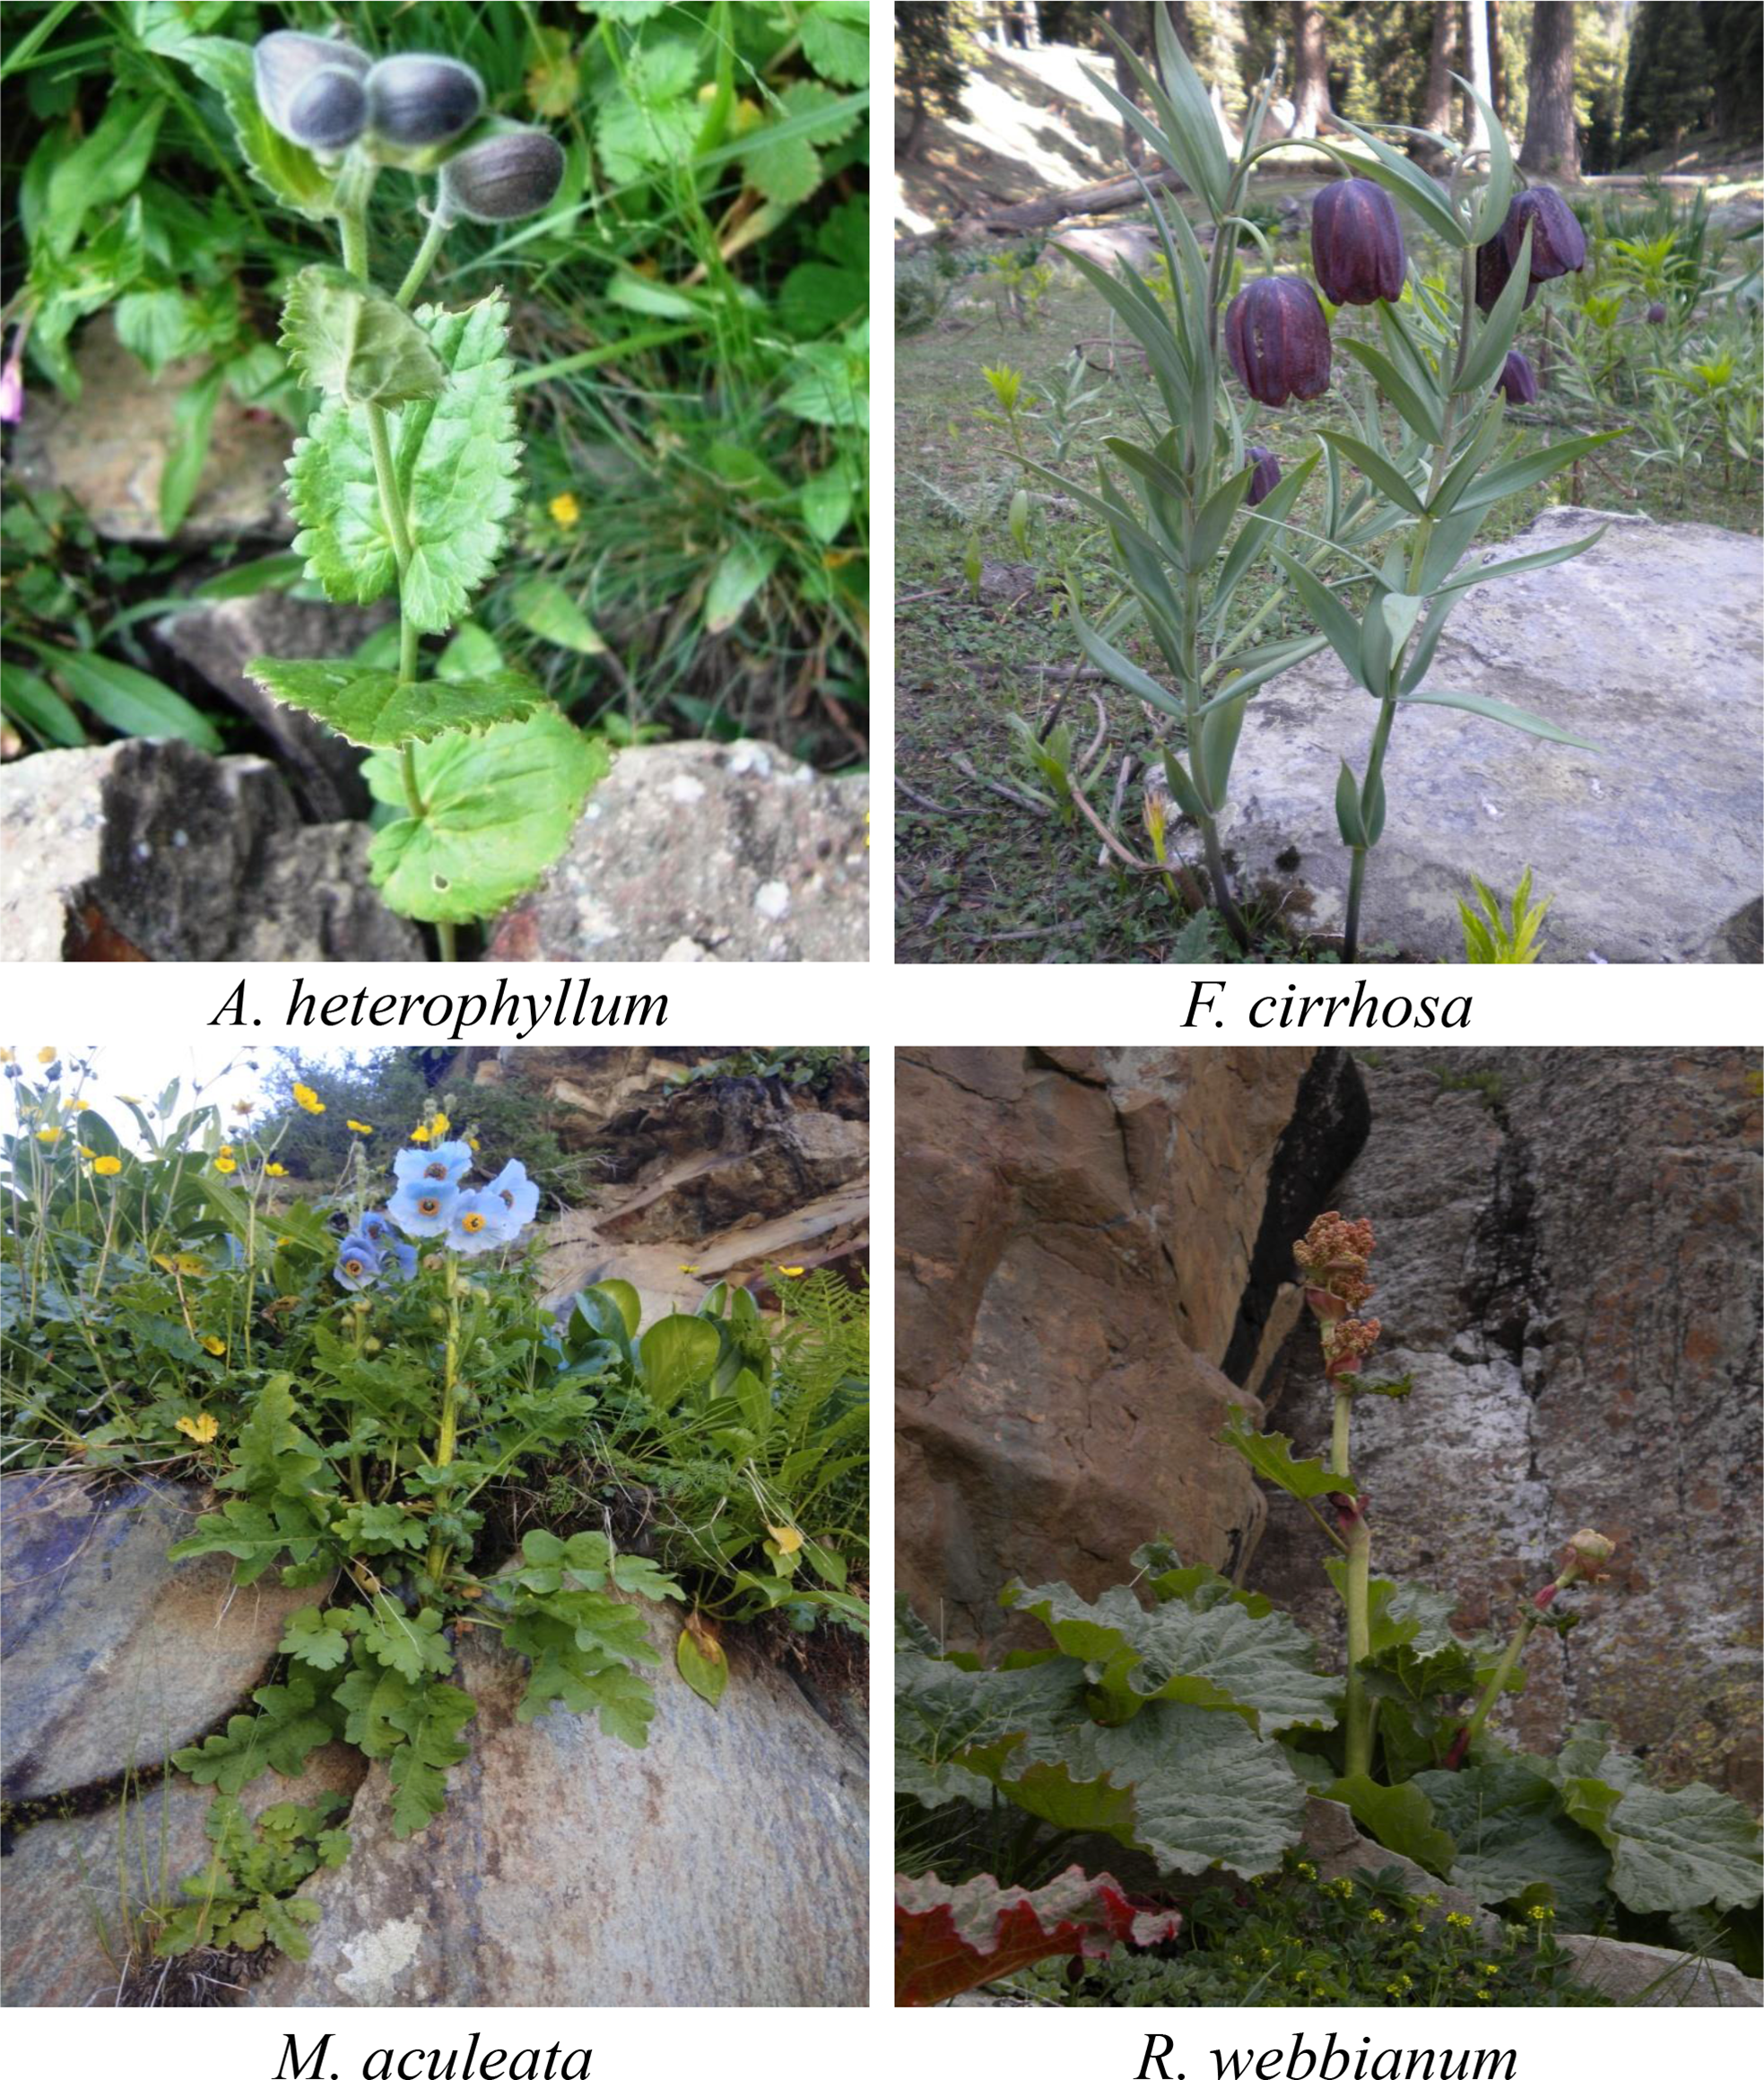
Fig. 1. Four threatened medicinal plants in their natural habitats of Kashmir Himalaya.
Materials and methods
Study area
KH stretches between 32°22′–34°43′N and 73°52′–75°42′E. Due to its fragile ecology, it is extremely sensitive to even minor climatic changes (Dad et al. Reference Dad, Muslim, Rashid, Rashid and Reshi2021). The study area is covered with majestic mountain ranges, including the north-western Himalaya and the Pir Panjal range. Owing to the topographical and climatic contrasts, these mountain ranges hold a wide variety of natural ecosystems and grow plants that are highly prized in modern medicine. The climate, marked by well-defined seasonality, resembles that of mountainous and continental parts of temperate latitudes, with four seasons of summer (June–August), autumn (September–November), spring (March–May) and winter (December–February).
Species data
The primary source of the species occurrence data is our detailed fieldwork carried across the region between 2010 and 2020 (Dad & Khan Reference Dad and Khan2011, Dad & Reshi Reference Dad and Reshi2015, Dad Reference Dad2019). In addition, we also compiled the species location points from Kashmir University Herbarium (KASH) and other secondary sources such as the Global Biodiversity Information Facility (GBIF) database (http://www.gbif.org). However, in order to avoid autocorrelation and to enhance data credibility, the occurrence data were processed using ArcGIS 10.2.1. Then, using the SDM toolbox, the spatial autocorrelation of species distribution was checked and redundant presences were removed. A spatial thinning along 5 × 5km grid cells was carried out to reduce model bias. Thus, of the totals of 47, 42, 31 and 41 occurrence records for A. heterophyllum, F. cirrhosa, M. aculeata and R. webbianum, respectively, only 36, 31, 28 and 30 rarefied points were used to generate SDMs.
Climate data
The climate data were downloaded and processed from WorldClim database version 1.4 (http://www.worldclim.org/). In total, 19 bioclimatic variables derived from monthly temperature and precipitation data and 1 topographic variable (elevation) were processed using ArcGIS 10.2.1 at a spatial resolution of 30 arc-seconds (c. 1 × 1 km; https://www.worldclim.org/data/worldclim21.html; https://www.worldclim.org/data/v1.4/cmip5.html). To avoid multicollinearity, Pearson’s correlation coefficient was calculated for variable pairs using the ecological niche model toolbox, and variables exhibiting high multicollinearity (>0.7) were eliminated to ensure better model predictability (Supplementary Table S1, available online). Thus, the eight variables of annual mean temperature (°C; BIO1), mean diurnal range (maximum temp–minimum temp; °C; BIO2), temperature seasonality (SD × 100; %; BIO4), temperature annual range (BIO5 – BIO6; °C; BIO7), mean temperature of the wettest quarter (°C; BIO8), annual precipitation (mm; BIO12), precipitation seasonality (unitless; BIO15) and elevation (metres above sea level; ELEVATION) were used for generating SDMs. The projected changes of species distribution were modelled to the years 2050 (average for 2041–2060) and 2070 (average for 2061–2080) under Representative Concentration Pathways (RCPs) 4.5 (Wise et al. Reference Wise, Calvin, Thomson, Clarke, Bond-Lamberty and Sands2009) and 8.5 (Riahi et al. Reference Riahi, Rao, Cho, Chirkov, Fischer and Kindermann2011), which correspond to intermediate and high levels of global radiative forcing, respectively. For future climate change scenarios, bioclimatic variables from four GCMs were used: GFDL-CM3 (Griffies et al. Reference Griffies, Winton, Donner, Horowitz, Downes and Farneti2011), MRI CGCM3 (Yukimoto et al. Reference Yukimoto, Adachi, Hosaka, Sakami, Yoshimura and Hirabara2012), CNRM CM5 (Voldoire et al. Reference Voldoire, Sanchez-Gomez, Mélia, Decharme, Cassou and Sénési2013) and CCSM4 (Al-Qaddi et al. Reference Al-Qaddi, Vessella, Stephan, Al-Eisawi and Schirone2017). We calculated the multi-model ensemble mean of the four models with equal weight.
Model design
The model was run using the MaxEnt algorithm (version 3.4.1 k; Phillips et al. Reference Phillips, Anderson and Schapire2006). For model calibration, we used 75% of the data for training and 25% for testing. The models were run with 10 replicates, and model performance and accuracy were measured using the area under the curve (AUC) scores of the receiver operator characteristic (ROC), true skill statistics (TSS) and Cohen’s κ (Fois et al. Reference Fois, Cuena-Lombraña, Fenu and Bacchetta2018). Amongst these, the ROC curve (AUC) represents the threshold-independent index while the TSS and Cohen’s κ are the threshold-dependent indices, with TSS dealing with both sensitivity and specificity. The value of TSS ranges from −1 to +1, where +1 indicates perfect agreement while scores from 0.6 to 0.9 specify fair to good model performance (Allouche et al. Reference Allouche, Tsoar and Kadmon2006). Different regularization parameters such as mean regularized training gain, mean training AUC and mean test AUC were recorded to check model overfitting, while the relative importance of each predictor was measured using the percentage contribution of the jackknife test (Phillips et al. Reference Phillips, Anderson and Schapire2006). For response curves and projected percentage area change of species climatic niches, a distribution probability above 0.5 (Stockwell & Peterson Reference Stockwell and Peterson2002) was used. The habitat suitability map was converted into the suitable and unsuitable areas (Xu et al. Reference Xu, Zhuo, Wang, Ye and Pu2019), and the potential suitable area for each of the four species was calculated using the maximum training sensitivity plus specificity logistic threshold. The distribution map was then categorized into three main suitability classes, namely low, medium and high, with suitability values on a percentage basis being 25–50%, 50–75% and >75%, respectively. The mean number of cells among each class was calculated and recorded as square kilometres for each suitability class (Fielding & Bell Reference Fielding and Bell1997). The variables selected in the current final model were used for projecting the potential distribution into future scenarios for two RCPs of the four GCMs GFDL-CM3, MRI CGCM3, CCSM4 and CNRM CM5, and the potential distribution changes between the current and future climate for each species were calculated by comparing the suitability maps for each scenario.
Results
Model evaluation
Model performance for current and future scenarios was high for both training and test data across all species (Table 1). The model also performed satisfactorily on both calibration and evaluation for AUC, TSS and other statistical scores such as mean regularized training gain, mean training AUC and mean test AUC (Table 1), suggesting that species distributions were near accurate.
Table 1. A statistical summary of the average estimates of the maximum entropy (MaxEnt) distribution models for four threatened medicinal plants across Kashmir Himalaya.

MRTG = mean regularized training gain (%); MURTG = mean unregularized test gain (%); MTG = mean test gain; MTAUC = mean training area under the curve; MtAUC = mean test area under the curve; MAUCsd = mean area under the curve standard deviation; TSS = true skill statistics; RCP = Representative Concentration Pathway.
Significant explanatory variables and current habitat suitability
F. cirrhosa and M. aculeata displayed the highest sensitivity to temperature, with a mean temperature of the wettest quarter (BIO8) appearing particularly important and contributing 62.3% and 61.7%, respectively, to their habitat suitability (Table S2). For A. heterophyllum and R. webbianum, BIO8 and annual precipitation (BIO12) were equally important (Table S2). Variables with the highest mean permutation importance were BIO8 and temperature seasonality (BIO4) for M. aculeata, precipitation seasonality (BIO15) and BIO12 for A. heterophyllum and F. cirrhosa, and BIO12 and BIO4 for R. webbianum (Table S2). The response curves for BIO8 correlated negatively with species occurrences (Fig. 2). For BIO12, a skewed positive response was observed, with species showing high probabilities at annual precipitations >600 mm (Fig. 2). Similarly, A. heterophyllum and F. cirrhosa exhibited the highest probabilities at the lowest precipitation seasonality. However, for M. aculeata and R. webbianum, the occurrences were more frequent towards high-temperature seasonality and vice versa (Fig. 2). Notable differences existed between species in their responses to BIO8 and BIO12, and their probabilities exhibited a downwards trend at –3°C, 0°C, 2°C and 5ºC and at 750, 500, 600 and 760 mm for F. cirrhosa, M. aculeata, R. webbianum and A. heterophyllum, respectively (Fig. 2). By contrast, the occurrence probabilities were seemingly similar for BIO4 for M. aculeata and R. webbianum (Fig. 2). Topographically, the mid-elevation range from c. 2200 to 4200 m was more suitable for all species, with an increased probability of presence recorded at elevations >3200 m.

Fig. 2. Response curves of environmental predictors for four threatened medicinal plants species under the current climate scenario across Kashmir Himalaya. The x-axis of each graph represents the range of explanatory variables and the y-axis represents the probability of the presence of the species. For abbreviations, see the ‘Climate data’ section.
Under the current climate, the habitat suitability model delineated and exhibited the predominance of the highest suitability habitat (HSH) for the assessed species in the highlands across KH: elevation ranging from 2200 to 4200 m. Under the current climatic scenario, 4.6%, 2.9%, 3.1% and 7.5% of the study area were highly suitable for A. heterophyllum, R. webbianum, F. cirrhosa and M. aculeata, respectively, which corresponds to c. 770.9, 487.6, 519.8 and 1258. 4 km2 (Table 2). Coincident with actual distribution, these HSHs are located mostly in the Himalayan Mountain system that runs in parallel to the direction of the Kashmir Valley and includes mountain ranges around Harmukh, Baltal, Chandanwari and Kholai, while a few HSHs (e.g., Affarwat and Ashtor) are also located in the Pir Panjal Mountain Range that spreads from Affarwat through Gulmarg to Banihal Pass (Fig. 3). On both mountain ranges, these HSHs primarily represent high-altitude ecosystems, including forests and grasslands.
Table 2. Projected range changes (km2) for four threatened medicinal plants species under current and future climate change scenarios for 2050 and 2070 at two Representative Concentration Pathway (RCP) scenarios – RCP4.5 and RCP8.5 – categorizing low, medium and high suitability values as percentages of the total area of Kashmir Himalaya.

For values in parentheses, ‘+’ represents a gain and ‘−’ represents a loss in range areas (in km2).
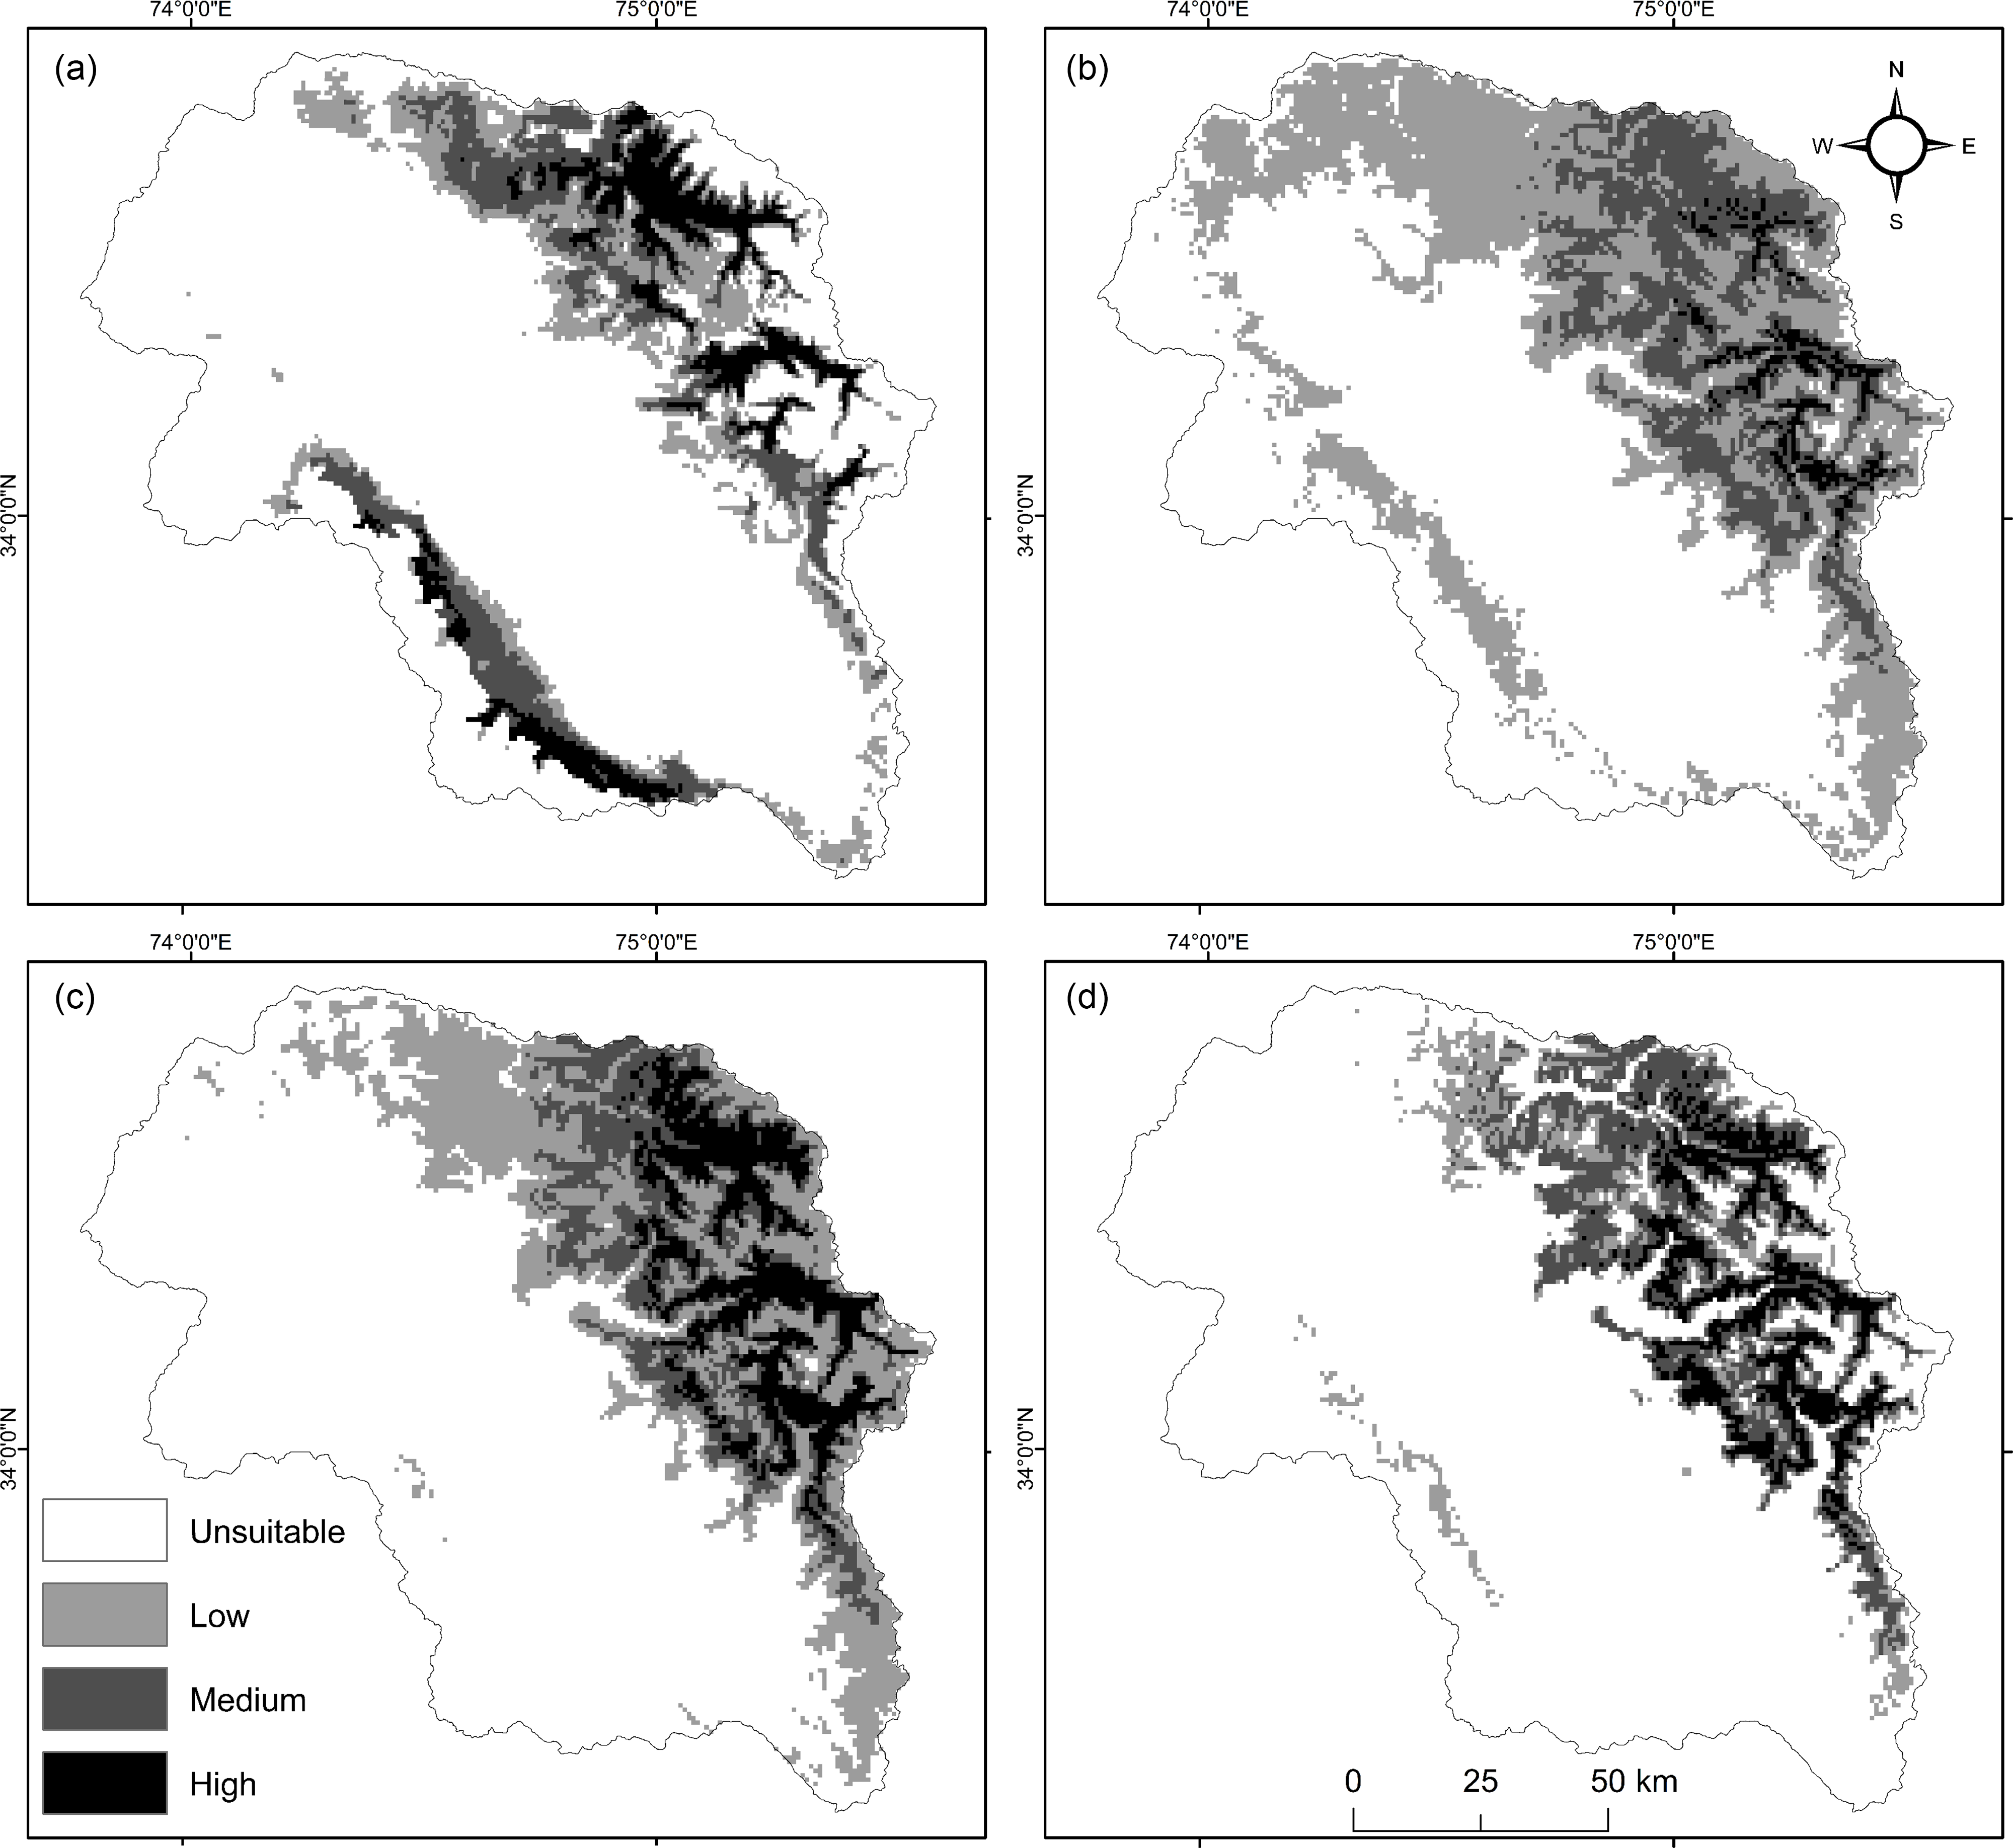
Fig. 3. Potential habitat distribution map for (a) Aconitum heterophyllum, (b) Fritillaria cirrhosa, (c) Meconopsis aculeata and (d) Rheum webbianum under the current climate scenario across Kashmir Himalaya. The three main suitability classes (i.e., low, medium and high) have suitability values of 25–50%, 50–75% and >75% on a percentage basis, respectively.
Potential suitable distribution under future climate scenarios
The AUC values for potential suitable distribution under future climate scenarios were >0.8, indicating that model projections were satisfactory. The projected distribution showed different species behaving differently in each scenario (Figs S1–S4). While A. heterophyllum and R. webbianum recorded a steady reduction in their high potential habitat (HPH) (Figs S1 & S2), M. aculeata and F. cirrhosa exhibited an increasing percentage in their HPHs (Figs S3 & S4). The results revealed that by 2050 A. heterophyllum would lose 16.9% and 39.8% and R. webbianum would lose 17.7% and 42.7% of their current HPHs under RCP4.5 and RCP8.5, respectively, while by 2070 the decrease would be 48.6% and 71.5% for A. heterophyllum and 63.4% and 81.8% for R. webbianum under RCP 4.5 and RCP8.5, respectively. However, F. cirrhosa and M. aculeata were projected to gain for both RCP4.5 and RCP8.5 (Table 3), with HSHs for F. cirrhosa increasing by 60.5% and 17.6% under RCP4.5 and RCP8.5, respectively, by the 2050s, and by the 2070s the corresponding increases would be 69.9% and 85.2%, respectively. In comparison, M. aculeata by the 2050s would increase by 83.6% and 81.1% under RCP 4.5 and RCP8.5, respectively, while by the 2070s the projected increases would 73.7% and 19.2% under RCP4.5 and RCP8.5, respectively (Table 3). However, despite differences in habitat loss and gain under different scenarios, the gain of new HSHs was evident across the Himalayan region, while the loss was across the Pir Panjal mountain range (Figs S1–S4).
Table 3. Projected suitable areas of four threatened medicinal plants under current and future climate change scenarios for 2050 and 2070 at two Representative Concentration Pathway (RCP) scenarios – RCP4.5 and RCP8.5 – categorizing low, medium and high suitability values as percentages of the total area of Kashmir Himalaya.

a Suitability level (%) is calculated out of the total area of the Kashmir Valley.
Discussion
The primary aims of the present study was to elucidate how key climate factors, including temperature and precipitation, influence the distribution of the four medicinal plants A. heterophyllum, F. cirrhosa, M. aculeata and R. webbianum across KH, to understand their current distribution patterns and to predict their future distributions using an ensemble of four GCMs. The bioclimatic variables adequately clarified the current distributions of the four medicinal plants across KH and, in agreement with previous studies, indicated that the habitat suitability and climate optima of these species lie at higher elevations (Gaira et al. Reference Gaira, Dhar and Belwal2011), where they grow under higher precipitation and colder temperatures in grasslands, forests and other alpine ecosystems (Dad Reference Dad2019). The species’ responses to predictive variables (Fig. 2) further supports this observation, corroborating reports that high-altitude, narrow-range species show greater preference towards certain temperatures and precipitation rates (Vincet et al. Reference Vincent, Bornand, Kempel and Fischer2020). Under the current climate, the present study reveals that temperature-related variables rather than precipitation were more significant for F. cirrhosa and M. aculeata. Both temperature and precipitation were important for A. heterophyllum and R. webbianum (Table S2). Rana et al. (Reference Rana, Rana, Ranjitkara, Ghimire, Gurmachhan, O’Neill and Sun2020) also reported similar results for six threatened MAPs across Nepal and opined that any change in the range value of predictive variables affects species probability presence (SPP). For the present study as well, the SPP approached zero at BIO8 >0°C or BIO12 <500 mm (Fig. 2), while it increased steadily as either BIO8 decreased or BIO12 increased. As these species prefer harsh winters with reasonable precipitation (Rana et al. Reference Rana, Rana, Ghimire, Shrestha and Ranjitkar2017), the present study also demonstrated that these species prefer altitudes above 3000 m (Fig. 2), where winter temperatures are generally low. Jeelani et al. (Reference Jeelani, Siddique and Rani2015) reported that, in response to specific ecological environments, high-altitude, narrow-range species develop phenotypic plasticity that helps them to adapt and establish at higher altitudes.
Although its discriminatory capacity makes the AUC the most widely used measure in SDM, AUC values generally tend to be higher for narrow-range species (Phillips et al. Reference Phillips, Anderson and Schapire2006). Therefore, many studies criticize putting the AUC as the best model criterion (Peterson et al. Reference Peterson, Papes and Soberon2008) and advocate for its use in situations involving true instance of species absences (Jiménez-Valverde Reference Jimenez-Valverde2012). Thus, comparing AUC values between species seems unsteady. But as we used AUC values as part of multiple assessment indices (AUC, TSS and Cohen’s κ) together with detailed summary statistics such as mean regularized training and test gain (%), mean test gain and mean test AUC (Table 1), we deem it fit to report the AUC as a model accuracy measure for the present study. Consequently, the distribution maps generated using multiple GCMs delineating the climatic space of four threatened plants in the present study are in agreement with species’ actual distributions across KH. Moreover, as this study entailed geographical distributions on an adequate field-based dataset that ranks highly for SDMs of narrow-range species (Wisz et al. Reference Wisz, Hijmans, Li, Peterson, Graham and Guisan2008), this represents a significant enhancement over traditional distribution datasets. This study offers broader scope for practical conservation planning and sustainable management (Figs S1–S4).
Climate change is one of the five most important threats to global biodiversity (Nunez et al. Reference Nunez, Arets, Alkemade, Verwer and Leemans2019). Within a broader consensus that plant responses to climate change are highly variable (Zhao et al. Reference Zhao, Li, Gao, Yao, Guo and Wang2018), it is argued that wide-niche species may adapt more effectively than narrow-niche species (Abolmaali et al. Reference Abolmaali, Tarkesh and Bashari2018). The results of the present study indicate that responses might differ between narrow-niche species. Thus, while changing precipitation and temperature regimes may not suit A. heterophyllum and R. webbianum and may lead to their shrinkage (Figs S1 & S2), they may match the requirements of F. cirrhosa and M. aculeata and lead to their expansion (Figs S3 & S4). Given that narrow-range species have lower genetic diversity levels than widespread congeners (Mateu-Andrés Reference Mateu-Andrés2004) and are highly susceptible to drift (Boroń et al. Reference Boroń, Zalewska-Gałosz, Sutkowska, Zemanek and Mitka2011), the projected habitat shrinkage for A. heterophyllum and R. webbianum has profound conservation implications. In contrast, the projected expansion distribution for F. cirrhosa and M. aculeata indicates that these species may be introduced to a larger area in the future. However, as their expansion is based on models that lacked non-biotic interactions and dispersal capacities that may limit future species distributions (Morgan & Venn Reference Morgan and Venn2017), their ability to gain new HSHs must be interpreted with caution (Figs S3 & S4).
Considering the differences in predictive influences between current and future climate scenarios, the species differed greatly, with the differences observed being large for A. heterophyllum and R. webbianum and lower for F. cirrhosa (Table S3). For example, instead of BIO12 under the current climate, BIO2 and BIO4 appear to be highly important for A. heterophyllum and R. webbianum, while for F. cirrhosa the critical factors involve BIO4, BIO2 and BIO7, and for M. aculeata the predictive variables between current and future scenario differ only a little (Table S3). These differences indicate that in future, while temperature-related variables would appear favourable for F. cirrhosa and M. aculeata, the climatic space of A. heterophyllum and R. webbianum as influenced by increasing temperature and decreasing precipitation will be less suitable. Thus, we hypothesize that a shift in bioclimatic zone due to both temperature and precipitation will lead to a decline in the suitability of plant species across KH.
For area shrinkage and the expansion of HPHs, RCP4.5 represents the lower while RCP8.5 represents the higher distribution end. Thus, RCP8.5 appears to be most severe for A. heterophyllum and R. webbianum; RCP4.5 in the 2050s and 2070s appears favourable for M. aculeata, while RCP8.5 in the 2050s and 2070s appears favourable for F. cirrhosa (Figs S5–S8). For other species, previous studies also predicted RCP4.5 as a favourable scenario in China (Gao et al. Reference Gao, Wang and Giorgi2013), while for Himalaya, RCP8.5 is reported as favourable for habitat expansion (Rathore et al. Reference Rathore, Roy and Karnatak2019). Independent of the climate scenario, the present study projected habitat expansion mostly across the Himalayan Mountain range and shrinkage over the Pir Panjal range (Figs S5–S8). However, as the climatic space of all species seems to overlap in the Himalayan Mountain range, it would be a feasible space for both in situ and ex situ climate refugia. In contrast, HPHs across the Pir Panjal range would mainly serve for in situ climate refugia areas (Baumgartner et al. Reference Baumgartner, Esperón-Rodríguez and Beaumont2018). As anthropic pressures in most ecosystems in the elevation range of c. 3000–4000 m across KH have generally intensified (Dad Reference Dad2019), the conservation of HPHs would benefit not only the species in question, but also other vulnerable species that lack adequate conservation. Particularly because this study has shown habitat shrinkage for species over the Pir Panjal range, the focus should be on initiating conservation measures across this range, and the results of the present study could aid in delineating conservation priority areas for optimizing protected area networks.
Conclusion
We mapped the geographical distribution of four threatened medicinal plants in KH and analysed projected changes under future climate scenarios. Our results show that the Himalayan Mountain region is of high importance for both current and future species distributions, while along the Pir Panjal mountain range the species would lose most of their suitable habitats. The habitat suitability showed range shifts through the disappearance of A. heterophyllum and R. webbianum and habitat expansion for F. cirrhosa and M. aculeata. Most importantly, while future temperature-related variables would appear favourable for F. cirrhosa and M. aculeata, the climatic space of A. heterophyllum and R. webbianum influenced by both increasing temperature and decreasing precipitation will be less suitable in the future. Thus, we hypothesize that a shift in bioclimatic zone triggered by both temperature and precipitation across KH will be the chief factor responsible for the decline in habitat suitability for these plants in the future. Given the differing behaviours of species to future climate change, target-based conservation, focusing on areas crucial for maintaining current species’ populations and areas that are predicted to be essential under future climate change, is recommended.
Supplementary material
To view supplementary material for this article, please visit https://doi.org/10.1017/S0376892922000030.
Acknowledgements
The authors thank Professor Nicholas Polunin, the editor of Environmental Conservation, and anonymous reviewers for their valuable advice and comments.
Author contributions
JMD: conceptualization, data curation, formal analysis, funding acquisition, methodology, validation, writing – original draft. IR: investigation, project administration, supervision, writing – review and editing.
Financial support
Funding for this research was provided by the Human Resource Development Group of the Council of Scientific and Industrial Research (CSIR), India, vide Award No. 13 (9091-A)/2021 to the first author.
Conflict of interest
The authors declare none.
Ethical standards
None.


