


INTRODUCTION
The East Asian–Australasian Flyway (EAAF) forms the migration path and habitat for approximately 155 waterbird species (MacKinnon et al. Reference MacKinnon, Verkuil and Murray2012). However, many of the important wintering, breeding and stopover sites in East Asia are at high risk of loss due to unprecedented human population growth and economic and industrial development (Murray et al. Reference Murray, Clemens, Phinn, Possingham and Fuller2014). These have resulted in an exponential increase of habitat conversion, pollution and direct human disturbance (Islam & Tanaka Reference Islam and Tanaka2004, Murray et al. Reference Murray, Clemens, Phinn, Possingham and Fuller2014). The impacts of these threats have been varied, with some species experiencing rapid loss of habitat and population declines, while others are relatively steady or recovering from previous decline (Amano et al. Reference Amano, Székely, Koyama, Amano and Sutherland2010). These threats continue under the additional threat of climate change; many more species could be under threat.
Remaining East Asian intertidal habitat is a clear conservation priority that needs to be protected from further loss to protect the migratory waterbirds of the EAAF (Murray et al. Reference Murray, Clemens, Phinn, Possingham and Fuller2014). However, the distribution of suitable habitat could shift with climate change, and management plans may require updating to reflect novel environmental conditions. In particular, high-latitude habitat may become more suitable for wintering waterbirds due to warming, and conservation may soon become important in locations where protection was not historically needed (Lehikoinen et al. Reference Lehikoinen, Jaatinen, Vähätalo, Clausen, Crowe, Deceuninck and Hearn2013, Pavón‐Jordán et al. Reference Pavón‐Jordán, Fox, Clausen, Dagys, Beceuninck, Devos and Hearn2015).
There are few species in East Asia for which demographic data are available, and therefore for which threats to populations can be quantified. One of the iconic species of the EAAF is the black-faced spoonbill (Platalea minor), which is distributed across much of East Asia. Populations of P. minor suffered a severe decline in the mid-20th century, and extensive management and monitoring of the species have resulted in a steady recovery (Ueng et al. Reference Ueng, Wang and Hou2007, Chan et al. Reference Chan, Fang, Lee, Yamada and Yu2010). From 1990 to 2015, the global population rose from approximately 300 individuals to over 3200 (Chan et al. Reference Chan, Fang, Lee, Yamada and Yu2010, Yu et al. Reference Yu, Fong and Tse2015).
Genetic analysis of historical population size suggests that the initial decline and current recovery were due to the widespread use and then banning of DDT in East Asia (Yeung et al. Reference Yeung, Yao, Hsu, Wang and Li2006). Now that this threat has been reduced, the recovery of P. minor to a viable population is the goal of current conservation efforts. As the population recovers towards its historical size, there is nevertheless concern that the vastly depleted habitat cannot sustain such a population (assuming the species is unable to find new or novel habitats). Or if it can, continued pressures on their habitat, such as climate change, habitat degradation and pollution, will jeopardize viability into the future. Due to the relatively small and sparse distribution of P. minor, there is particular concern regarding the impact of climate change into the future (Hu et al. Reference Hu, Hu and Jiang2010). Similarly, pollution substantially increased over the entire range of P. minor during the past decades due to the rapid economic growth in the region, the effects of which are already visible, with multiple outbreaks of botulism killing many black-faced spoonbills due to contamination of their feeding grounds (Ueng et al. Reference Ueng, Perng, Wang, Weng and Hou2006). However, the impacts of these threats on these populations are still unknown, and they could prevent full recovery of the population.
Population viability analysis is an important tool for quantifying these concerns about the effects of threatening processes on the population. At its most basic, population viability analysis uses the vital life-history rates (births, deaths and migration) in a demographic model to project the population size into the future (Beissinger & Westphal Reference Beissinger and Westphal1998). However, in an uncertain and changing environment, it is important to include possible changes to habitat that will likely impact the trajectory of the population (Beissinger & Westphal Reference Beissinger and Westphal1998). This can be achieved through spatial population viability analysis, which models each population separately while allowing potential interactions of vital rates between these separate models. This also allows demographic variables such as carrying capacity to be linked to habitat quality (Franklin et al. Reference Franklin, Regan and Syphard2014). These models provide greater flexibility for modelling threatening processes such as habitat loss, degradation, pollution or climate change as these processes vary spatially.
We aimed to quantify the impact of threatening processes to populations of P. minor into the future. To achieve this, we ran a spatial population viability analysis using the software RAMAS GIS (Akçakaya & Root Reference Akçakaya and Root2005) and modelled the impact of changes to habitat quality from climate change and directly from habitat degradation.
METHODS
Demographic data
The spatial population viability model requires demographic rates. Information on the demographic rates used in this model (Fig. 1) were collated from various studies in East Asia as follows: we set up the population structure for our model based on maturation rate of P. minor, with females taking 3 years to mature and males 4 years (J.R. Chong, unpublished data, 2015). Therefore, population survival was modelled using five age groups for males (0–1, 1–2, 2–3, 3–4 and >4 years) and four for females (0–1, 1–2, 2–3 and >3 years). Only males over 4 years old and females over 3 years old were allowed to breed, producing three eggs per pair under a monogamous breeding system (Chong et al. Reference Chong, Pak, Rim and Kim1996, J.R. Chong, unpublished data, 2015). Annual survival was determined using bird-banding data from 2002 to 2014 with birds banded in Korea and re-sighted in their wintering grounds similar to Ueng et al. (Reference Ueng, Wang and Hou2007). Re-sight probability was high due to high levels of site fidelity in this species. Re-sighted birds provided the minimum known alive animals during each winter, which we used to produce minimum survival rates for each age group over the survey period (Fig. 1) and produced survival rates (mean adult survival of 0.838) similar to Ueng et al. (Reference Ueng, Wang and Hou2007; mean adult survival of 0.86). Therefore, this represents a conservative estimate for the population viability analysis. We also took the standard deviation of return rates as the measure of variability in survival (i.e. mean adult survival of 0.838 ± 0.165).
Figure 1 Representation of the stage matrix of both sexes of Platalea minor for the demographic component of the population viability analysis. Transition probabilities (G) represent survival between each age group until sexual maturity, at which point survival (S) is constant. Fecundity (F) is 1.5 for both sexes, as monogamous pairs produce three eggs per clutch.
We used a stochastic age-structured matrix model based on the vital rates described above, constructed and implemented in RAMAS GIS (Akçakaya & Root Reference Akçakaya and Root2005). RAMAS GIS is a computer program designed to execute spatial population viability analyses. We assumed all vital rates to be correlated. We also specified no dispersal between populations. Given the migratory nature of the species, this is clearly not an accurate representation of P. minor biology. Similarly, we did not model annual migrations or breeding in summer distribution grounds, as this species crosses many very sensitive political boundaries and data have not been collected throughout its entire range. This model therefore represents a winter distribution-focused perspective and is conservative with respect to its winter population dynamics, likely with higher estimated extinction risks without dispersal and with correlated vital rates (Rueda-Cediel et al. Reference Rueda-Cediel, Anderson, Regan, Franklin and Regan2015).
Models were run using ceiling density dependence with carrying capacity determined by the species distribution model (see below). Ceiling density dependence assumes a stable growth rate when populations are under a certain population size (the ‘ceiling’ carrying capacity) and a rapidly declining growth rate once the population grows above this ceiling. Other modes of density dependence work as a function between population growth and population density, and therefore always produce growing populations at small sizes. There is no evidence for these density relationships for P. minor populations, which have grown steadily over the past decades (Yeung et al. Reference Yeung, Yao, Hsu, Wang and Li2006), but a ceiling density dependence is suspected for many bird species (Newton Reference Newton1998).
Species distribution model
We used MaxEnt version 3.3.3k to build the distribution model of P. minor. MaxEnt uses presence-only location data and environmental variables to model the relative environmental suitability (Phillips & Dudik Reference Phillips and Dudik2008). Locations of wintering birds were obtained from the species action plan for P. minor, which collates the annual global census data of P. minor (Chan et al. Reference Chan, Fang, Lee, Yamada and Yu2010). These data were limited to the wintering ground throughout South-East and East Asia. Breeding ground data are much harder to obtain due to location, mostly within the demilitarized zone of Korea and throughout the west coast of North Korea. We therefore limited the population viability analysis to the wintering ground of the species.
We used nineteen 1-km resolution climate variables averaged over 1950–2000 from Worldclim to represent current climate data (Hijmans et al. Reference Hijmans, Cameron, Parra, Jones and Jarvis2005). Topography data, including an elevation map and compound index map (compound topographic index, or wetness index, indicating how much upstream water the area receives), were obtained from GTOPO30 Hydro1 K dataset with a resolution of 250 m (USGS 2009), and resampled to a 1-km resolution. Habitat data were downloaded from the Global Land Cover 2000 database (Global Land Cover 2003). We used ArcGIS version 10.2 (ESRI 2011) to produce all maps.
To project the distribution of P. minor to the year 2050, we used downscaled Intergovernmental Panel for Climate Change Fifth Assessment Report data at a 1-km resolution with two general circulation models: IPSL-CM5A-LR (Dufresne et al. Reference Dufresne, Foujols, Denvil, Caubel, Marti, Aumont and Mignot2013) and MRI-CGCM3 (Yukimoto et al. Reference Yukimoto, Adachi, Hosaka, Sakami, Yoshimura, Hirabara and Tanaka2012) (hereafter referred to as IP and MG, respectively). The latter exhibited a milder change in temperature (Stocker et al. Reference Stocker, Qin, Plattner, Tignor, Allen, Boschung and Nauels2013). We used the minimum and maximum representative concentration pathways (RCP2.6 and RCP8.5), representing +2.6 W m–2 and +8.5 W m–2 of net solar radiation energy absorbed by Earth in 2100 compared to pre-industry times, respectively. The RCP2.6 mitigation scenario stabilizes and slowly reduces greenhouse gas emissions after the middle of the 21st century, while RCP8.5 does not, which consequently increases average temperatures by 1.0°C and 2.0°C, respectively, by 2026–2045 (Stocker et al. Reference Stocker, Qin, Plattner, Tignor, Allen, Boschung and Nauels2013).
Coupled population viability and species distribution models
Using RAMAS GIS, we then linked the maps resulting from the species distribution models with the underlying demographic model following the approach of Bonebrake et al. (Reference Bonebrake, Syphard, Fraklin, Anderson, Akçakaya, Mizerek, Winchell and Regan2014). Specifically, habitat patches were defined as collections of nearby cells (within 25 km) of high probability of species occurrence according to the species distribution model. Suitable habitat for P. minor was defined as greater than 70% probability of species occurrence, which included all current populations. Cells with maximally suitable habitat were modelled as having a carrying capacity of 10 birds per cell. This was calculated according to the area occupied and maximum population size in Hong Kong and Guangdong. The carrying capacity of a patch was then calculated as the habitat suitability summed across cells in the patch multiplied by the carrying capacity in a cell with maximally suitable habitat.
Using this initial model, we first created two hindcasting models that compared population projections with population estimates from the global black-faced spoonbill census during 2004–2015. We compared the model described above and the model produced by Ueng et al. (Reference Ueng, Wang and Hou2007) to validate the predictive accuracy of the model over the past decade. We then created a base model for the period 2014–2050 for comparison with threat models, which are described below. To account for the stochastic nature of populations, the variances in survival and fecundity were modelled using the standard deviations of these vital rates, and were randomly generated for each year using a lognormal distribution. Models were run 1000 times to account for variations in population projections due to this stochasticity. Model results are therefore presented as the mean population projection, and uncertainty in model outcomes can be presented as the standard deviation.
Species distribution maps under different climate scenarios were projected to 2050. Maps were linearly interpolated for each year between 2014 and 2050, and hence modelled habitat patches and their associated carrying capacities, as described above, had the ability to shift and change in each year according to projected changes in climate. Using this method, we could compare static scenarios where the species distribution does not change annually and climate dynamic models under which the species’ distribution shifts with climate predictions.
To model the effect of habitat change, we first identified the populations at risk of habitat loss according to the P. minor species action plan (Chan et al. Reference Chan, Fang, Lee, Yamada and Yu2010). Over the past five decades, 65% of wetland in the Yellow Sea has been lost to coastal development (Murray et al. Reference Murray, Clemens, Phinn, Possingham and Fuller2014). This is similar to what is expected throughout coastal China and Korea (Yu Reference Yu1994, Cho & Olsen Reference Cho and Olsen2003, An et al. Reference An, Li, Guan, Zhou, Wang, Deng and Zhi2007), and although future predictions have not been made, loss of habitat is expected to continue at a similar rate. Scenarios were created in which threatened populations were modelled with a linearly decreasing carrying capacity up to 2050. Three scenarios were modelled: no change in habitat; 20% reduction in habitat (by 2050), representing a low-loss scenario; and 75% reduction in habitat for vulnerable populations representing high loss. To model climate change and habitat loss, we took the changing/dynamic carrying capacity of the climate change scenarios and then imposed the same habitat loss scenarios (20% and 75%) on top of the climate change impacts.
We created 15 forecast models to compare projected populations to 2050 given threats from climate change and habitat loss (Table 1).
Table 1 Models of projected threats for the Platalea minor population viability analysis. IP and MG, respectively, refer to the IPSL-CM5A-LR global climate model from Dufresne et al. (Reference Dufresne, Foujols, Denvil, Caubel, Marti, Aumont and Mignot2013) and the MRI-CGCM3 global climate model from Yukimoto et al. (Reference Yukimoto, Adachi, Hosaka, Sakami, Yoshimura, Hirabara and Tanaka2012). RCP = representative concentration pathway.
RESULTS
The species distribution model predicted a coastal wintering distribution in East Asia that corresponds well with the current distribution of P. minor (Table S1; available online). Climate change models predicted a northward range shift, with the largest reductions in currently occupied habitat occurring in southern China and Taiwan (Fig. 2). However, this was not consistent between models, with Taiwanese and Japanese populations increasing in some scenarios when large areas of wetland that are not currently considered suitable become climatically suitable. This occurred in the RCP2.6 climate models, with the equivalent RCP8.5 models again losing this suitability.
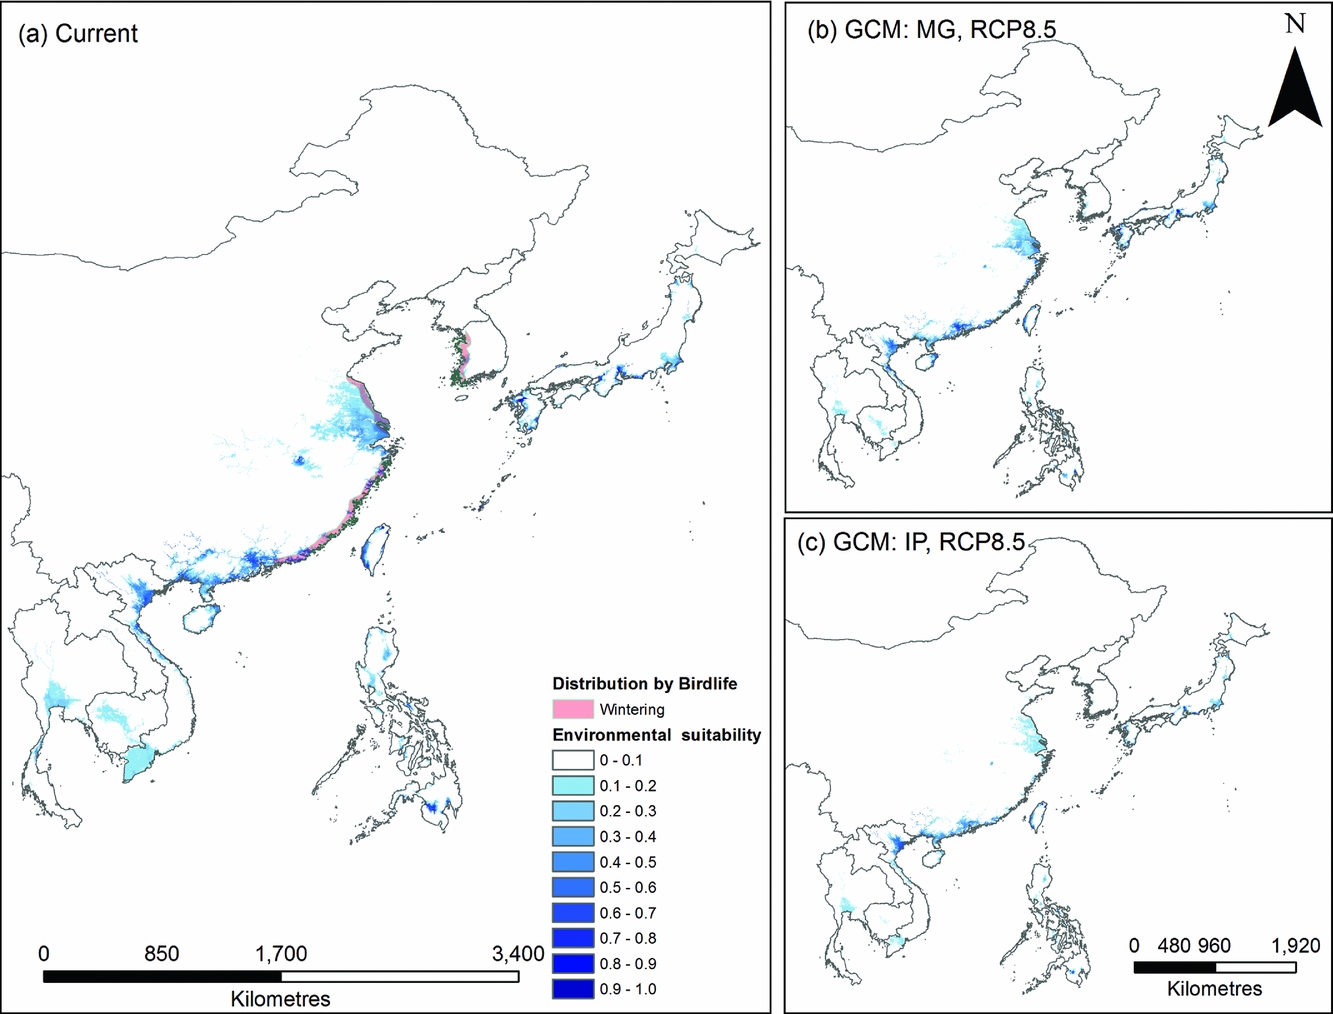
Figure 2 Comparison of species distribution models from (a) current location data from 2014 and average climatic and habitat conditions from 1950 to 2000 and (b and c) future distributions given climate change (RCP8.5 for both general circulation models). Blue represents high environmental suitability for Platalea minor in East Asia. Current known distributions are shown on the left map. IP and MG, respectively, refer to the IPSL-CM5A-LR global climate model from Dufresne et al. (Reference Dufresne, Foujols, Denvil, Caubel, Marti, Aumont and Mignot2013) and the MRI-CGCM3 global climate model from Yukimoto et al. (Reference Yukimoto, Adachi, Hosaka, Sakami, Yoshimura, Hirabara and Tanaka2012). RCP = representative concentration pathway.
Incorporating these species distribution models into the population viability analysis produced 84 habitat patches, of which 18 are currently occupied by P. minor. Climate change scenarios predicted changes in the carrying capacity of habitat patches. Of the larger habitat patches, the models predicted reductions in carrying capacities in southern China, variable changes in Tainan, Kyushu and Okinawa and a stable carrying capacity in southern Honshu.
Using the 2004 population census numbers, we produced a hindcasting projection for the spatial model that we produced and compared it with the demographic model produced by Ueng et al. (Reference Ueng, Wang and Hou2007), which does not consider the spatial dynamics of P. minor. Our spatial model predicted the 2015 population size to within one standard deviation of the projected population size, whereas the demographic model overestimated the 2015 population (Fig. 3).
Figure 3 Hindcasting projection of the population trajectory for the BFS using (1) historical BFS international census data; (2) demographic PVA from Ueng et al. (Reference Ueng, Wang and Hou2007); and (3) spatial PVA from this study. Shaded regions indicate one standard deviation from the mean population projection from the population viability model. BFS = black-faced spoonbill; PVA = population viability analysis.
The base model for projecting the P. minor population predicted a consistent increase in population size to 14 044 individuals by 2050 (8616–19 472 ± 1 SD) (Fig. 4). Incorporating climate change into this model had varying impacts, with the IP8.5 model substantially reducing the rate of population growth compared to no climate change models or the MG8.5 model. The effect of habitat loss was most obvious for the 75% habitat loss scenario, where the global population begins to decline after 28 years. This coincides with the population at Tainan in Taiwan reaching the carrying capacity, which is declining due to both habitat loss and climate change (Fig. S1). The area centred around Mai Po in Hong Kong has a highly uncertain future with respect to climate change. Different climate scenarios resulted in either an increased growth rate or possible extinction. The population on Kyushu, Japan, showed similar uncertainty, but may recover from initial climate-related declines (Fig. S1). Individual scenarios also exhibited significant uncertainty, particularly Tainan, over all model runs, but the ranges of trajectories are reasonable given the variability in demographic rates (Fig. S2).
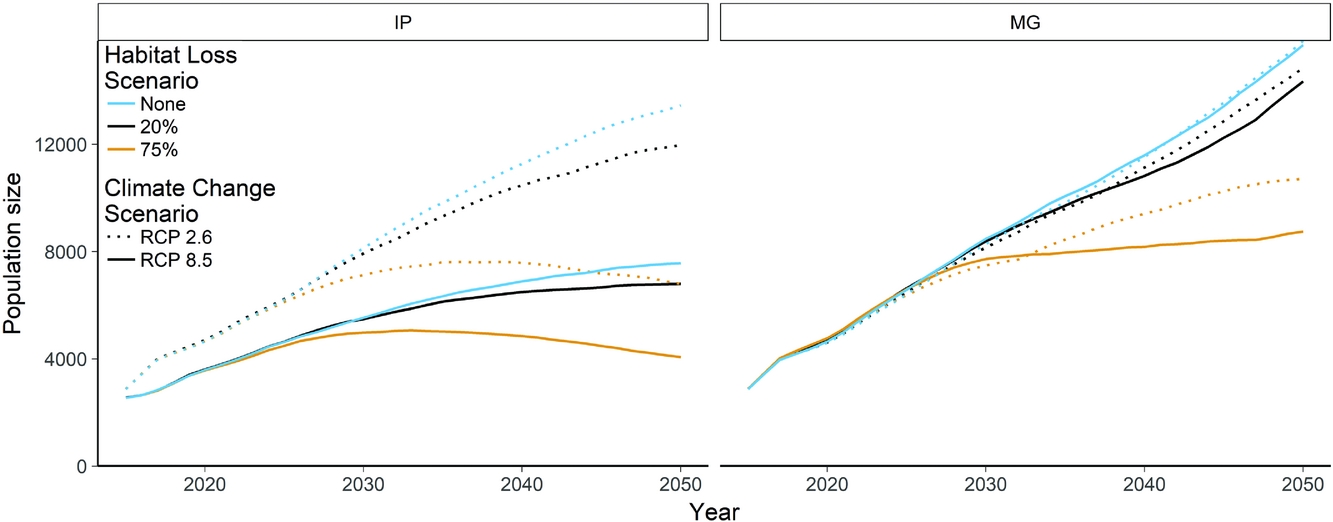
Figure 4 Mean global population size projections of Platalea minor, comparing the base population viability model with no threats to the additive effects of climate change and habitat loss. Climate change scenarios are representative concentration pathways 2.6 and 8.5. Habitat loss scenarios represent 0%, 20% and 75% losses of wetland habitat. IP and MG, respectively, refer to the IPSL-CM5A-LR global climate model from Dufresne et al. (Reference Dufresne, Foujols, Denvil, Caubel, Marti, Aumont and Mignot2013) and the MRI-CGCM3 global climate model from Yukimoto et al. (Reference Yukimoto, Adachi, Hosaka, Sakami, Yoshimura, Hirabara and Tanaka2012).
DISCUSSION
The historic decline of P. minor means that populations were reduced to well below the environmental carrying capacities, but populations have steadily recovered over the past 20 years with improved conservation of winter habitats (Yeung et al. Reference Yeung, Yao, Hsu, Wang and Li2006). Threats that decrease these carrying capacities are therefore not expressed through population decline. In addition, according to the population viability analysis, impacts on carrying capacities will not be expressed for at least another decade. Therefore, this population growth hides the underlying process that will lead to future declines, as climate change and habitat loss decrease the carrying capacities of P. minor habitats. This cryptic impact is particularly worrying given the uncertainty in terms of when this decline will become apparent through declines in each population.
Spatial viability analysis of the wintering distribution of P. minor indicated that habitat loss and climate change each pose high risks to the recovery of P. minor to historic populations, and the combined high impacts of both of these risks could result in threatening declines by the second half of the century. This result is consistent with recent studies examining the combined impacts of land use and climate change on bird species (Fraixedas et al. Reference Fraixedas, Lehikoinen and Lindén2015, Virkkala Reference Virkkala2016). The reversal of recovery observed for P. minor under this scenario is due to habitat degradation (either due to habitat loss or climate change) in southern China and Taiwan, which currently comprise two of the three largest populations in the world (Yu et al. Reference Yu, Fong and Tse2015). The third population in Kyushu (Japan) may be negatively affected by climate change. However, different climate change scenarios have widely different effects (Syphard et al. Reference Syphard, Regan, Franklin, Swab and Bonebrake2013), with the MG scenarios showing similar growth to the no climate change scenarios. Other threats are likely to compound these impacts, such as sea level rise associated with global warming, which is known to be a significant threat to coastal waterbird species (Hunter et al. Reference Hunter, Nibbelink, Alexander, Barrett, Mengak, Guy, Moore and Cooper2015), particularly in the EAAF (Iwamura et al. Reference Iwamura, Possingham, Chadès, Minton, Murray, Rogers, Treml and Fuller2013).
Looking specifically at climate change, the effects are not spatially consistent. While the populations in southern China and Taiwan are most at threat, northern populations are declining to a lesser extent or remaining stable depending on the scenario. Japan, which exhibits the least impact due to climate change, could provide important refuge for P. minor from the negative impacts of climate change. In the future, then, under climate change, northern, unprotected wintering populations could grow, while southern, protected wintering populations might decline, as has been observed recently for some waterbird species (Lehikoinen et al. Reference Lehikoinen, Jaatinen, Vähätalo, Clausen, Crowe, Deceuninck and Hearn2013). Warming could have even greater effects on the species if additional phenological shifts take place. For example, warming could alter the timing of migratory events and result in carryover effects and mismatches between peak food periods and P. minor arrival times at their winter grounds (Pearce-Higgins et al. Reference Pearce-Higgins, Yalden and Whittingham2005, Hua et al. Reference Hua, Tan, Chen and Ma2015).
Given these results, habitat management should remain a priority for the conservation of P. minor. Habitat loss in East Asia is a concern for most migratory species, and the continued loss of habitat will have an impact on this species. Conservation of intertidal habitat in East Asia is of extremely high priority for the continued persistence of P. minor, and protection of this habitat is the most direct way that local environmental management could benefit the species. While this study has focused on wintering habitat, it is possible that breeding or stopover habitats could be the limiting factors on carrying capacity (see below). Therefore, we do not prioritize any of these habitats as more important – further studies should focus on impacts on these sites before this can be done.
Pollution and associated disease outbreaks could further add to the cumulative threats to P. minor population recovery (Ueng et al. Reference Ueng, Perng, Wang, Weng and Hou2006). However, the limited number of observed outbreaks and a lack of data prevented their inclusion in this model. Close monitoring of botulism outbreaks should continue in order to ensure that outbreaks do not increase in magnitude or frequency into the future. As disease threats to bird species tend to increase in the face of multiple threats (e.g. habitat loss; Heard et al. Reference Heard, Smith, Ripp, Berger, Chen, Dittmeier and Goter2013), this could become an increasingly important issue for P. minor.
P. minor is just one of the many threatened migratory birds in the EAAF, and P. minor is exposed to threats that are common to all species in the flyway. As expected, the high levels of intertidal habitat loss in East Asia are of concern for flyway species, and even a species whose population is growing at a fast rate due to recovery from previous declines is at significant risk from habitat loss. The potentially large impacts of climate change in the southern range of P. minor would likely occur for other species, and further research on the effects and mitigation of climate change on migratory birds is particularly important given the additive impacts from habitat loss in this area (Iwamura et al. Reference Iwamura, Possingham, Chadès, Minton, Murray, Rogers, Treml and Fuller2013, Reference Iwamura, Fuller and Possingham2014). The development of climate change adaptation plans involving all stakeholders of critical tidal habitats could lead to enhanced resilience (Thorne et al. Reference Thorne, Mattsson, Takekawa, Cummings, Crouse, Block and Bloom2015).
The population model developed here is primarily limited in two aspects: the use of minimum survival and the lack of data in the breeding grounds or stopover sites. As this is a conservative model that uses known, alive animals, it is possible that the growth rate is actually faster, and this would shorten the time required to reach carrying capacity. However, the high survival estimates we observed limit their potential error, as there is not much room for them to increase. In addition, the hindcasting model produced relatively accurate predictions for 2002–2014, which suggests our projected population growth is relatively accurate.
The data used to produce the distribution model for the wintering grounds of P. minor are among the most comprehensive spatial data for any bird species in Asia. Although the summer breeding grounds may be – and may become – the limiting factor for the population, we did not address them explicitly in this model. Again, if this were the case, it would shorten the time for the population to reach carrying capacity, as the breeding habitat would limit population growth before the wintering habitat. If possible, future research on the spatial distributions of breeding and feeding areas in P. minor breeding grounds could help to improve future population assessments and model projections.
Similarly, this analysis did not take into account the stopover sites for P. minor, which could be a major source of concern. Stopover sites provide much-needed energy for birds during migration. This can cause a bottleneck, as the stopover sites can be much smaller than both wintering and breeding locations, and multiple populations may share the same sites. However, although some stopover sites have been identified for P. minor (Ueta et al. Reference Ueta, Melville, Wang, Ozaki, Kanai, Leader, Wang and Kuo2002), demographic data are severely limited by small sample sizes, and no impacts can be modelled. Any research on the stopover sites and their impacts on populations of P. minor would provide a very useful expansion to this study.
The risk of cryptic threats to wildlife populations is particularly problematic in the current context of multiple and often increasing threatening processes. While current or historical threats may reduce a population size to well below carrying capacity through demographic processes such as decreased recruitment, subsequent degradation and loss of habitat will dampen recovery efforts. P. minor’s possible recovery to its historical population size is dependent on both protection of the habitat through conversion, particularly for industrial purposes, and mitigation of climate change impacts. As these threats, and others, continue to degrade habitats worldwide, it is particularly important to consider their cryptic and cumulative impacts on population viability.
ACKNOWLEDGEMENTS
We are grateful for input from Helen Regan and Kurt Anderson on the model construction and interpretation, and Chong Jong Ryol for expert opinion and input on the ecology of the black-faced spoonbill.
FINANCIAL SUPPORT
This research was made possible by the Ocean Park Conservation Foundation and the Hong Kong Research Grants Council (HKU 778512).
CONFLICTS OF INTEREST
None.
ETHICAL STANDARDS
None.
Supplementary material
To view supplementary material for this article, please visit https://doi.org/10.1017/S0376892917000340


