


INTRODUCTION
Community-based monitoring of environmental resources has become increasingly popular worldwide (Evans et al. Reference Evans, Birchenough and Fletcher2000; Pattenengill-Semmens & Semmens Reference Pattengill-Semmens and Semmens2003; Gouveia et al. Reference Gouveia, Fonseca, Camara and Ferreira2004; Danielsen et al. Reference Danielsen, Mendoza, Tagtag, Alviola, Balete, Jensen, Enghoff and Poulsen2007), including that of seagrass habitats (McKenzie et al. Reference McKenzie, Lee Long, Coles and Roder2000; Mellors et al. Reference Mellors, McKenzie and Coles2008). Advantages of this kind of data collection include cost efficiency, coverage of large spatial scales, community engagement and education and multi-organizational involvement (Darwall & Dulvy Reference Darwall and Dulvy1996; Evans & Birchenough Reference Evans and Birchenough2001; Fore et al. Reference Fore, Paulsen and O'Laughlin2001; Nicholson et al. Reference Nicholson, Ryan and Hodgkins2002; Goffredo et al. Reference Goffredo, Piccinetti and Zaccanti2004; Sharpe & Conrad Reference Sharpe and Conrad2006; Danielsen et al. Reference Danielsen, Burgess and Balmford2005a). However, the accuracy and usefulness of environmental data collected by volunteers are often questioned (Darwall & Dulvy Reference Darwall and Dulvy1996; Foster-Smith & Evans Reference Foster-Smith and Evans2003; Gouveia et al. Reference Gouveia, Fonseca, Camara and Ferreira2004; Uychiaoco et al. Reference Uychiaoco, Arceo, Green, De La Cruz, Gaite and Alino2005). There is thus a need for studies comparing findings of volunteer monitoring with that of professionals (Danielsen et al. Reference Danielsen, Burgess and Balmford2005a, Reference Danielsen, Burgess, Balmford, Donald, Funder, Jones, Alviola, Balete, Blomley, Brashares, Child, Enghoff, Fjeldsa, Holt, Hubertz, Jensen, Jensen, Massao, Mendoza, Ngaga, Poulsen, Rueda, Sam, Skielboe, Stuart-Hill, Topp-Jorgensen and Yonten2009).
Seagrasses are marine angiosperms that have evolved to cope with salinity, low and variable light, water movement and anoxic sediment (Touchette Reference Touchette2007a, Reference Touchetteb). Seagrass meadows provide an important coastal habitat and are often indicative of ecosystem health in many intertidal and subtidal areas (Bostrom et al. Reference Bostrom, Jackson and Simenstad2006; McArthur & Boland Reference McArthur and Boland2006; Short et al. Reference Short, Koch, Creed, Magalhaes, Fernandez and Gaeckle2006, Reference Short, Carruthers, Dennison and Waycott2007). There are numerous natural and anthropogenic threats to seagrasses, and once lost, recovery by both natural processes and restoration practices can be problematic (West et al. Reference West, Jacobs and Roberts1990; Lee Long et al. Reference Lee Long, Coles and McKenzie2000; Campbell & McKenzie Reference Campbell and McKenzie2004; McLennan & Sumpton Reference McLennan and Sumpton2005; Orth et al. Reference Orth, Carruthers, Dennison, Duarte, Fourqurean, Heck, Hughes, Kendrick, Kenworthy, Olyarnik, Short, Waycott and Williams2006). Seagrasses are excellent organisms to monitor owing to their widespread distribution, important ecological role, sessile nature and the fact that they are integrative of environmental conditions and show measurable and timely responses to impacts (Orth et al. Reference Orth, Carruthers, Dennison, Duarte, Fourqurean, Heck, Hughes, Kendrick, Kenworthy, Olyarnik, Short, Waycott and Williams2006).
Seagrass-Watch (SGW) was established in 1998 in Australia as an initiative of Fisheries Queensland (McKenzie et al. Reference McKenzie, Lee Long, Coles and Roder2000) and is now the largest scientific non-destructive seagrass assessment and monitoring programme in the world, with 26 countries participating. There are currently 18 regions within Australia where SGW programmes have been established, and 15 of these are in Queensland. The largest of these regions in Queensland is located in Moreton Bay, a large estuarine bay adjacent to the city of Brisbane (south-east Queensland) and a marine park. In Moreton Bay, most sites are located within intertidal areas enabling ease of access and good visibility at low tide. In this respect, SGW aims to raise awareness of the condition and trend of the Bay's nearshore seagrass ecosystems and provide an early warning of environmental changes. However this can only be achieved if accurate and consistent data can be collected. We aimed to assess the correspondence between and accuracy of seagrass cover data collected by volunteers and scientists. This study has wider ramifications concerning the qualities of successful community-based monitoring programmes.We also present some results from the present monitoring programme.
METHODS
Seagrasses in Moreton Bay
Moreton Bay (27–28°S and 153°–153° 30′ E; Fig. 1) is one of the largest estuarine bays in Australia (300 177 ha; Blackman & Craven Reference Blackman, Craven, Blackman, Perry, Ford, Craven, Gardiner and De Lai1999), enclosed on its western side by the mainland and on its eastern side by two of the largest sand islands in the world (Moreton and North Stradbroke Islands). The Bay extends approximately 132 km along the coast in a north–south direction, reaching a maximum width and depth of 40 km and 40 m, respectively (Blackman & Craven Reference Blackman, Craven, Blackman, Perry, Ford, Craven, Gardiner and De Lai1999). There is an east–west water quality gradient: higher water column nutrients and turbidity are recorded in the west compared with the east where conditions are relatively pristine (Dennison & Abal Reference Dennison and Abal1999). Substrate types within the Bay are diverse and have been broadly categorized into sand, coral, sandy mud and mud (Young Reference Young1978). Moreton Bay contains a biologically diverse system of intertidal flats totalling 23 000 ha at low tide (Blackman & Craven Reference Blackman, Craven, Blackman, Perry, Ford, Craven, Gardiner and De Lai1999), many of which have been colonized by seagrass. Moreton Bay supports seven seagrass species (Zostera muelleri capricorni, Halophila ovalis, Halophila spinulosa, Halophila decipiens, Halodule uninervis, Cymodocea serrulata and Syringodium isoetifolium), totalling about 25 000 ha, which occur in both intertidal and subtidal areas (Hyland et al. Reference Hyland, Courtney and Butler1989; Blackman & Craven Reference Blackman, Craven, Blackman, Perry, Ford, Craven, Gardiner and De Lai1999).

Figure 1 Map of Moreton Bay showing the 20 locations within which one to four sites (50 m × 50 m sections of intertidal flat) were situated (location codes identified in Table 1). Shaded circles denote those locations which were analysed for data quality.
Volunteers and seagrass surveys
SGW in Moreton Bay now monitors 51 sites within 20 locations (Fig. 1, Table 1), determined by survey logistics and attainment of wide coverage of the Bay's geographical extremities and varying environmental characteristics. Within locations, replicate sites were situated about 1000 m apart but within similar habitat types (for example intertidal position, water quality and substrate type). Sites were permanently marked with a plastic star-picket at the start of the middle transect (see below), where a global positioning system (GPS) location was also recorded, to ensure monitoring occurred in the same area each time.
Table 1 Average per cent seagrass cover and composition (Zc = Zostera muelleri capricorni, Ho = Halophila ovalis, Hs = Halophila spinulosa, Hu = Halodule uninervis, Cs = Cymodocea serrulata, Si = Syringodium isoetifolium and Hd = Halophila decipiens) recorded June 2001–April 2008 at 20 locations (see Fig. 1) within Moreton Bay, and data collected for each location in terms of the number of sites and surveys conducted and number of surveys analysed for data quality. Ranked from highest to lowest average per cent seagrass cover. SE = average standard error. *Denotes those locations selected to test the quality of volunteer-collected data.

Following training, teams of two to four volunteers adopted a site and conducted unsupervised seagrass surveys within three distinct monitoring periods per year: autumn (March–April), winter (July–August) and summer (November–December). The SGW survey methods are described in detail in McKenzie et al. (Reference McKenzie, Lee Long, Coles and Roder2000, Reference McKenzie, Campbell and Roder2001). Briefly, at each site, volunteers walked three 50 m long transects, 25 m apart, running perpendicular to the shoreline and visually assessed and recorded the percentage seagrass cover (with the assistance of photographic guides) within a 50 cm × 50 cm quadrat every 5 m, making a total of 33 quadrats per 50 m × 50 m site. A coordinating scientist later scored nine of these 33 samples (27%), via photographs taken by the volunteers, to provide an independent data quality control measure.
In Moreton Bay, approximately 240 volunteers have been trained in the SGW method for surveying seagrass meadows through formal lectures in a classroom style venue and/or on-site field training. Of these, about 150 volunteers monitor seagrass at 51 sites. In total, training involved a minimum of 6–9 hours for any particular volunteer. The major part of the training involved two three-hour sessions with small groups on site, approximately four months apart. Many volunteers also attended a classroom style session of about three hours duration comprising formal lectures and hands-on species identification. Ongoing training in the form of refresher lectures and field exercises was provided for volunteers who felt they required it. However, the vast majority of volunteers felt confident in the survey methods after participating in the sessions described above and further contact with the volunteers tended to focus on the identification of other species associated with seagrass (such as macroalgae, invertebrates and birds). The volunteers ranged in age from 13 to 68 and represented a diverse cross-section of the community, including tradespeople, engineers, school teachers, fishers, divers, retirees, high school and university students, biologists and ecologists. Many were involved with local environmental groups and hence often had a keen interest in conservation and environmental issues.
Data analysis
Four locations were selected (each consisting of three or four sites) where seagrass was present and at least 30 seagrass monitoring sessions had been conducted between June 2001 and April 2008 (see Table 1, Fig. 1). From this data set 104 monitoring sessions were selected (consisting of 14 sites surveyed between three and 13 times each over seven years) where all nine photographs were taken by up to 72 volunteers and these were able to be scored by one of three coordinating scientists (n = 936). In a test where all three coordinating scientists scored the same 191 photographs, there was a very good correlation among the three scientists in terms of their per cent seagrass cover estimates (r = 0.94–0.96, v = 189, p < 0.001 for all).
Pearson's correlation coefficient was used to determine the correspondence between the volunteers’ and the coordinating scientists’ estimates of per cent seagrass cover (n = 9) at 104 different monitoring sessions over time to test how closely the variation in visually estimated per cent seagrass cover scores from volunteers matched the variation assessed by scientists.
To measure the accuracy of the data collected by volunteers, it was assumed that the coordinating scientists’ seagrass cover estimates were correct and t-tests were used to compare these nine samples with those of the volunteers over the same 104 monitoring sessions.
Pearson's correlations were also used to compare volunteers’ and scientists’ visually estimated per cent seagrass cover scores at the 50 cm × 50 cm quadrat level using all 936 individual samples from the 104 monitoring sessions, and at the 50 m × 50 m site level using the average per cent seagrass cover across nine samples per site for each of the 104 monitoring sessions.
RESULTS
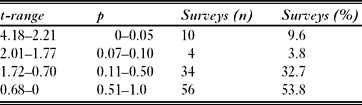
Out of 104 monitoring sessions where the correspondence between volunteers and coordinating scientists within sites over time was examined, only six (5.8%) were not statistically significant (Table 2). For the other 98 (94.2%) monitoring sessions there was a positive correlation between the per cent seagrass cover estimates of volunteers and scientists; the majority strongly correlated (Table 2). There was therefore generally a very close match between the seagrass cover estimates of volunteers and scientists at the site level over time. Over the same 104 surveys, the difference between the seagrass cover estimates of volunteers and scientists was significant in 10 cases (9.6%; t = 2.2–4.2, p < 0.05; Table 3). These ten cases were spread across six different sites and therefore involved different groups of volunteers. Thus 90% of the time there was no significant difference between the seagrass cover estimates of volunteers and scientists (Table 3).
Table 2 Correspondence in seagrass cover estimates (n = 9) between volunteers and scientists across 104 different surveys over space and time.
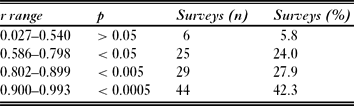
Table 3 Results from t-tests comparing the seagrass cover estimates (n = 9) made by volunteers and scientists across 104 different surveys over space and time.
There was a strong positive correlation between the seagrass cover estimates of the volunteers and scientists across 936 individual samples (r = 0.85, p < 0.0005). This relationship remained very similar when the seagrass cover estimates of volunteers and scientists was compared using the average across nine samples at each site for 104 monitoring sessions over time (r = 0.85, p < 0.0005; Fig. 2). Overall volunteers tended to overestimate the percentage of seagrass cover compared with scientists (Fig. 2). For the majority (518 of 936; 55%) of individual samples, the per cent difference in seagrass cover estimates between volunteers and scientists was five or less, very few were greater than 25% different (32 of 936; 3%) and none were greater than 50% different (Fig. 3).

Figure 2 Correlation between the per cent seagrass cover estimates made by volunteers and scientists across the average of nine samples (50 cm × 50 cm quadrats) per site for each of 104 monitoring sessions over time (r = 0.85, p < 0.0005). The line depicts y = x.

Figure 3 936 individual samples (50 cm × 50 cm quadrats) across nine categories of per cent difference in the per cent seagrass cover estimates between volunteers and scientists.
All seven seagrass species known to be present in Moreton Bay were recorded, but Zostera muelleri capricorni and Halophila ovalis were by far the most dominant and widespread (Table 1, Fig. 1). Halophila spinulosa was only recorded at three locations (Fisherman Islands, Moreton Banks and Amity Banks; Table 1, Fig. 1). Halophila decipiens was recorded at only one location (Peel Island) in very small amounts (0.8%; Table 1, Fig. 1). There was > 25% seagrass cover recorded at 70% of locations (Table 1, Fig. 1). No seagrass was recorded at two locations (Bramble Bay and Deception Bay [south]; Table 1, Fig. 1).
DISCUSSION
The seagrass cover data collected by volunteers in this programme were generally of high quality. For the majority of cases, the visual estimates of per cent seagrass cover made by volunteers and scientists at the site level over time were closely correlated and accurate. This is encouraging, particularly as sources of error were potentially numerous. Although photographs were scored consistently by one of the same three coordinating scientists, they were supplied by up to 72 different volunteers. If a sample had been incorrectly labelled in the field, the photo would not have matched the sample scored by the scientist in the office. Also, if the image quality had been poor (for example out of focus, underexposed or underwater) or there had been large amounts of macroalgae covering the sample, then misrepresentation of the actual amount of seagrass would have been likely. The 10 cases where inaccuracies were identified came from six different sites. One site returned inaccuracies five times out of 13 monitoring sessions, thus the other five sites returned inaccuracies only once each. Data quality control involves volunteers getting further training if inaccuracies are returned and, as most sites returned inaccuracies only once (five out of six), this process seems to be working.
Although several studies have shown a qualitative equivalence between the data collected by volunteers and scientists (Darwall & Dulvy Reference Darwall and Dulvy1996; Fore et al. Reference Fore, Paulsen and O'Laughlin2001; Foster-Smith & Evans Reference Foster-Smith and Evans2003; Bell Reference Bell2007), the level of correspondence and accuracy between volunteers and scientists experienced in the present study is not always achieved. Uychiaoco et al. (Reference Uychiaoco, Arceo, Green, De La Cruz, Gaite and Alino2005) found no significant correlation in the abundance estimates of major fish species between volunteers and biologists in the Philippines, although estimating seagrass cover is likely to be easier than estimating species-specific abundance of reef fish. In Tanzania, volunteer divers collected reliable data on reef fish diversity, abundance and length frequency distributions, however training was time consuming, involving one dive a day for about two weeks (Darwall & Dulvy Reference Darwall and Dulvy1996). Uychiaoco et al. (Reference Uychiaoco, Arceo, Green, De La Cruz, Gaite and Alino2005) also spent considerable effort training volunteers (3–5 training days, twice per year for three years) but data consistency between volunteers and scientists was low largely because it was hard to sustain long-term interest in the volunteers and team composition varied between monitoring times. Bell (Reference Bell2007) trained volunteers to recognize sponges within 14 morphological categories during one session using diagrammatic and photographic formats, and then tested them during two dives. Although volunteers missed 10–20% of sponges within samples, there was a good correspondence between datasets on sponge diversity and abundance collected by volunteers and a single scientist (Bell Reference Bell2007). The present study found a similar strength of correlation (Fig. 2) between seagrass cover estimates of volunteers and scientists. The strength of this correlation may be largely owing to the level of training delivered in simple methods and the relatively high level of education attained by the average volunteer prior to involvement in the programme.
Volunteers in the present study tended to overestimate the per cent seagrass cover compared with scientists (Fig. 2). Several other studies have also noted a more generous interpretation by volunteers compared with scientists (Nicholson et al. Reference Nicholson, Ryan and Hodgkins2002; Foster-Smith & Evans Reference Foster-Smith and Evans2003; Uychiaoco et al. Reference Uychiaoco, Arceo, Green, De La Cruz, Gaite and Alino2005; Galloway et al. Reference Galloway, Tudor and Vander Haegen2006). Uychiaoco et al. (Reference Uychiaoco, Arceo, Green, De La Cruz, Gaite and Alino2005) found that volunteers mostly overestimated fish abundance compared with biologists, sometimes by two orders of magnitude. Volunteer enthusiasm to generate data, especially in regard to rare items (Galloway et al. Reference Galloway, Tudor and Vander Haegen2006), may explain their tendency to exaggerate.
The present study has established that volunteer-collected seagrass cover data can be of a relatively high quality and it is reasonable to extrapolate this assurance to data from other sites presented in this paper. Therefore the data forms a reliable baseline of information about seagrasses in Moreton Bay and can have a monetary value placed on it. The data (Table 1) came from a total of 518 surveys, involving an average of three volunteers for three hours per survey. Costed at a typical management authority's wage rate (casual rate of AU$ 30 hr−1; AU$ 1 = US$ 0.83), the total cost of this data (in person hours only) was AU$ 139 860. Over the last five years since the programme was expanded from a pilot study, an average of 29 sites were monitored by volunteers during each of three monitoring periods per year, equivalent to AU$ 23 500 yr−1. In terms of the yearly running costs of the programme in Moreton Bay, approximate figures for coordination (salary AU$ 30 hr−1, 30.4 hr week−1, 48 weeks yr−1) and administration (including administrative staff support, office accommodation and resources, vehicular and vessel mileage, and equipment replacement and repair) were AU$ 43 500 and AU$ 16 000, respectively. There was also an initial expense of about AU$ 4000 for monitoring equipment. Danielsen et al. (Reference Danielsen, Burgess, Balmford, Donald, Funder, Jones, Alviola, Balete, Blomley, Brashares, Child, Enghoff, Fjeldsa, Holt, Hubertz, Jensen, Jensen, Massao, Mendoza, Ngaga, Poulsen, Rueda, Sam, Skielboe, Stuart-Hill, Topp-Jorgensen and Yonten2009) characterized the different approaches that monitoring programmes may take, and SGW in Moreton Bay fits into their category of ‘externally driven monitoring with local data collection’. This approach to monitoring can incur an intermediate to high cost to both the volunteers and the management authority (Danielsen et al. Reference Danielsen, Burgess, Balmford, Donald, Funder, Jones, Alviola, Balete, Blomley, Brashares, Child, Enghoff, Fjeldsa, Holt, Hubertz, Jensen, Jensen, Massao, Mendoza, Ngaga, Poulsen, Rueda, Sam, Skielboe, Stuart-Hill, Topp-Jorgensen and Yonten2009). Apart from their time, the actual cost to volunteers from SGW in Moreton Bay varied widely from zero, when local residents simply walked out onto their site, to a maximum of about AU$ 60 per survey, when volunteers travelled up to 60 km and used their own vehicle and vessel. If we assume SGW in Moreton Bay is technically monitoring the whole of the Bay (300 177 ha) then the cost to the management authority (c. AU$ 59 500 yr−1) equates to about AU$ 0.20 ha−1 yr−1 (= US$ 0.17 ha−1 yr−1), which is at the lower end of the range (US$ 0.06–3.60 ha−1 yr−1) cited by Danielsen et al. (Reference Danielsen, Burgess, Balmford, Donald, Funder, Jones, Alviola, Balete, Blomley, Brashares, Child, Enghoff, Fjeldsa, Holt, Hubertz, Jensen, Jensen, Massao, Mendoza, Ngaga, Poulsen, Rueda, Sam, Skielboe, Stuart-Hill, Topp-Jorgensen and Yonten2009). Apart from providing cost efficient monitoring, volunteers from SGW in Moreton Bay also regularly covered areas where management agencies visited rarely or not at all and allowed numerous sites to be surveyed simultaneously.
Danielsen et al. (Reference Danielsen, Burgess and Balmford2005a) expressed uncertainty as to the sustainability of community-based monitoring over the long term. However, there are several important factors associated with successful volunteer-based monitoring programmes that are also a large part of the success of SGW in Moreton Bay. These include: multi-organizational involvement (Firehock & West Reference Firehock and West1995; Sharpe & Conrad Reference Sharpe and Conrad2006); scientific expertise in data collection, analysis and interpretation (Gouveia et al. Reference Gouveia, Fonseca, Camara and Ferreira2004; Sharpe & Conrad Reference Sharpe and Conrad2006); a need to keep tasks simple, realistic, achievable and locally appropriate (Foster-Smith & Evans Reference Foster-Smith and Evans2003; Danielsen et al. Reference Danielsen, Burgess and Balmford2005a); and adequate dissemination of results to the volunteers themselves and the wider community (Sharpe & Conrad Reference Sharpe and Conrad2006). SGW in Moreton Bay has been steadily growing over the last seven years, with several volunteer teams remaining unchanged for this entire time. The programme engages government (SEQ [South-east Queensland] Catchments and the Queensland Department of Environment and Resource Management incorporating Queensland Parks and Wildlife Service), industry (Port of Brisbane Corporation and Tangalooma Wild Dolphin Resort), university (Griffith University and the University of Queensland), community groups (the Wildlife Preservation Society of Queensland and the Queensland Conservation Council) and schools (the Moreton Bay Environmental Education Centre among others). SGW methods were developed by scientists to be rigorous in design (McKenzie et al. Reference McKenzie, Lee Long, Coles and Roder2000, Reference McKenzie, Campbell and Roder2001) and, in Moreton Bay, qualified scientists were employed to assist with data collection, analysis and interpretation. SGW methods are also relatively simple and easy to use. After 6–9 hours of training, volunteers could produce reliable data. Although initial training was conducted with large groups of 10–30 people, in the classroom and/or in the field, individual teams of 2–4 people who went on to adopt a site were given additional training at their focal site. Both of these training practices were useful. The initial stage in large groups identified those individuals who were not really interested and the more personalized training in small groups was necessary to ensure a complete understanding of the survey methods. Although some volunteers travelled relatively large distances to be involved, most were local residents and felt a sense of ownership for their site. The data were freely available to the volunteers themselves, management agencies and other stakeholders via a website, regular newsletters and/or contacting the coordinators. The coordinators endeavoured to provide interesting avenues for related topics by organizing a seminar series on local wildlife and ecological processes involved with seagrass habitat. Another popular activity was night-time mudflat spotlighting expeditions, which had the additional benefit of increasing the general natural history skills of participants.
The data collected by volunteers in Moreton Bay have been used in the assessment of marine park permits. During the assessment of a permit application to carry out and film underwater explosions near Ormiston (ORM, Fig. 1) for the making of a movie, permit officers checked SGW data and found reference to an extensive network of dugong feeding trails that had been documented by the volunteers monitoring the nearby SGW site. The importance of the seagrass habitat to dugongs in that area had not been reported in recent times, and the SGW data provided sufficient justification to move the filming further away from the coast. SGW volunteers have also reported on the prevalence of a toxic cyanobacteria (Lyngbya majuscula), which has been recurring in Moreton Bay for at least the last decade.
CONCLUSIONS
Volunteers are more likely to maintain their enthusiasm over the long term if it is clear that the results of their efforts are useful (McKenzie et al. Reference McKenzie, Lee Long, Coles and Roder2000, Reference McKenzie, Campbell and Roder2001; Hill Reference Hill2002; Danielsen et al. Reference Danielsen, Jensen, Alviola, Balete, Mendoza, Tagtag, Custodio and Enghoff2005b). Environmental education is crucial for conservation (Bjorkland & Pringle Reference Bjorkland and Pringle2001), and the value that the present programme has added in terms of raising community awareness about issues affecting the Bay is equally as important as the data it has generated.
ACKNOWLEDGEMENTS
Seagrass-Watch in Moreton Bay is managed by the Wildlife Preservation Society of Queensland, Bayside Branch. Our thanks are extended to SEQ Catchments for the bulk of our funding and the Ecosystem Health Monitoring Program (coordinated by the Queensland Department of Environment and Resource Management), Port of Brisbane Corporation and Norman Wettenhall Foundation for additional funding. We appreciate the in-kind contributions generously provided by the Queensland Parks and Wildlife Service (Department of Environment and Resource Management) and the Tangalooma Wild Dolphin Resort, and the administrative support from the Queensland Conservation Council and Wildlife Preservation Society of Queensland. We are indebted to Seagrass-Watch Head Quarters (Fisheries Queensland, Northern Fisheries Centre, Cairns), particularly Len McKenzie and Rudi Yoshida, for development of the methods and ongoing support. Carla Catterall, John Kanowski, Len McKenzie and members of the Wildlife Ecology Discussion Group at Griffith University provided useful comments on the draft manuscript. Thanks also to the next generation of local coordinators: Nick Hoffmann (Moreton Bay) and Daniela Wilken-Jones (Gold Coast). This programme could not work without the multitude of volunteers who head out year after year, in all kinds of weather, to watch the seagrass grow; their efforts and enthusiasm are commendable.


