


1. Introduction
The Value of a Statistical Life (VSL) is a key input into cost–benefit evaluations of interventions that save lives. One such intervention at the intersection of environmental and development economics is the clearance of landmines and unexploded ordnance (UXO) from rural areas of developing countries. Global reported casualties from landmines and UXO are approximately 8,000 per year but informed estimates are up to 15,000–20,000, being highest in Iraq, Afghanistan and Cambodia. (ICBL, 2006).Footnote 1 Since 1992, the global community has spent over US$ 2.5 billion on humanitarian mine clearance and other mine action (e.g., fencing off suspected minefields and education programs), with annual spending peaking at US$ 400 million in 2004 (ICBL, 2006). In Cambodia, which is the setting for this paper, annual spending on humanitarian mine clearance is approximately US$ 25 million.
But many cost–benefit analyses (CBA) of landmine clearance find it socially inefficient. Harris (Reference Harris2000) estimates that spending to clear landmines from Cambodia produces benefits – from saved lives, reduced injuries and more farm output – worth just 2 per cent of the costs.Footnote 2 Elliot and Harris (Reference Elliot and Harris2001) estimate benefits in Mozambique worth only 10 per cent of costs. For Bosnia and Herzegovina, demining cannot be justified on development grounds (Mitchell, Reference Mitchell2004). Recent studies consider targeted clearance of areas needed for infrastructure and development projects, which better represents how mine clearance actually operates. In Cambodia, there appear to be positive benefit–cost ratios for targeted clearing of irrigation systems, water supplies, roads and bridges, school premises, health stations, but costs still generally exceed benefits for the clearance of agricultural land (Gildestad, Reference Gildestad2005). For Laos an internal rate of return greater than 12 per cent is found for the clearance of land for wet season rice cultivation and irrigated land (GICHD and UNDP, 2001).
Inadequate data may have biased CBA evaluations of landmine clearance since most studies value injuries and death as the present value of lost earnings (or lost GDP per capita).Footnote 3 Foregone earnings are not used in developed countries because they greatly underestimate the value of life (Rosen, Reference Rosen1988). Instead, VSL estimates are used, calculated either from reports by survey respondents of willingness to pay for reduced risk (or be paid to accept risk increases) or from market based, revealed preference studies.Footnote 4 These VSL estimates are typically up to 200 times GDP per capita in developed countries (Miller, Reference Miller2000). There are too few estimates from developing countries to know whether the same ratio holds. The theoretical superiority of VSL measures is noted in the landmine literature (e.g., Harris, Reference Harris2000) but with few estimates for landmine affected countries imperfect foregone earnings methods are used. Consequently, saved lives and limbs are only a small part of the calculated benefit of landmine clearance, whereas the value of statistical life is easily the largest benefit of environmental, health and safety rules in developed countries (Shogren and Stamland, Reference Shogren and Stamland2002).
Without reliable estimates of the VSL, any CBA evaluation of mine clearance is uncertain. One approach sometimes used in settings without VSL estimates is to base CBA calculations on VSLs transferred from elsewhere. More generally, this benefit-transfer approach is widely used to estimate values for environmental goods or human health for which on-site data on benefits are unavailable since it is an inexpensive approach (Loomis, Reference Loomis1992). To facilitate the approach, inventories of previous benefit value estimates are created which analysts can then choose to use (i.e., transfer) in their site that lacks its own data. In the context of VSL estimates, a VSL in one site can be used to predict a VSL somewhere else, based on differences in average incomes or wealth between the two places and an assumed elasticity of the VSL with respect to income (e.g., Aunan et al., Reference Aunan, Berntsen, O'Connor, Persson, Vennemo and Zhai2007). But it is not clear that this benefit-transfer approach gives reliable estimates since the VSL should also differ with levels of risk and awareness of the particular source of risk and these may not be considered when transferring VSL estimates from one site to another.
The present paper reports VSL estimates from using contingent valuation (CV) in rural Cambodia. With over 46 per cent of Cambodian villages still contaminated by landmines (CMAC, 2002), landmine removal is vital to economic progress in Cambodia. Direct removal efforts are slow relative to the size of the problem. In fact, a reliance on painstaking manual clearance methods has seen only 171 km2 cleared between 2000 and 2005, at a cost of almost US$ 1 million per km2 (US$ 10,000 per hectare), compared with an estimate from CMAC (2002) of 4,500 km2 suspected to be contaminated by landmines and UXO.Footnote 5
To illustrate the implications of the VSL estimates for CBA studies of mine clearance, we reconsider the study by Gildestad (Reference Gildestad2005) of targeted mine clearance in Cambodia. The VSL we estimate is approximately US$ 350,000, while Gildestad (Reference Gildestad2005) assumes a present value of just US$ 25,000 for foregone income and leisure, so this change has a major impact on the CBA calculations. In particular, use of our more plausible VSL measure increases the importance of human benefits relative to production benefits in assessing targeted clearance and is decisive in making judgements about the economic value of clearing agricultural land. Also, the estimated VSL is substantially higher than what would be predicted based on the benefit transfer approach, even when transferring from a methodologically similar study in a neighbouring country, which suggests the need for site-specific surveys when forming VSLs.
The outline of this paper is as follows. Section 2 reviews some previous estimates of value of lives saved in studies of the benefits of mine clearance. The methodology used in the survey, to measure the VSL, is described in section 3. The results of the survey are reported in section 4. In section 5 the cost–benefit study of Gildestad (Reference Gildestad2005) is reconsidered using our VSL estimates. Section 6 concludes the paper.
2. Previous valuations of the life saving benefits of landmine clearance
Table 1 summarises the ways in which lives saved as the result of landmine clearance have been valued in several previous studies. These studies treat the benefit resulting from the saving of lives as the present value of lifetime income (or GDP) foregone. But income foregone has long been recognised as inadequate for assessing the value of statistical lives saved (Rosen, Reference Rosen1988). Using that method no value is placed on life itself, the trauma of death, or the psychological effect of living in fear of premature death resulting from a particular risk.Footnote 6 Perhaps because of this, the value of lives saved represents only a small proportion of the estimated benefits in existing studies of mine clearance.
Table 1. Value of lives saved in previous economic evaluations of landmine clearance

Notes: All present values are calculated at 10 per cent discount rate. PV is present value.
a Based on a 40 year working life. Values in US$.
b Benefits are discounted but costs are not, so the reported NPV is not valid.
c In her own calculations, Mitchell uses a 5 per cent discount rate, giving a lifetime PV of US$ 35,400.
d This is an approximate value, Gildestad calculates a value for both adults and children.
e Section 6 has more details on the benefit–cost ratios from this study.
A large literature uses CV or revealed preference methods to estimate the VSL in developed countries’ risks.Footnote 7 Miller (Reference Miller2000) uses 68 studies, 38 from outside the United States, to study the relationship between the VSL and income. The VSLs are significantly higher than estimates based on the present value of lifetime income foregone. For developed countries as a whole VSL estimates are between 137 and 195 times GDP per capita or 14–20 times larger than the present value of lifetime GDP per capita for a 40 year working life and 10 per cent discount rate. The ratio of VSL measures to lifetime income may be even higher for developing economies. For example, VSL estimates for air pollution and traffic accident risk in Bangkok are US$ 1.3–1.5 million, giving a ratio to lifetime earnings of about 60:1 (Vassanadumrongdee and Matsuoka, Reference Vassanadumrongdee and Matsuoka2005). The ratio of the VSL to lifetime earnings in the landmines study by Gibson et al. (Reference Gibson, Barns, Cameron, Lim, Scrimgeour and Tressler2007 in rural Thailand is approximately 40:1. Even higher VSL estimates, of up to US$ 3.1 million, come from compensating wage differentials for fatalities in India's manufacturing sector, with a ratio to lifetime earnings of over 400:1 (Shanmugam, Reference Shanmugam2001). Hence, CBA evaluations of landmine clearance may have substantially understated the benefits by using lifetime income as a proxy for the VSL.
3. The survey
3.1. Outline of the approach
A CV survey was carried out by the authors in Kampong Speu and Siem Reap provinces of Cambodia in November 2004, with the assistance of the Red Cross and a team of local interviewers. This survey was a significant extension of the approach used in an earlier survey in rural Northeast Thailand (Gibson et al., Reference Gibson, Barns, Cameron, Lim, Scrimgeour and Tressler2007). In contrast with that earlier work, the two provinces surveyed here have considerable landmine and UXO contamination. According to survey estimates from CMAC (2002), these two provinces rank 6th and 18th (of 24) in terms of landmine and UXO casualties in Cambodia, with casualty rates of 3.3 and 0.3 per 10,000 of population (the national average is 1.7 per 10,000).
The survey used two series of questions to determine trade-offs, first between the risk of death resulting from landmine accidents and income, i.e., a ‘risk-money’ trade-off and then between the risk of injury from a landmine accident and the risk of death, i.e., a ‘risk-risk’ trade-off. Specifically, we asked respondents to state their preferences for two different areas in which their village might be located, differing in both the risk of death and cash income. The income that was adjusted was for the area with the higher risk of death, so this can be considered a ‘willingness to accept’ format.Footnote 8 In determining risk-money trade-offs, the respondents were not directly asked about their willingness to pay for a reduction in risk or the amount they required to accept an increase in risk. Hence we can avoid issues associated with who will or should pay, how payments will be made and exactly what the payments are for. These would be important questions for the low-income communities included in this survey. The statement of alternatives also made clear the precise nature of the change in risk to be considered. This is important because it is likely that in communities with significant experience with landmine problems, risk comparisons may be influenced by actual perceptions of landmine accident risk.
A large literature notes that VSL estimates based on CV methods are sensitive to the nature of the risks considered, the way the risks are presented, the size of the risk change and many other factors (Beattie et al., Reference Beattie, Covey, Dolan, Hopkins, Jones-Lee, Loomes, Pidgeon, Robinson and Spencer1998). In low-income rural communities these factors may be even more significant.Footnote 9 Therefore, to aid interpretation, the risks in this study were presented in terms of the frequency of occurrence of an event, e.g., a change in the risk of death from 2 per year in a commune of 10,000 to 4 per year. Also, several questions were used to aid and check the comprehension of respondents. Initially they were given show-cards illustrating risks of 2 in 10,000 and 6 in 10,000 and were asked to choose the commune with the lower risk. They were then shown cards with risks of 2 in 10,000 and 2 in 20,000 and asked to choose the commune with the lower risk. If they failed either of these tasks the interpretation of the show cards was explained again. As a final check of comprehension they were asked to choose between areas in which one area was dominant, since it had both a higher cash income level and a lower probability of death. If a respondent failed to select the dominant area, the nature of the risk and the selection task was explained again. The interview was terminated if the respondent failed on a second attempt.Footnote 10
Respondents were also asked about their awareness of landmine-affected areas and familiarity with those injured or killed by landmines, which may influence preferences, and thus the VSL estimates. Demographic variables and wealth indicators were also collected from each respondent and these allow comparison with a national survey with the same indicators, so that the results can be non-parametrically reweighted to reflect all of rural Cambodia rather than just the two provinces where the survey was fielded (see appendix).
3.2. Risk-money trade-offs
The first set of questions was designed to determine for each respondent the difference in income that would make them indifferent between two areas (labelled Commune A and Commune B) given a specified difference in the risk of death from a landmine accident. Let Ia and Ib be the cash income levels and Xa and Xb the probabilities of death in Communes A and B respectively. Then following Viscusi et al. (Reference Viscusi, Magat and Huber1991), if the utility function of the individual is additively separable in health status and income, and the marginal utility of income is constant for the range of incomes considered, the value of statistical life is given by
For example, if I a = R1,460,000, Ib = R1,660,000, Xa = 0.0002 and Xb = 0.0004, then L = R1,000,000,000 (where R is the currency unit, Cambodian Riel).Footnote 12
To determine the income difference at which the respondent is indifferent between each commune for a given change in the risk of death, an initial alternative was presented and then adjusted given the area chosen. Initial alternatives were selected after a pre-test in several villages in Kampong Speu province. Such pre-testing reduces the likelihood of starting point bias and minimises the number of iterations required to establish indifference.
The initial alternatives used in the final survey were

If Commune B was selected as the preferred commune, the additional cash income in Commune B was revised down by R50,000 and the respondent was asked to reconsider the alternatives. This process was continued for up to four iterations until preference switched to Commune A or the additional cash income in Commune B reached zero. Any switch in preference provides a range within which the income level that would make the respondent indifferent between the two communes should lie. The respondent was then asked what level of additional cash income in Commune B would make the two communes equally desirable. If this value was inconsistent with the range of incomes implied by the preference switch, then interviewers prompted the respondent for a suitable response. If the respondent still gave an inconsistent value, then this survey response was disregarded. This process provided an additional consistency check. If Commune A was selected given the initial alternatives, the additional cash income in Commune B was revised upward by R50,000 for up to four iterations until either Commune B was selected or the level of additional cash income reached R400,000. Again, the respondent was asked for the value of additional cash income in Commune B that would make the two communes equally desirable.
3.3. Risk-risk trade-offs
A second set of questions was designed to determine the willingness of respondents to trade-off increases in the risk of injury from a landmine accident for a decrease in the risk of death from a landmine accident. Landmine accidents cause a variety of injuries with the loss of a leg, either above or below the knee being the most common serious injury sustained.Footnote 13 In this survey the respondents were asked to treat all injuries as involving a loss of a leg below the knee. Clearly, different injuries would generally be associated with different trade-offs.
As for the risk-money trade-offs, respondents were asked for their preference between two communes to determine the risk combination that would make them indifferent between Commune A and Commune B, assuming all other aspects of the communes are identical. Let Xa and Ya be the annual probabilities of death and injury in Commune A and Xb and Yb be the probabilities in Commune B. The trade-off between injury and death is given by
It follows that the implicit value of statistical injury is L/t. For example, if Ya = 0.002 and Xa = 0.0002 in Commune A while Yb = 0.0012 and Xb = 0.0004 in Commune B then indifference between the areas implies an injury-death trade-off of 4.0. Thus, in this example the implicit value of statistical injury would be R250,000,000.
The procedure used to determine the risk-risk alternatives that made the respondent indifferent between communes was similar to the procedure used for risk-money trade-offs. The initial alternatives were
If Commune A was chosen, the number of injuries per 10,000 people in Commune B was revised down by two. The process was repeated until preference switched or there were zero injuries.Footnote 15 The respondent was then asked what number of injuries per 10,000 people would make the two communes equally desirable. As with risk-money trade-offs, this question provided a consistency check. If, given the initial alternatives, Commune B was chosen, the number of injuries per 10,000 people in Commune B was revised up by two and the process repeated until preference switched or the number of injuries reached twenty per 10,000.
3.4. Application of the survey and sample characteristics
An experienced team of Cambodian interviewers were recruited to ensure that interpretations and language in the survey were consistent with those in use in the survey area. The villages in the survey were selected from the national Cambodian Socio-Economic Survey (CSES) sample so that we could re-weight to obtain nationally representative VSL estimates. Seven villages were selected from Kampong Speu province, and ten villages from Siem Reap province. Of these villages, two from Kampong Speu were used in pre-testing and did not form part of the final sample. Participation in the survey was voluntary, but the refusal rate was zero. Dropping the respondents who failed the dominance or consistency checks left a sample of 440 responses.
A wealth index was calculated from survey responses about the ownership of durable goods and dwelling attributes, following the principal components method of Filmer and Pritchett (Reference Filmer and Pritchett2001). Figure 1 compares the distribution of the wealth index from the VSL survey and the rural component of the national CSES. Respondents in the VSL survey have higher wealth so unweighted statistics calculated from the VSL survey may not be representative of rural Cambodia. Instead we derive a set of weights from a semi-parametric procedure designed to counter-factually shift the density for the VSL survey to mimic the density for the CSES (see appendix). All statistics from the VSL survey are reported below, both with and without these weights being applied. The main impact of the weights is to reduce the value of the calculated VSL, which is consistent with the fact that the rural households in the national survey have somewhat lower wealth than those in the VSL survey.

Figure 1. Distribution of wealth index from VSL and national CSES samples
Table 2 provides a summary of the sample characteristics and consistency checks for responses from the survey. A comparison is made with sample characteristics from an earlier Thai study (Gibson et al., Reference Gibson, Barns, Cameron, Lim, Scrimgeour and Tressler2007), whose VSL estimates will be transferred to Cambodia and compared with the directly estimated VSL. Over half of respondents from Cambodia had experience caring for someone injured by a mine, compared with none in Thailand. These differences in personal experience of the risk may compromise benefit transfer estimates, which typically are based just on income differences between the site of interest and the site with an available VSL estimate.
Table 2. Descriptive statistics for VSL surveys in rural Cambodia and rural Thailand

Notes: The results for Cambodia are for the survey described in the current paper, while those for Thailand are for the ‘willingness to accept’ sub-sample of the survey described by Gibson et al. (Reference Gibson, Barns, Cameron, Lim, Scrimgeour and Tressler2007).
4. Results
4.1. Risk-money trade-offs and the VSL estimates
To simplify comparisons with other studies all VSL estimates are converted to US$ using the exchange rate prevailing during the survey.Footnote 16 The survey responses suggest that the mean VSL is approximately US$ 446,000 when unweighted and US$ 423,000 when weighted to be representative of all rural Cambodia (table 3). The 95 per cent confidence interval around the weighted mean is US$ 353,097–491,620. The medians are lower for both the unweighted and weighted estimates, at US$ 422,000 and US$ 357,000.
Table 3. VSL estimates
Note: N = 440. Standard errors in parentheses corrected for clustering, stratification and weighting where relevant. The standard error of the median comes from an intercept-only quantile regression with 100 cluster bootstrapped replications.
The VSL estimates for each respondent are obtained by applying equation (1) in the text to the values generated from the survey.
How does this estimate compare with the foregone income approach that has been used previously in CBA evaluations of landmine clearance in Cambodia? The average per capita income in Cambodia as a whole in 2004 was approximately US$ 270. Given the high share of the population in rural areas, the rural mean will be similar to this overall estimate.Footnote 17 Thus, for a 40 year working life and a discount rate of 10 per cent the present value of foregone lifetime income would equal US$ 2,640, giving a ratio of the weighted median VSL to the present value of lifetime earnings around 135:1. Consequently, the use of these two different types of estimates is likely to make a big difference to CBA evaluations of landmine clearance (see section 5).
There is a positive skew in the distribution of VSL estimates, which is indicated by the means being above the medians. This is confirmed in figure 2 which uses smoothed densities to show the underlying distribution of both the unweighted and the weighted responses.Footnote 18 In light of this skewness the median will better measure central tendency than the mean. Hence we use the weighted median of US$ 357,087 as the best point estimate of the VSL for rural Cambodia when the risk considered is death from landmines or UXO.
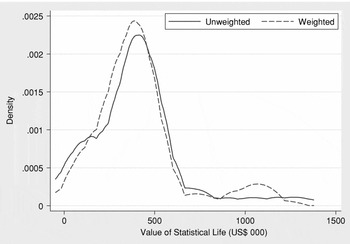
Figure 2. Smoothed densities for the value of statistical life estimates
The weighted median for Cambodia is over US$ 50,000 higher than the median VSL estimated from an earlier study of landmines in rural Thailand (Gibson et al., Reference Gibson, Barns, Cameron, Lim, Scrimgeour and Tressler2007).Footnote 19 This is surprising when it is considered that rural Cambodia has much lower per capita income than rural Thailand. To see how much of this difference is explained by differences between the two samples in characteristics such as personal experience of landmines, a regression decomposition is conducted where the difference in average characteristics, (XC − XT), is weighted by a parameter vector β* from a pooled sample regression (Neumark, Reference Neumark1988). The mean (or equivalently, median) gap can then be expressed as:
The last term in equation (3) reflects the part of the gap in VSL estimates explained by differences in average characteristics. The first two terms reflect unexplained differences due to unequal coefficient vectors estimated on the Cambodia sample, β c and the Thai sample, β T.
In the regression estimates reported in table 4 the wealth indicator is relative to the mean in each country, so as to not capture differences in average income levels, since the purpose of the regressions is to see how much of the gap is due to factors other than income differences. This variable suggests that the relatively wealthy have a higher VSL and risk factors and experience also affect the reported VSL, with higher VSLs for those who know landmine victims and those who rely primarily on firewood (which has to be collected from the forest, where many landmine accidents occur), and lower VSLs for those who have lived in an affected village.
Table 4. Regression decomposition of the difference in VSL estimates between samples in rural Cambodia and rural Thailand

Notes: The dependent variable is the estimated VSL for each respondent, in thousands of US dollars.
a significant at 10 percent; b significant at 5 percent; c significant at 1 per cent.
Combining the regression coefficients with the means of the characteristics in table 2 and applying equation (3), it appears that almost one-half of the higher VSL reported from the Cambodia sample is due to characteristics other than income. The main contributing factors are higher risk due to greater reliance on firewood in Cambodia, the greater knowledge of landmine victims, greater knowledge of and residence in affected villages, and differences in household size between the two samples. Hence, simple benefit transfer approaches may ignore many relevant factors and lead to a predicted (i.e., transferred) VSL that is quite different to a directly estimated VSL from a site-specific survey.
4.2. Injury risk – death risk trade-offs
Table 5 reports summary statistics for the trade-offs between the risk of injury from a landmine accident and the risk of death. As noted above, injury here refers to an accident resulting in the amputation of a leg below the knee. According to the indifference estimates provided by the survey respondents, the median trade-off is 5.0 injuries per death while the (weighted) mean trade-off is 5.5 injuries per death. These are comparable to the earlier study from Thailand where the median was 6.0 and the mean 5.1 (Gibson et al., Reference Gibson, Barns, Cameron, Lim, Scrimgeour and Tressler2007).
Table 5. Injury risk – death risk trade-off ratio and implied value of a statistical injury

Note: N = 432. Standard errors in parentheses corrected for clustering, stratification and weighting where relevant. The standard error of the median comes from an intercept-only quantile regression with 100 cluster bootstrapped replications. Monetary values are in US$.
The implied value of a statistical injury is obtained by combining the injury-death trade-offs with the VSL estimates. The median value of a statistical injury is US$ 71,417 and the (weighted) mean is US$ 108,723. This median value of statistical injury and the median VSL of US$ 357,087 are the key inputs into a CBA of landmine clearance in Cambodia, which is reported in the next section.
5. VSL estimates and cost–benefit studies of mine clearing
The significance of the landmine/UXO problem in Cambodia has made it an important case in research on the benefits and costs of mine clearance. This research has been controversial. While Harris (Reference Harris2000) suggests that the benefits of clearance are only 2 per cent of the costs, Gildestad (Reference Gildestad2005) finds overall benefits of a targeted demining programme 38 per cent higher than costs.Footnote 20 Here we replicate the work of Gildestad using the VSL and injury-death trade-off estimates obtained in this paper. This clearly shows the importance of VSL estimates both in assessing mine clearance and setting priorities for demining programmes.
Gildestad (Reference Gildestad2005) estimates the costs and benefits resulting from the clearance of one km2 of high priority contaminated land for a variety of uses across the principal mine affected provinces in Cambodia. Two demining cost figures are used based on the costs of existing mine clearance programmes, US$ 0.70/m2 and US$ 0.90/m2. Benefits from clearance include human benefits, the value of casualties and medical costs saved, revenue from new production or tourism and travel costs saved.
To estimate human benefits Gildestad assumed casualties decline in proportion to the area of land cleared, down to 10 per cent of the current rates.Footnote 21 Reduced casualties are assumed to occur in each year of the 20 year time horizon used for the study. The value of casualties is based on the productive value of victims assuming a present adult income of US$ 1,000, with an additional amount of US$ 1,000 for the value of leisure. Adult productive income is assumed to grow at 3.5 per cent per annum for 10 years and 2.5 per cent thereafter. Adults work for 35 years and children are treated as having 5 unproductive years followed by 40 years of work. For fatalities, full productive value is lost; for amputees, it is assumed that 70 per cent of productive value is lost; while for other injuries, 40 per cent of productive value is lost.
The method used by Gildestad (Reference Gildestad2005) to value the human benefits of mine clearing does not explicitly include a VSL estimate.Footnote 22 To show the impact of VSL estimates we follow the approach used above and assume that the full value of a life saved is included as a benefit in the year the life is saved. The VSL is assumed to be US$ 357,087.
Gildestad distinguishes between adults and children in calculating the human benefits of clearance. In his model an adult life saved in the first year would have a present value of approximately US$ 25,000 compared with a value of US$ 21,000 for a child's life saved. In applying our VSL estimates we have ignored possible differences between adult and child VSL measures. VSLs can also be expected to change over time as real incomes increase. Miller (Reference Miller2000) suggests income elasticities in the range of 0.85–1.0, while Viscusi and Aldy (Reference Viscusi and Aldy2003) report elasticities of 0.5–0.6. We apply the growth assumptions used by Gildestad (Reference Gildestad2005) and an income elasticity of 0.5 to revise the VSL estimates for lives saved in the future.Footnote 23 The median injury risk-death risk trade-off of 5.0 is used to estimate the value of reductions in amputations. Following Gildestad (Reference Gildestad2005), we assume that value of reductions in other injuries is 57 per cent of the value of an amputation saved.
Table 6 compares the results obtained for the clearance of agricultural land by province obtained by Gildestad (Reference Gildestad2005) given a clearance cost of US$ 0.90/m2 with the equivalent calculations based on our VSL estimates. For all but Pailin province the estimates obtained by Gildestad (Reference Gildestad2005) suggest that the clearance of agricultural land is uneconomic.Footnote 24 Given the VSL values estimated in this paper, clearing agricultural land would be economic in all provinces except Pursat and Siem Reap. Thus, for agricultural land the VSL measure used is likely to be decisive in making judgments about the economic value of clearance.
Table 6. Benefits and costs for the clearance of agricultural land in Cambodia by province based on Gildestad (Reference Gildestad2005)a

Notes:
aOriginal calculations are by Gildestad (Reference Gildestad2005) and assume a cost of clearance is US$ 0.90 m2.
b Growth in the VSL is based on an income elasticity of 0.5. With no growth the Raw Average is 79 per cent, and for an income elasticity of 1.0 it is 83 per cent.
cGrowth in the VSL is based on an income elasticity of 0.5. With no growth the Raw Average is 1.09, and Pursat and Siem Reap would remain uneconomic. For an income elasticity of 1.0 the Raw Average is 1.53.
dAverage/Others is over all provinces.
eRaw Average is the unweighted average across provinces.
For other types of land use considered by Gildestad (Reference Gildestad2005) the value of productive benefits are much larger, dominating cost–benefit calculations. The inclusion of VSL measures acts to increase the importance of human benefits and the magnitude of the net benefit–cost ratio. Table 7 compares Gildestad's results for land use types with those obtained based on our VSL estimates. The VSL estimated in this paper suggests that targeted clearance for all land use types is economic, and in the case of the net benefits of clearing irrigation systems is over six times cost.
Table 7. Benefits and cost of clearance by type of area cleared – averages across provinces

Notes: See table 6.
aGrowth in the VSL is based on an income elasticity of 0.5. With no growth the average across land types is 46 per cent and 50 per cent for an income elasticity of 1.0, compared with an average of 48 per cent for an elasticity of 0.5.
bGrowth in the VSL is based on an income elasticity of 0.5. With no growth in the VSL all land types would still show a positive net benefit.
cHistorical Sites results are based on 100 per cent of area cleared. Figures shown for Gildestad (Reference Gildestad2005) correct an error in the draft.
dHealth Stations results are based on 15 clients per day.
6. Conclusion
Reliable estimates of the value of the trade-off between risk reduction and income generation are necessary to evaluate many interventions that save lives. In the context of developing countries, the desirability of demining in particular locations and the extent of mine clearance that is optimal depends crucially on the VSL. Using a survey in rural Cambodia we estimated the VSL at approximately US$ 357,000. This estimate is an order of magnitude higher than previous proxies for the VSL, such as the present value of lost income, that have been used in the literature on landmine clearance.
The importance of VSL estimates in judging the desirability of landmine clearance has been demonstrated by reworking an important study of the economics of mine clearance in Cambodia. Whereas Gildestad (Reference Gildestad2005) shows that mine clearance of agricultural land is generally uneconomic, our work shows that in all but two provinces, benefits exceed costs when our estimated VSL is used. Moreover, the targeted clearance of all land types is economic. Recent studies lend support to this view. Bottomley (Reference Bottomley2007) highlights the halving of landmine/UXO casualties since 2006, with improved agricultural and economic opportunities, including construction work, as major contributors to safer livelihoods. The landmine/UXO simulation model by Lim and Saw (Reference Lim and Saw2007) shows how targeted clearing of landmines/UXO from transport routes helps to link contaminated villages with previously inaccessible markets, including labour markets. Access to safer, manufacturing jobs serves as a partial substitute for complete landmine removal in the village.
Additionally, our results cast some doubt on the method of benefit transfer, where VSL estimates are taken from one site and applied in another site where no survey evidence is available. The VSL directly estimated from survey respondents in Cambodia differs substantially from the VSL that would be predicted, by transferring estimates from a study based on the same method in a neighbouring country. Some of the gap is due to different first-hand experience of the risk between the sample where the VSL estimate is transferred in from, and the sample in the setting of interest. Therefore, there may be no substitute for forming site-specific VSL estimates in developing countries, at least in the context of the risk from landmines and UXO.
Appendix: The wealth index and reweighting
The survey was conducted in only two provinces in Cambodia but landmine and UXO contamination affects most rural areas in Cambodia. To reweight results to reflect conditions in other parts of rural Cambodia we use a larger national-level survey, the Cambodia Socio-Economic Survey (CSES) in 1999. A wealth index formed from household's dwelling characteristics and ownership of physical assets was used as an alternative to either total household income or total household expenditure because: (a) the VSL survey did not collect detailed income or expenditure information that was compatible with the methods used to collect income and expenditure in the CSES, and (b) there are major discrepancies between the two rounds of the CSES survey for the income and expenditure estimates but the information on dwelling characteristics and assets appears to be consistent between the two rounds.
To aggregate the information on dwelling facilities and assets into a single index, the first principal component was used, following Filmer and Pritchett (Reference Filmer and Pritchett2001) who show that in settings where household expenditure data is unavailable this principal component produces a similar ranking in explaining wealth-dependent outcomes. The components of the wealth index are listed in table A1, along with the weights in the index. The mean value of each of the indicator variables is displayed for the bottom (poorest) and top (richest) quintiles obtained from the wealth index, as are the means from the two surveys. It is apparent that the wealthier quintiles score more highly for characteristics with a positive scoring factor (e.g., floor area, ownership of a TV) while the poorer households score more highly for characteristics with a negative score (e.g., having a thatched roof on their dwelling). There are also several differences between the means for the two surveys in terms of dwelling facilities and ownership of durables such as a TV or motor scooter and these are assumed to reflect wealth differences between the two samples.
Table A1. Characteristics of the constructed household wealth index

Note: Each variable other than floor area takes the value of 1 if true, 0 otherwise. The proportion of the covariance explained by the first principal component is 21 per cent. The value of the first eigenvalue is 3.32 and the second eigenvalue is 1.66.
A set of weights that can adjust results for the wealth differences between the two samples (and also reweight the VSL summary statistics to reflect conditions in overall rural Cambodia, at least as captured by the national-level CSES) are calculated by adapting a procedure developed by DiNardo et al. (Reference DiNardo, Fortin and Lemieux1996). This procedure reweights the overall distribution rather than just the mean and notes that the observed density of the wealth index for an observation from the VSL survey (CSES = 0) with characteristics x is
The counterfactual density if observations from the VSL survey were given the characteristics of the national-level CSES is

which is based on a reweighting factor, ψ(x):
The first part of this reweighting factor is just the ratio of number of observations from the VSL survey to number of observations from the CSES survey in the pooled database. To calculate the second part of this reweighting factor, which is the ratio of two conditional probabilities, a logit regression is estimated, with survey type (CSES or VSL) as the dependent variable and explanatory variables from the components of the wealth index. The results for this regression are reported in table A2.
Table A2. Results of logit regression for survey type (CSES = 1)

The reweighting factor ψ(x) is used to calculate weighted summary statistics from the VSL survey which should reflect the distribution of the household wealth index in the national level CSES survey rather than the distribution in the more localised VSL survey.


