


1. Introduction
Worldwide about 70 million people are exposed to floods, and more will be in the future when climate changes and populations grow (UNISDR, 2011). Major investments in flood risk management (FRM) are needed which, in light of limited financial resources, often need to be justified on the basis of expected flood risk reduction benefits – an evaluation procedure called cost-benefit analysis (CBA).
Most of the traditional ‘flood’ CBAs focus narrowly on avoided asset damages, and do not adequately account for the interests of the poor, who own few assets (e.g., Cutter et al., Reference Cutter, Emrich, Morath and Dunning2013; Mechler et al., Reference Mechler, Czajkowski, Kunreuther, Michel-Kerjan, Botzen, Keating, McQuistan, Cooper and O'Donnell2014). Poor people compose a relatively large share of the population exposed to floods, and are often more vulnerable, especially in developing countries (e.g., Winsemius et al., Reference Winsemius, Jongman, Veldkamp, Hallegatte, Bangalore and Ward2018). Focusing on avoiding asset damages will steer investments in flood risk reduction to areas with people who are already relatively better off (e.g., Ward et al., Reference Ward, Jongman, Aerts, Bates, Botzen, Diaz Loaiza, Hallegatte, Kind, Kwadijk, Scussolini and Winsemius2017), leaving the poor exposed.
Such CBAs lead to dissatisfaction and questions about the fairness and social justice of FRM policies and programs (e.g., Cutter et al., Reference Cutter, Emrich, Morath and Dunning2013; Peduzzi, Reference Peduzzi2017; Doorn et al., Reference Doorn, Gardoni and Murphy2018; Sayers et al., Reference Sayers, Penning-Rowsell and Horritt2018). They do not pay much – or any – attention to other types of flood damages for humans (e.g., income loss and health impacts) which may be substantial (see, e.g., The H. John Heinz III Center for Science, Economics and the Environment, 2000). Nor do they consider how flood damage is distributed over people with different incomes, and the capacities of those people to cope with, and recover from, floods. A damage of US$1,000 for one person is thus weighted equally with a damage of US$1 each for a thousand persons, and a damage of US$500 for a person who earns US$1,000 annually is equally weighted with that for a person who earns US$100,000. These CBAs do not consider ‘social vulnerability’ and ‘socioeconomic resilience’ (Cutter et al., Reference Cutter, Emrich, Morath and Dunning2013; Hallegatte et al., Reference Hallegatte, Bangalore and Vogt-Schilb2016) of individuals, communities and societies. They are also at odds with the ambition of many governments to mainstream policies for disaster risk reduction (DRR) and climate change adaptation, with social policies aiming at the provision of safety nets, income distribution and poverty reduction (e.g., Stokkel, Reference Stokkel2015). And – importantly for our paper – those CBAs are inconsistent with social welfare economics, which is the scientific and ethical foundation of CBAs supporting public investments decisions, such as those in FRM (e.g., Kind et al., Reference Kind, Botzen and Aerts2017).
In Kind et al. (Reference Kind, Botzen and Aerts2017) we discussed how to improve CBAs that focus on DRR. We reviewed CBA handbooks (e.g., Squire and van der Tak, Reference Squire and van der Tak1992; Adler and Posner, Reference Adler and Posner2006; Zerbe and Bellas, Reference Zerbe and Bellas2006; Boardman et al., Reference Boardman, Greenberg, Vining and Weimer2014) and guidelines (e.g., Pearce et al., Reference Pearce, Atkinson and Mourato2006; HM Treasury, 2011; European Commission, 2014) and discussed challenges and application of CBAs for DRR and FRM (e.g., Hallegatte, Reference Hallegatte2006; Frontier Economics, 2013; Kaufman, Reference Kaufman2014; Mechler et al., Reference Mechler, Czajkowski, Kunreuther, Michel-Kerjan, Botzen, Keating, McQuistan, Cooper and O'Donnell2014). In particular, we provided the theory and an example of how ‘social welfare CBAs’ take social vulnerability and income inequality into account, by valuing the same amount of financial damage higher for poor and more vulnerable people, than for non-poor and less vulnerable people. In a hypothetical case study, we illustrated the importance: it led to different recommendations on what to do and whom to target, compared to traditional flood CBAs. Implementing social welfare CBAs in practice, however, requires additional data on, amongst others, how income and damage is distributed over populations; this data is hard to collect, generate and analyze. To the best of our knowledge, social welfare CBAs have never been used to evaluate FRM investments. The closest is the national assessment of socioeconomic flood resiliency for 90 countries by Hallegatte et al. (Reference Hallegatte, Bangalore and Vogt-Schilb2016). In the context of climate mitigation policies, however, social welfare CBAs are more common (e.g., Tol, Reference Tol2014).
The objective of this paper is to contribute to improving the understanding and application of CBAs for DRR and FRM by showing how social vulnerability and resilience can be integrated into flood risk assessments and CBAs. We also discuss what additional data is needed, whether this data is available and hence if this approach is practicable. Finally, we discuss limitations of the approach and give general suggestions on how to improve the social welfare of flood-affected people. We do not discuss other possible improvements of traditional CBAs, such as the inclusion of intangibles and indirect effects.
1.1 Types of cost-benefit analyses
Standard economic literature distinguishes between three types of CBAs. Financial CBAs (FCBAs) take the perspective of project owners and consider only financial revenues and costs. This is unsuitable to justify public expenditures on FRM, since most benefits are not in the form of financial revenues. Applied to decisions of households to invest in FRM measures, FCBAs compare the costs of measures with the reductions in expected financial damages. Economic CBAs (ECBAs) consider projects from the perspective of societies. Costs and benefits are valued in terms of willingness-to-pay or willingness-to-accept, i.e., how much consumption society is willing to exchange for the inputs and outputs of the projects. ECBAs focus on individual wellbeing measured by utility and incorporate indirect and intangible costs and benefits. Social CBAs (SCBAs) are different from ECBAs since wellbeing gains and losses for different groups or individuals are given different weights, as specified by the social welfare function, to derive the aggregate social welfare value.
In this paper, we use ‘traditional flood CBAs’ to refer to flood CBAs as they are most commonly practiced (Mechler et al., Reference Mechler, Czajkowski, Kunreuther, Michel-Kerjan, Botzen, Keating, McQuistan, Cooper and O'Donnell2014; Kind et al., Reference Kind, Botzen and Aerts2017). These cannot be classified as FCBAs, ECBAs or SCBAs: risk reduction benefits are based on expected financial damage reductions for the entire population, which are not converted into wellbeing or social welfare losses. We use ‘social welfare CBAs’ to refer to ECBAs. We prefer the term ‘social welfare CBA’ because it is often misunderstood that, in ECBAs, costs and benefits should be valued in terms of social welfare, which means that higher values are assigned to financial flood risk reduction benefits for the poor and vulnerable population, without turning this into an (often considered controversial) SCBA, which requires a second set of weights (see Kind et al., Reference Kind, Botzen and Aerts2017). ‘Traditional flood risk assessments’ refer to flood risk assessments in support of traditional CBAs, while ‘socioeconomic flood risk assessments’ refer to flood risk assessments in support of social welfare CBAs.
2. A social welfare economics framework for vulnerability and resilience
Vulnerability and resilience are studied by different disciplines, for different purposes and at different levels, and hence the literature describes different models and definitions for these two. For overviews, see Wisner (Reference Wisner2013), Zakour and Gillespie (Reference Zakour and Gillespie2013) and Rose (Reference Rose2017). Our model and definitions are rooted in social welfare, which is the focal point of ECBAs. Social welfare is based on the wellbeing of all individuals in society. Integrating vulnerability and resilience into social welfare CBAs therefore requires first that the impact of floods on the wellbeing of all individuals be considered, after which it can be aggregated. Figure 1 presents our framework for socioeconomic flood risk assessments, which encompasses the traditional flood risk assessment framework.
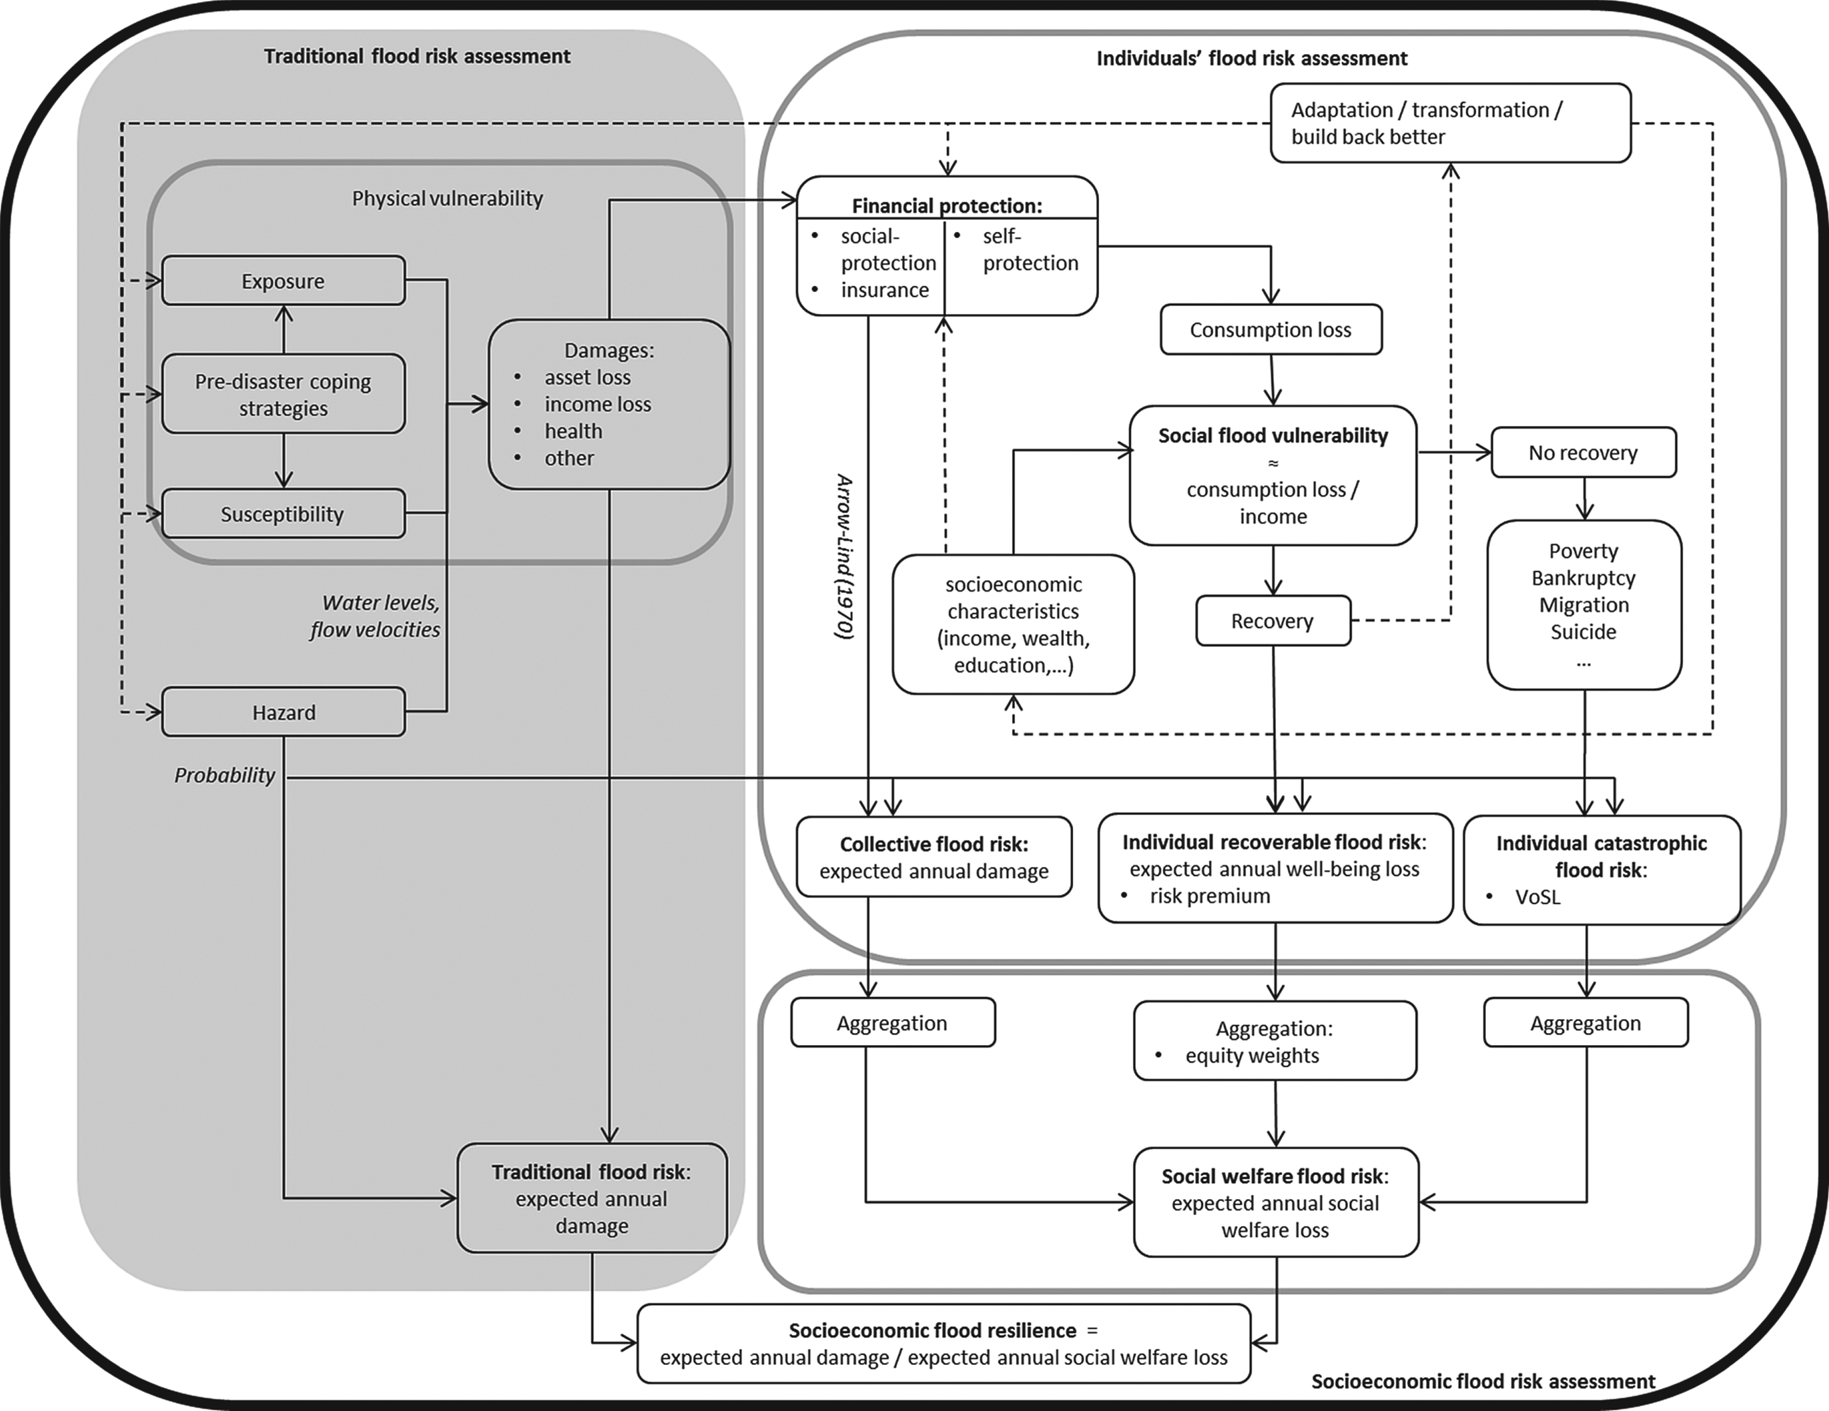
Figure 1. Conceptual framework for socioeconomic flood risk assessments, inspired by Hallegatte et al. (Reference Hallegatte, Bangalore and Vogt-Schilb2016). Dashed lines indicate elements which are not quantified in this paper.
Traditional flood risk assessments (left part of figure 1) focus on total flood risk for an area. Physical vulnerability – the damage caused by floods – is a function of exposure (e.g., the assets in an area), susceptibility (e.g., the damageability of assets due to contact with water), and coping strategies to reduce or mitigate damage (e.g., moving furniture upstairs). In combination with flood probabilities, flood risk – expressed as expected annual damage (EAD) – is calculated.
Socioeconomic flood risk assessments (right part of figure 1) also consider the impacts of floods on the wellbeing of individuals. In the context of natural disasters, we assume that wellbeing is only derived from consumption: the relationship is called a utility function. Utility functions are concave, indicating that the additional wellbeing derived from an additional US$ of consumption is higher when consumption is low, and lower when consumption is high – this is the diminishing marginal utility of consumption. Figure 2 shows an example.

Figure 2. A utility function describing the relation between consumption and wellbeing.
A common mathematical expression for the utility function is:

where U is utility, C consumption and γ the elasticity of marginal utility of consumption.
Floods lead to a reduction in an individual's consumption, e.g., because income is diverted from consumption to replacement of damaged goods, or because income is lost. We assume that in the absence of financial protection, flood damages lead to immediate reductions in consumption and hence wellbeing. Three types of financial protection measures can, however, reduce this immediate impact on individuals' consumption, or smooth it over time (figure 1): insurance, social-protection and self-protection. In case of insurance and social-protection, damage is covered by others, or assistance is received to maintain consumption; examples are compensation, aid and unemployment benefits. Social-protection can be formal or informal and providers include the international community, national governments, NGOs, communities, philanthropists, relatives and friends. If the individual is protected through insurance or social-protection, we assume that this part of the damage is efficiently spread over a large group of people, so that the impact on individual's consumption is small. In this case, the EAD is an appropriate estimate for the social welfare value of flood risk (Arrow and Lind, Reference Arrow and Lind1970; see also figure 3). We call this collective flood risk. Note that the assumption of efficient risk spreading may not be valid for all countries, such as for example small island states in the Pacific.
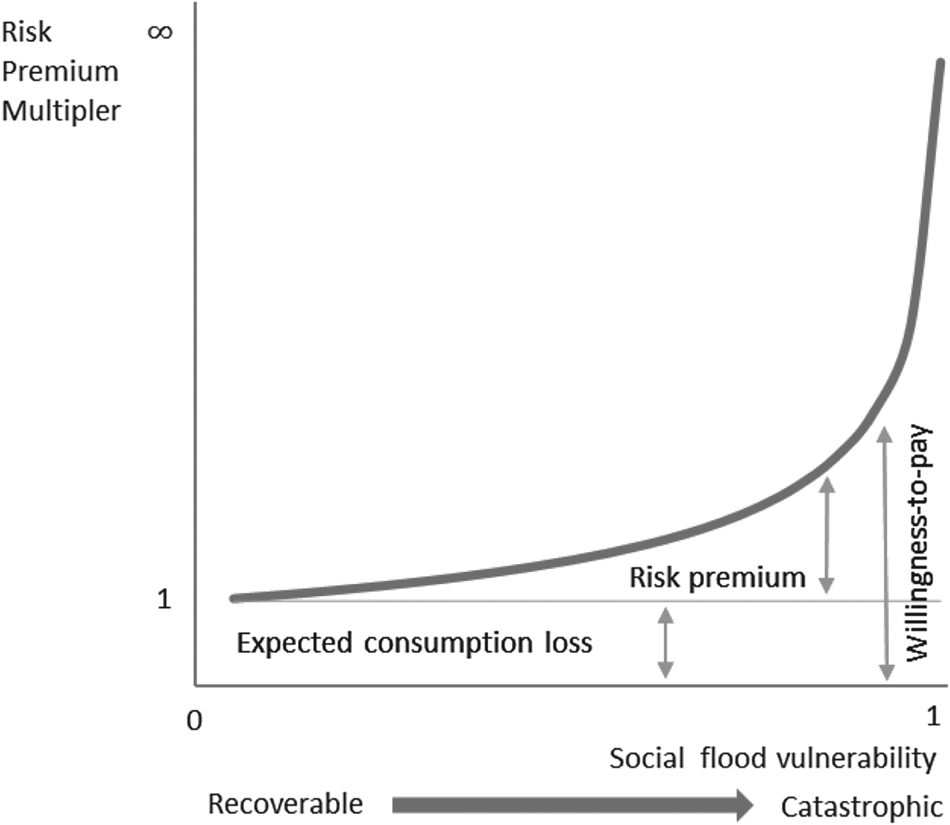
Figure 3. Risk premium multiplier as a function of social flood vulnerability.
For damages which are not covered through insurance or social-protection, self-protection may reduce the immediate impact on consumption. This type of measures are actions individuals can take to smooth the impact on consumption over time. Examples are to use savings, borrow or sell assets. Individuals with higher socioeconomic status (i.e., income) are in general better financially protected than individuals with lower status, for example because they have larger social networks, are higher educated and therefore better able to request compensation or aid, or have better access to credit markets (e.g., Zakour and Gillespie, Reference Zakour and Gillespie2013; Hallegatte et al., Reference Hallegatte, Bangalore and Vogt-Schilb2016, Reference Hallegatte, Vogt-Schilb, Bangalore and Rozenberg2017).
We define social flood vulnerability of individuals as the consumption lost in a year after a flood (accounting for financial protection), as a fraction of annual income.Footnote 1 The higher this fraction is, the more vulnerable the individual is, and the harder it is to recover. For an individual's recovery, we consider two scenarios. The first scenario is that the consumption loss is so large that consumption falls below a critical threshold (e.g., the poverty line) and recovery is impossible. This may have serious consequences, such as lasting poverty, personal bankruptcy (Lawless, Reference Lawless2005), migration, starvation (e.g., Naqvi and Rehm, Reference Naqvi and Rehm2014), infant mortality (Anttila-Hughes and Hsiang, Reference Anttila-Hughes and Hsiang2013) or suicide (Krug et al., Reference Krug, Kresnow, Peddicord, Dahlberg, Powell, Crosby and Annest1999). In a social welfare CBA, such individual catastrophic flood risk cannot be properly valued unless it is assumed that the individual will die – in which case the value of statistical life (VoSL) or a ‘VoSL like parameter’ (Weitzman, Reference Weitzman2009) can be used as an upper bound estimate for the value of the damage.Footnote 2 By using the same VoSL for all individuals, individual catastrophic flood risk can be aggregated without using equity weights (Somanathan, Reference Somanathan2006).
In the second scenario, the consumption loss is not too large, and recovery is possible. For the valuation of individual recoverable flood risk, the expected annual consumption loss (EACL) has to be converted first into an expected annual wellbeing loss (EAWBL). This conversion is implemented by using the so-called risk premium, which is based on the utility function.Footnote 3 We start with an example. Suppose that there is a probability of 1/500 per year on a consumption loss of US$500, in which case the EACL is US$1. A person earning US$10,000 annually is not vulnerable to such loss (social flood vulnerability is 0.05), and would not be willing to pay significantly more than US$1 per year to prevent it. A person earning US$700 per year is, however, highly vulnerable (social flood vulnerability is 0.71) and would be willing to pay more, for example US$3 per year, to prevent this loss.Footnote 4 For this person, the increase in wellbeing, which is equal to his willingness-to-pay, would be US$3 per year if the loss can be prevented. The risk premium is the difference between the willingness-to-pay and expected damage, which is US$2 per year. This is called risk aversion, and is implemented by multiplying the EACL by the risk premium multiplier to derive the annual wellbeing loss (or willingness-to-pay). Figure 3 illustrates that the value of this risk premium multiplier increases more than proportionally with social flood vulnerability (Kind et al., Reference Kind, Botzen and Aerts2017).
The value of the risk premium multiplier depends on the flood probability, the mathematical expression for the utility function, and the elasticity of marginal utility of consumption (see equation (3) in section 3). It is close to 1 (no risk premium) for low social flood vulnerability, while it reaches infinity if social flood vulnerability is 1 (in which case all consumption is lost and the event is completely catastrophic for the individual).
Willingness-to-pay is a monetary estimate of the increase in individual wellbeing if the flood risk is eliminated. To aggregate willingness-to-pay of individuals with different incomes into a value for the social welfare flood risk, equity weights have to be applied additionally (Kind et al., Reference Kind, Botzen and Aerts2017). This ensures that the willingness-to-pay of, for example, US$10 per year for a poor person gets a higher weight than it gets for a richer person. Applying risk premiums and equity weights simultaneously does not lead to ‘double counting’: whereas risk premiums correct for differences in the values of a US$ for the same individual, but in situations with and without flooding, and hence with low and high consumption, equity weights correct for differences in values of a US$ for different individuals with low and high income or consumption (see also footnote 6).
Finally, total social welfare flood risk is the sum of collective, individual recoverable and catastrophic flood risks.
The framework shows that financial protection for individuals who suffer potentially relatively large damages compared to their baseline consumption is an important driver in the socioeconomic flood risk assessment. Low levels of financial protection lead to relatively high social flood vulnerability and high social welfare losses. High levels of financial protection indicate that damages are spread over large groups and/or over long periods of time, and lead to lower social vulnerabilities and lower social welfare losses. We follow Hallegatte et al.'s (Reference Hallegatte, Bangalore and Vogt-Schilb2016) definition for the indicator of socioeconomic flood resiliency as expected annual damage divided by expected annual social welfare loss. If the value is 1, damages are perfectly spread over the population and/or in time, which is the highest achievable. A value less than 1 indicates that damages are imperfectly spread and that social flood risk can also be reduced by providing financial protection and/or by redistributing income.
3. Quantification
In this section, we provide the equations to quantify the social welfare flood risk. Those are based on Kind et al. (Reference Kind, Botzen and Aerts2017), in which the theoretical background is also provided.Footnote 5 Some elements in figure 1 are not quantified: those are the adaptation/transformation process that follows recovery and which may lead to measures that change physical and/or social flood vulnerability, and hence flood resiliency over time.
For illustrational purposes, we represent flood risk with a single event with probability P. Social welfare flood risk is the sum of collective, individual recoverable and individual catastrophic flood risk (figure 1). To this end, the damage for individual i, D i, is split into two parts: D i, individual, which the individual has to pay, and D i, collective, which is covered collectively through insurance and/or social-protection.
3.1 Collective flood risk
Since we assume that D i, collective is spread over a large group and does not have a significant effect on individuals’ consumption, the expected annual collective flood damage EADi, collective = P ×D i, collective provides the social welfare value of this risk.
3.2 Individual recoverable flood risk
Individuals will protect themselves against large reductions in consumption due to flooding, e.g., by using savings or by borrowing, through which they smooth the impact on consumption over time. In our model, D i, individual is smoothed over time T; this leads to consumption losses in the years after a flood according to

where CL i,t = consumption loss for individual i in year t; f i,t(D i,individual) = consumption smoothing function for individual i, with 0 ≤ f i,t(D i,individual) ≤ 1; and $\sum_{t = 0}^T {f_{i,t}}\break (D_{i,{\rm individual}}) = 1$ .
.
Self-protection smooths the impact on consumption and thereby lowers social flood vulnerability, z i,t, which is defined as:

where Y i,0 = baseline annual income of individual i.
As long as z i,t does not exceed a critical threshold, the individual can recover. Expected annual consumption loss for year t after a flood, EACLi,t, is then equal to P × CLi,t. The risk-premium multiplier $R_{{\rm EAWB}{\rm L}_{i,t}/{\rm EAC}{\rm L}_{i,t}}$ converts this into an expected annual wellbeing loss EAWBLi,t (Kind et al., Reference Kind, Botzen and Aerts2017):

where γ 1 = elasticity of marginal utility of income (γ 1 ≠ 1).
The EAWBL due to EACL for year t is

Total EAWBL equals the discounted sum of EAWBL over the period over which the impact of consumption is smoothed:

where d = social discount rate.
For aggregation of individual wellbeing into social welfare, equity weights are applied.Footnote 6 The expected annual social welfare loss EASWLi for individual i equals the EAWBLi multiplied by the equity weight (Kind et al., Reference Kind, Botzen and Aerts2017):

where γ 2 = elasticity of marginal utility of income; and Y avg = average per capita income.
While risk premiums (equation (3)) and equity weights (equation (6)) are based on the same elasticity of marginal utility of income, we use two different parameters for the elasticity: γ 1 and γ 2. Countries and donors have different CBA guidelines; some of them allow risk premiums but prohibit equity weights, in which case γ 1 >0 and γ 2 = 0. For an overview of CBA guidelines, see Kind et al. (Reference Kind, Botzen and Aerts2017).
3.3 Catastrophic flood risk
If z i,t exceeds a critical threshold, the individual cannot recover and the risk is catastrophic. As discussed in section 2, the social welfare value of catastrophic risk cannot be determined unless the VoSL is used as a proxy.
3.4 Social welfare flood risk
The expected annual social welfare losses, EASWL, in an area with N individuals is

In a social welfare CBA, the risk reduction benefit of a project equals the reduction of the EASWL.
4. Case study Ho Chi Minh City
4.1 Introduction
The purpose of the case study is to illustrate the practical feasibility of accounting for social vulnerability and resilience in a social welfare CBA, by applying it to three wards of Ho Chi Minh City (HCMC), Vietnam. We discuss data, the calculation procedure, and compare the results from the traditional and social welfare approaches. An important limitation is that we only include damages to buildings and contents which is, given the objective of our paper, defendable. We note that this results in an underestimate of the total social welfare impacts. Including other types of damages is also problematic since georeferenced data to estimate those damages is often unavailable.
HCMC is a megacity with one of the highest flood risks in the world, which is expected to increase considerably (Hallegatte et al., Reference Hallegatte, Green, Nicholls and Corfee-Morlot2013). To reduce flood risk, different plans have recently been proposed. One of these is the MARD plan, which protects the inner city with a ring dike. This plan has been studied in the HCMC Flood and Inundation Management Project (Royal Haskoning DHV and Deltares, 2013), from which we use information.
We consider present flood risk in three wards: W1, W2 and W3. These wards have populations ranging between 14 and 21 thousand people, are diverse in location and income, and have significant exposure and inundation water levels under the 1:100 year flood scenario used in the case study (see figure 4 and table 1).

Figure 4. Map of HCMC overlaid with water depths for the 1:100 year inundation scenario, and location of the wards.
Table 1. Key statistics of the wards

4.2 Monte Carlo approach
In reality, values for risk parameters necessary to determine social flood vulnerability and flood risk per individual, as illustrated in figure 1, are not known. Therefore we use estimated probability distributions of – and correlations between – the most critical parameters determining risk and vulnerability. This is implemented in a Monte Carlo approach, through which we generate synthetic populations of 10,000 statistical individuals per ward. On the basis of simulated vulnerabilities and risks for those individuals, social welfare values of flood risk are assessed for the populations.
The 1:100 year inundation scenario and the land use map (Royal Haskoning DHV and Deltares, 2013) are used to estimate probability distributions of flood water depths in residential areas. Depth-damage curves and maximum damage amounts for buildings and contents were obtained from Huizinga et al. (Reference Huizinga, de Moel and Szewczyk2017), including estimates of their uncertainty. To deal with regular nuisance floods, many households in HCMC have already implemented private flood risk reduction measures, like raising doorsteps. For this reason, we use a 15 cm threshold for water depth, below which no damage is assumed to occur (Scussolini et al., Reference Scussolini, Tran, Koks, Diaz-Loaiza, Ho and Lasage2017).
Income distributions of the wards are based on the database underlying Vietnam's Poverty Map (Lanjouw et al., Reference Lanjouw, Marra and Nguyen2013). This database contains estimates of per capita income for 20 per cent of Vietnam's population; the estimates are based on the 2009 census and 2010 Vietnam Household Living Standard Survey (VHLSS). The distribution of the size of the house per capita is based on data on floor space per capita from the census, and is adjusted with a factor of 0.5 to correct for multilevel buildings (on the basis of Scussolini et al. (Reference Scussolini, Tran, Koks, Diaz-Loaiza, Ho and Lasage2017)).
There is little useful information on flood insurance and social- and self-protection, and virtually no information on how these relate to income. The penetration rate of flood insurance is very low (Reynaud et al., Reference Reynaud, Nguyen and Aubert2017) and government and donor aid is likely to cover only a very small percentage of households' flood damage (World Bank, 2010; SCFC, 2012). Information on self-protection is scarce. For many households, lack of finance has been reported in the past as a reason not to repair even small flood damages (SCFC, 2012; Chinh et al., Reference Chinh, Bubeck, Dung and Kreibich2016). The FINDEX database indicates that 70 per cent of the population of Vietnam has no bank account (a higher percentage applies to the poor), that almost 65 per cent saves some money, and that 30 per cent borrows some money from family (Demirgüç-Kunt et al., Reference Demirgüç-Kunt, Klapper, Singer, Ansar and Hess2018).
Due to lack of useful financial protection data, we assume a simple damage smoothing function, CLi,t = D i,individual/T, with T being the number of years over which the damage is smoothed, leading to equal annual consumption losses. For the level of financial protection, we assume three scenarios (section 4.4). For elasticities γ 1 and γ 2 we use 1.2 (see Kind et al., Reference Kind, Botzen and Aerts2017), and for the social discount rate d (which is not very significant in this approach) we use 4 per cent per year.
We consider correlations between risk parameters. This is important because, for example, an individual with a high income is likely to own an expensive house and hence is likely to suffer more financial flood damage. Without correlations, the Monte Carlo analysis would generate too many statistical individuals with relatively high flood damage and low income, and hence would overestimate social flood vulnerability and social welfare flood risk. In table 2, we review some possible correlations.
Table 2. Possible correlations between selected risk parameters

Since in the Monte Carlo analysis it is only possible to correlate one parameter to one other parameter, we include the correlation between per capita income and house area per capita, which has the highest correlation coefficient (0.72–0.85), and we disregard the correlation between income and damage per m2, because it has a lower coefficient (0.24–0.36) and thus is less important.
4.3 Results of the traditional flood risk assessment
Table 3 shows results from the traditional flood risk assessment. Traditional flood risk is highest in W2 and lowest in W1.
Table 3. Results of the traditional flood risk assessment

4.4 Results of the socioeconomic flood risk assessment
Because there is almost no data on financial protection, we determine the social welfare risk while assuming three scenarios for financial protection. Those include two extreme scenarios (1 and 2) to show the range of results, and one targeting scenario (3).
Scenario 1: complete coverage by insurance and/or social-protection
In scenario 1, damages for individuals are completely covered through insurance and/or social-protection – an unlikely scenario. In this case, the social welfare flood risk consists only of collective flood risk, which equals the value of traditional flood risk (see figure 1) and has been reported in table 3. In this case, if for example a project reduces the flood probability in W2 from 1/100 to 1/1,000 per year (a 90 per cent reduction) and we assume that the damage in a 1:100 and 1: 1,000 year flood event remains the same, the annual flood risk reduction benefit in a social welfare CBA would be 0.9 × US$328,000 = US$295,000.
Scenario 2: no financial protection
Scenario 2 is the opposite of scenario 1 and also unlikely: it assumes no insurance, social- and self-protection. In this case, the consumption loss in the year of the flood is equal to the flood damage. How this translates into social welfare losses depends on the social flood vulnerability and income of individuals (see figure 1).
Figure 5 maps the distribution of social flood vulnerability against per capita income for three synthetic populations. The horizontal axes are divided by average annual per capita income (US$1,300 for HCMC), while the vertical axes are divided by a value of 1 for social flood vulnerability, i.e., where consumption loss in a year is equal to annual income.
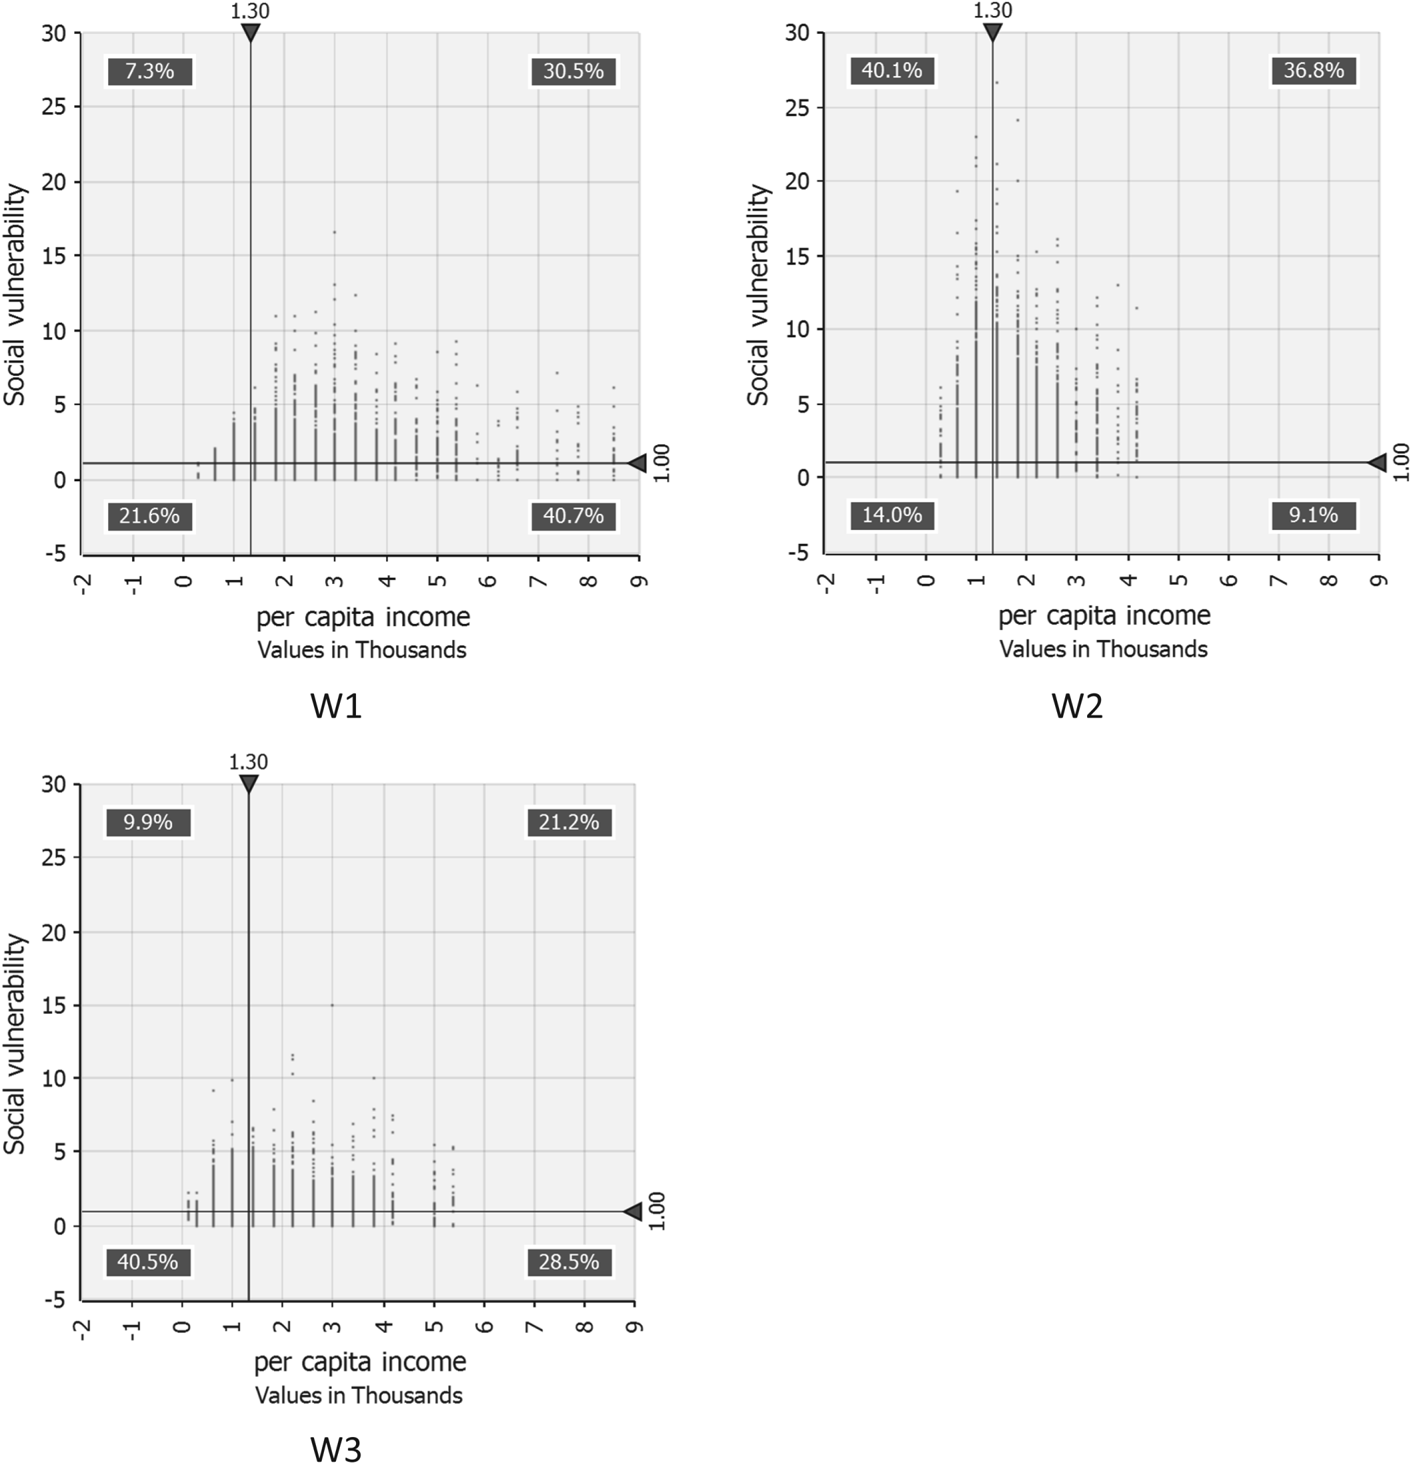
Figure 5. Distribution of social flood vulnerability against per capita income for the three populations, assuming no financial protection. Income data points cluster because income bins were used as input.
The results show that, in the case of no financial protection, the 1:100 year flood is catastrophic for large parts of the populations. It is most catastrophic in Ward 2, where 76.9 per cent (40.1 per cent + 36.8 per cent) of the affected population has a consumption loss in excess of annual income. In this case, the value of the risk premium and hence of social welfare flood risk reaches ‘infinity’ (figure 3), and consequently the social welfare benefit of flood risk reduction reaches infinity. In this case, a CBA is not a useful instrument.
One suggestion is to use the VoSL as an estimate of the maximum value of the individual's catastrophic loss. This VoSL can be roughly estimated at 120 × per capita income (Miller, Reference Miller2000), i.e., for Vietnam in the order of US$150,000. Table 4 shows the social welfare flood risk, if we assume that risk is catastrophic if social flood vulnerability is 1.
Table 4. Social welfare flood risk for scenario 2, using the VoSL to value catastrophic risk (in 000s US$ per year)

For all three wards, the value of the social welfare flood risk turns out to be about 30 times the value of traditional flood risk (table 3), and hence the indicator for socioeconomic flood resilience is 0.03 to 0.04. If, in this context, a project would reduce the flood probability in W2 from 1/100 to 1/1,000 per year while the damages remain the same, the annual flood risk reduction benefit in a social welfare CBA is 0.9 × US$11.2 million = US$10.1 million.
Using the VoSL assumes that all individuals faced with catastrophic risk will eventually die as an indirect effect of the flood. This is not very realistic, as the government and international community are likely to intervene should such human disasters be about to happen – i.e., they would provide social-protection.
Scenario 3: targeting social-protection
The previous two extreme scenarios illustrate the large social welfare benefit of being financially protected, especially if the potential flood damage for an individual is large compared to income. Social welfare values of flood risk in the extremes differ by a factor of 30, depending on no or complete financial protection. This makes estimating the social welfare benefits of flood risk reduction in practice very challenging. The problem is that in general, information on social- and self-protection is not available, and this information cannot be collected easily: most ‘extreme’ events have not happened in reality, making it difficult to predict how individuals and institutions would respond. Only for countries with high rates and high coverage of flood insurance (for an overview, see Lamond and Penning-Rowsell, Reference Lamond and Penning-Rowsell2014), and for countries where the government will compensate the major share of flood damage (like in the Netherlands; see, e.g., Kind, Reference Kind2014), is the level of financial protection reasonably predictable and thus the value of social welfare flood risk can be estimated with acceptable confidence.
In scenario 3, we assume that the government, as part of its overall DRR strategy, wants to know how much funding would be required to prevent individual catastrophic losses from a 1:100 year flood event. We assume no flood insurance and that the damage which has to be covered by the individual, D i,individual, is smoothed over 5 years. Social-protection is provided by the government and targeted such that all individuals are able to maintain a minimum consumption of US$700 per year (≈365 × US$1.90/day, which is the poverty line), unless consumption is already below US$700 per year in which case social-protection is targeted such that this lower consumption can be maintained.
Table 5 shows that for W2, with lowest per capita income and average financial damage of US$3,400 per individual, this would require that on average 36 per cent of the damage (US$1,200 per individual) has to be covered through social-protection (D i,collective). This percentage is higher for individuals with below average income, and lower for individuals with above average income. For W1 and W3, the required social-protection rate is lower: 11 to 13 per cent (about US$200 per individual). Table 5 also shows the value of the social welfare risk under this scenario.
Table 5. Socioeconomic flood risk assessment scenario 3

Compared to the value of traditional flood risk (table 3), the social welfare flood risk is of the same order of magnitude, and socioeconomic flood resilience is high (0.96–1.37). Note that resiliency indicator values above unity for W1 and W3 are caused by above average incomes for the wards in combination with equity weights.
In this scenario, if a flood risk project would reduce the flood probability in W2 from 1/100 to 1/1,000 per year (a reduction of 90 per cent) while the flood damages in the 1:100 year and 1:1,000 year events remain the same, the annual flood risk reduction benefit is about 0.9 × US$342 million = US$308,000.Footnote 7
Note that the level of social-protection under scenario 3 does not represent the current situation, in which the government of Vietnam compensates a maximum of US$300 per household (i.e., less than US$100 per individual; see World Bank, 2010).
5. Discussion
The case study reveals the difficulties in reliably estimating the social welfare value of flood risk, if social flood vulnerability is potentially high. We identify nine limitations to implementing and validating the social welfare approach which integrates social vulnerability and resilience. First, microeconomic data on financial protection against floods is not available in many regions, which is crucial information. Second, per capita consumption is used as a basis for inequality, and it is assumed that income is equal to consumption. For developing countries, this is a general assumption, since – due to the informal economy – income is more difficult to measure than consumption. This assumption is more valid for individuals with low incomes than with high incomes, who do not consume all of their income. The approach therewith overestimates social flood vulnerability and social welfare benefits of flood risk reduction for non-poor people. Third, we assume that all flood damage will be repaired, at the expense of consumption. In reality, households may choose not to repair damage if they have to sacrifice too much consumption. Fourth, to determine when risk becomes catastrophic, we use a threshold of 1 for the social flood vulnerability indicator. This is simplistic; however it is very difficult to define a good alternative indicator and threshold value. Health expenditures are sometimes considered to be catastrophic when they reach 40 per cent of capacity to pay (i.e., expenditures on nonfood items) (Xu et al., Reference Xu, Evans, Kawabate, Zeramdini, Klavus and Murray2003). Fifth, in the absence of a reliable flood damage model for HCMC, we use global damage functions and values to estimate flood risk, which are tailored to Asia (Huizinga et al., Reference Huizinga, de Moel and Szewczyk2017). We have no insight into the accuracy of those functions and values. Sixth, we use only one parameter to correlate damage to income. Including more parameters will increase the correlation, reduce social flood vulnerability and increase socioeconomic resilience. Seventh, we only include damage to houses and their contents, while other damages (e.g., income loss, health impacts) may be as important, especially at lower inundation depths (e.g., Nabangchang et al., Reference Nabangchang, Allaire, Leangcharoen, Jarungrattanapong and Whittington2015). Including other damages will likely increase social flood vulnerability, although it should be noted that floods can also create job opportunities, such as providing services during reconstruction, which may substitute for income losses. Eighth, it is unclear whether informal settlers are included in the census data and hence whether their risks are accounted for. And ninth, there is no generally agreed-upon expression for the utility function and value for the elasticity.
Notwithstanding these limitations to the social welfare approach, using traditional risk estimates in CBAs is based on (implicit) assumptions which are often very unlikely, notably that all damage is covered collectively, an assumption which may be especially harmful to the poor. To better address vulnerability, Cutter et al. (Reference Cutter, Emrich, Morath and Dunning2013) have proposed combining traditional flood risk estimates with a social vulnerability indicator (SVI), which is based on socioeconomic characteristics of the population – such as age, education, health and income. This does not really solve the problem of estimating the social welfare values of flood damage for different individuals or groups, because there is no objective method to derive multipliers from the SVI which can be used to correct traditional values of flood risks.
Our analysis highlights the importance of flood insurance and social-protection in situations where individuals' social flood vulnerability is high, which is the case for many people in large parts of the world (e.g., Hallegatte et al., Reference Hallegatte, Vogt-Schilb, Bangalore and Rozenberg2017). At present, only about one-third of global flood damage is insured (Kind et al., Reference Kind, Botzen and Aerts2017), and this fraction is lower for developing countries (Munich Re, 2018).Footnote 8 Especially in developing countries, many governments already face financing gaps for a 1:100 year event, and international demands for disaster finance exceed availability (UNISDR, 2015). Insurance, on the other hand, is not available everywhere due to a lack of demand as well as affordability issues. There is already, at the present time, a serious financing challenge for disaster risk, which shows the importance of policies which aim at preventing future increases in flood risk.
6. Conclusions
In socioeconomic flood risk assessments and social welfare CBAs, flood risk reduction benefits should be based on risks for individuals. Three types of risks result from flood damage to individuals: collective, recoverable and catastrophic flood risks. When individuals are financially protected through insurance of social-protection, individual damage is covered collectively. To value collective flood risk in social welfare terms, the traditional approach – which values risk as expected annual damage – is appropriate. The other types of risks – recoverable and catastrophic – apply to damage which is not covered collectively. Values of these risks depend on individual social flood vulnerability, which is the individual's annual consumption loss after a flood, as a fraction of annual baseline income. Individuals with the opportunity to smooth the impact of floods on their consumption over several years after the flood through self-protection (e.g., through savings or borrowing), and individuals with higher incomes, are less socially vulnerable to floods. If the social flood vulnerability indicator exceeds a critical threshold, recovery for an individual is not possible; this is individual catastrophic flood risk. Determining social welfare values of catastrophic risks is problematic; in theory, it is infinitely high, and so would be the benefit of reducing it by even a tiny little bit. A practical solution is to use the VoSL to approximate its upper bound value. Recoverable risk applies if the social flood vulnerability indicator does not exceed the critical threshold. Individual recoverable risks have to be valued taking social flood vulnerabilities and income differences into account, by applying risk premium multipliers and equity weights simultaneously.
Traditional flood risk assessments and CBAs usually treat all flood risks as collective, without justification. This may seriously underestimate the social welfare value of flood risk; the study for HCMC suggests that this may be as high as a factor of 30. Results of traditional flood risk assessments and CBAs that do not reflect financial protection and social flood vulnerability of intended beneficiaries should therefore be treated with caution. These CBAs cannot be used to guide flood risk investment decisions that are supposed to increase social welfare, since they will be biased against measures that protect the poor – who are likely to be the least financially protected and most vulnerable, and hence whose risk is most severely undervalued.
The HCMC study shows the difficulties in valuing recoverable and catastrophic flood risk, especially since data on the distribution of damage over individuals with different incomes, and data on financial protection, is mostly missing. Combining other social vulnerability indicators (e.g., those of Cutter et al., Reference Cutter, Emrich, Morath and Dunning2013) with traditional flood risk estimates may be preferable to the traditional approach, but does not solve the valuation problem either, especially as they are unable to identify and value catastrophic risk. Therefore, we advise investigating – when preparing any FRM policy or plan – how (extreme) risks are (likely to be) distributed over the population and what options there are to provide sufficient financial protection for the most vulnerable. Physical flood risk reduction measures can then be identified and assessed on the basis of remaining social welfare risk.
Note that social welfare approaches to flood risk assessments and CBAs do not reduce the need to implement physical flood risk reduction measures in general. Such measures will especially increase benefits for poor and vulnerable populations, and hence increase investments targeting them, if they are financially insufficiently protected. With full financial protection, values of social welfare risks will coincide with the value of traditional risks. Hence, financial protection measures will not reduce the value of social welfare risks below values of traditional risks and therefore will not lead to less physical flood risk reduction measures compared to the traditional approach.


