


1. Introduction
Climate shocks, which reduce incomes and destroy productive assets, can drive rural households into poverty. Climate change, which increases the frequency and intensity of these shocks, threatens to make climate risk an ever more important contributor to poverty dynamics. Against this backdrop, we ask four questions concerning the design of social protection programs intending to reduce poverty and facilitate the upward mobility of poor and vulnerable households: (1) How do short run coping strategies affect intergenerational vulnerability and poverty dynamics? (2) How should a given social protection budget be targeted or prioritized between the already destitute and those who are vulnerable to becoming destitute? (3) Can public budget constraints be relaxed–and poverty impacts improved–through targeting social protection at the vulnerable with partial financing provided by beneficiaries' own private ‘premium’ contributions? (4) Is a vulnerability-targeted social protection strategy robust to the heightened risk exposure anticipated with climate change?
To gain purchase on these questions, we develop a theoretical, dynamic programming model of multi-generation families or ‘dynasties’ that in the face of risk allocate scarce resources between consumption and asset accumulation to maximize long-term family well-being. Modeled after the pastoral regions of East Africa where climatic shocks already loom large and drive poverty, each dynasty begins with initial levels of physical assets and human capabilities or capital. Over time, shocks can not only drive vulnerable households into long-term poverty, they may also induce households to cut consumption and preserve physical assets as they seek to avoid chronic poverty.
One novelty of ths model is that we allow consumption shortfalls (or undernutrition) to feedback and probabilistically reduce the human and economic capabilities of the dynasty's next generation. This feedback further increases the impact of vulnerability on long-term poverty dynamics, raising the stakes for addressing poverty, food security and vulnerability through carefully designed social protection programs.
Using this model, we explore the effectiveness of different schemes of social protection, ranging from conventional in-kind transfers, means-tested and targeted at the destitute, as well as novel schemes where a fraction of a fixed social protection budget is spent as contingent transfers that protect the vulnerable. Gauged by standard poverty metrics, targeting some of the fixed social protection budget at the vulnerable can reduce both the extent and depth of poverty over time relative to a conventional in-kind transfer strategy. However, given budget constraints, targeting the vulnerable induces a tradeoff between the short-term and long-term well-being of the poor. This tradeoff can be partially mitigated if a fixed social protection budget is stretched by having the vulnerable privately fund a portion of the insurance premium that functions as contingent social protection.
The ability of households to adapt to increasing climate risks will depend largely on local poverty dynamics. As climate change increases risk and vulnerability, social protection will become increasingly important. This analysis suggests that targeting vulnerable households–in addition to the already destitute–will protect households against heightened risk and minimize unnecessary poverty in future generations. Targeted social protection policies that carefully consider the poverty dynamics of local settings will result in greater resiliency.
The remainder of this paper is organized as follows. Section 2 develops the dynamic model of dynastic decisionmaking, illustrating how coping strategies interact with the evolution of human capital to alter the mapping between initial endowments and long-term poverty. Section 3 then explores alternative schemes of social protection, including in-kind transfers, vulnerability-targeted social protection and insurance models with mixed public and private financing of social protection. Section 4 stress tests the different social protection schemes by increasing risk in the model to the level predicted by pessimistic climate change scenarios and beyond. Finally, section 5 concludes with thoughts on furthering the social protection conversation in an era of climate change-fueled increases in the number and intensity of shocks.
2. A dynamic model of risk, vulnerability and long-term poverty dynamics
We begin with our core theoretical model of household intertemporal decision making and analyze it first under the simplifying assumption that human capital is an endowment that is fixed over time and is not influenced by a dynasty's history of consumption and undernutrition. While this assumption is patently unrealistic over the longer term, it provides the opportunity to fix key concepts and ideas concerning risk, vulnerability and asset smoothing. We then generalize the model and incorporate a feedback loop between consumption, nutrition and the evolution of human capabilities or capital.
2.1. Poverty dynamics with exogenous human capital
We model an infinitely lived household dynasty d, which is comprised of a sequence of generations g=0, 1, 2, …. Each generation lasts for 25 years (t=1–25) and considers only the welfare of the current generation (but does not know when the generation will conclude). Each dynasty enjoys initial endowments of physical assets, A d0, and human capital, H d0. We initially assume the dynasty's human capital is fixed within a generation and evolves exogenously at each generational switching point. We will later relax this assumption and allow the next generation's human capital to evolve endogenously in response to that generation's ‘early childhood’ nutritional experience as reflected in the consumption levels of the prior generation.
We assume the household dynasty manages resources to solve the following problem:
 $$\eqalign{\mathop {\max }\limits_{\mathop{\rightarrow}\limits^{c} dgt} \qquad &E_\theta \left[ {\sum\limits_{g = 1}^\infty {\sum\limits_{t = 1}^{25} {\beta ^t} } u(c_{dgt})} \right] \cr subject\;to: &\cr & c_{dgt} \le A_{dgt} + f(A_{dgt},H_{dgt}) \cr & f(A_{dgt},H_{dgt}) = H_{dgt}\max [A_{dgt}^{\gamma ^h} - F,A_{dgt}^{\gamma ^l} ] \cr & A_{dgt + 1} = \left[ {f(A_{dgt},H_{dgt}) + (1 - \varepsilon _{dgt + 1})A_{dgt}} \right] - c_{dgt} \cr & H_{dgt} = \left\{ {\matrix{ {H_{dgt - 1}\forall t \ne 1} \hfill \cr {\left\{ {wH_{d(g - 1),25} + (1 - w)\tilde H} \right\}\>if\, t = 1} \hfill \cr } } \right. \cr & A_{dgt} \ge 0.} $$
The first constraint restricts current consumption to cash on hand (the value of current physical assets plus income). As shown in the second constraint, dynasties have access to both a high and a low productivity technology ( $\gamma^{h} > \gamma^{\ell}$). Fixed costs, F, associated with the high technology make it the preferred technology only for households above a minimal asset threshold, denoted Ã. Thus, households with assets greater than à choose the high technology, and households below à choose the low productivity technology. Note that human capital, H dgt, augments the total factor productivity of both production technologies.
The third constraint is the equation of motion for physical assets. Assets are subject to stochastic shocks (or depreciation),  $\varepsilon_{d\comma g\comma t+1}\geq0$. The shock is independent and identically distributed, and realized for the households after decision-making in the current period (t), and before decision-making in the next period (t + 1) occurs. Period t cash on hand that is not consumed by the household is carried forward as period t + 1 assets.
As shown by the fourth constraint, we assume for now that the dynasties' human capital is exogenously fixed at its starting value for that generation. However, when the generation changes (and when the children of the prior generation take over as dynasty leaders), human capital resets based on the realized capabilities of this next generation. For now, we assume the next generation's genetic potential is expressed as a weighted average of the parent generation's human capital endowment and a random draw,  $\tilde H$, from the overall population capabilities distribution. Numerically,
  $\tilde H$ is distributed with expected value of 1.35. Note that this term will generate a regression to mean genetic potential.
Finally, the non-negativity restriction on assets reflects the assumption that households cannot borrow. This assumption implies that consumption cannot be greater than current production and assets, but it does not preclude saving for the future.
As has been analyzed by others in similar models (e.g., Buera (Reference Buera2009) and Carter and Ikegami (Reference Carter, Ikegami, Addison, Hulme and Kanbur2009)), the non-convexity in the production set can, but need not, generate a bifurcation in optimal consumption and investment strategies (or what Barrett and Carter (Reference Barrett and Carter2013) call a multiple equilibrium poverty trap). This bifurcation happens if steady states exist both below and above Ã. If they do, there will exist a critical asset threshold where dynamically optimal behavior bifurcates, with those below the threshold deaccumulating assets and moving towards the low steady state, and those above it investing in an effort to reach the high steady state. The former group is often said to be caught in a poverty trap. Following Zimmerman and Carter (Reference Zimmerman and Carter2003), we label the critical asset level where behavior bifurcates as the Micawber threshold, and denote it as A M.
As in Janzen et al. (Reference Janzen, Carter and Ikegami2017), we purposefully select parameters to reflect the observed asset dynamics of the northern Kenyan arid and semi-arid lands (ASALs), where empirical evidence of a poverty trap exists (McPeak and Barrett, Reference McPeak and Barrett2001; Lybbert et al., Reference Lybbert, Barrett, Desta and Layne Coppock2004; Barrett et al., Reference Barrett, Marenya, McPeak, Minten, Place, Randrianarisoa, Rasambainarivo and Wangila2006; Santos and Barrett, Reference Santos and Barrett2011) and a drought index-based livestock insurance (IBLI) contract has been introduced (Chantarat et al., Reference Chantarat, Mude, Barrett and Carter2013). Specifically, parameters were chosen and evaluated based on their ability to generate equilibrium stochastic time paths for multiple steady-states (as well as transitions) that are consistent with observations from this region (see Lybbert et al., Reference Lybbert, Barrett, Desta and Layne Coppock2004; Santos and Barrett, Reference Santos and Barrett2011). We begin with an assumed distribution of shocks (shown in figure A1 of the online appendix) similar to the empirical distribution estimated by Chantarat et al. (Reference Chantarat, Mude, Barrett and Carter2013). For the initial analysis, the assumed shock distribution is held constant across all generations; we'll refer to this shock scenario as the Base Case. We then impose a Micawber threshold and two stable steady state outcomes based on the findings of Lybbert et al. (Reference Lybbert, Barrett, Desta and Layne Coppock2004) and Santos and Barrett (Reference Santos and Barrett2011) in the same setting in order to obtain parameters for the production technology. The specific functional forms and parameters used to solve the dynamic programming problem (with the exception of the assumed shocks, which are reported in figure A1) are reported in table A1 of the online appendix. In accordance with a dual asset poverty trap, the seleted parameters accommodate both a low and high long-term stochastic steady state for each H, or alternatively, a low and high steady state for each A.
Given these parameter values, we use dynamic programming methods to find a policy function for each behavior dependent on asset levels. Specifically, we use value function iteration such that the Bellman equation has a unique fixed point as long as Blackwell's Sufficient Conditions (monotonicity and discounting) are satisfied. To solve the problem, we assume that in period t for generation g, households choose optimal c dgt and (implicitly) i dgt (where i dgt denotes investment) based on state variables A dgt and H dgt and the probability distribution of future asset losses. Households then observe exogenous asset shocks  $\varepsilon_{d\comma g\comma t+1}$. These shocks, together with optimal choices, determine assets in the next period.
Using the parameter values provided, numerical dynamic programming analysis of the household problem (1) shows that multiple equilibria exist for a range of human capital levels. The ‘chronic poverty map’ shown in figure 1a graphs across the full endowment space of initial physical and human capital assets the probability that a dynasty will end up at the low level equilibrium after three generations. The light region across the northeast corner of the figure shows those asset combinations for which this probability is zero, whereas the dark region across the southwest corner of the figure shows those combinations with probability one of the low level equilibrium. As can be seen, in this model, dynasties with initial human capital above 1.3 units will always escape the poverty trap, whereas those with human capital below 1.05 never will, irrespective of their initial level of physical assets. We refer to this latter group as the chronically poor or Destitute.
Between those two critical human capital levels, dynasties are subject to multiple equilibria, and their probability of ending up poor depends on their initial endowment of physical assets. We label dynasties in the intermediate multi-color band as the Vulnerable–households that face a probability between zero and one of ending up in the poverty trap. The Micawber threshold, A M, separates the vulnerable from the destitute.
As analyzed further by Janzen et al. (Reference Janzen, Carter and Ikegami2017), a key implication of this model is that incremental physical assets carry an extremely high shadow value for these vulnerable households.Footnote 1 Incremental assets not only create an income flow, they also give the option of advancing to the high equilibrium in the long-run, or, conversely, avoiding falling into a poverty trap. As discussed by these authors and by Carter and Lybbert (Reference Carter and Lybbert2012), it is this jump in the shadow value of assets that leads households in this asset neighborhood to smooth assets and destabilize consumption when hit with a shock.
While highly stylized, this model has rich implications concerning the impact of shocks: first, shocks can have irreversible consequences for the vulnerable. A shock that pushes a household below the Micawber threshold, A M, also implies a household has become mired in chronic poverty. Vulnerability thus matters as those who fall below A M become candidates for conventionally conceived schemes of social protection. Second, shocks can induce asset smoothing by the vulnerable. While households near either steady state will tend to smooth consumption in the spirit of the Deaton (Reference Deaton1991) model, highly vulnerable households in the neighborhood of A M will asset smooth when hit with a shock. These households drastically cut consumption in an effort to preserve capital and avoid the collapse into chronic poverty. While this coping behavior is understandable, it potentially has deleterious long-term consequences because consumption doubles as investment into future human capital, as we will now explore.
Asset smoothing by the vulnerable as intergenerational asset shifting
Consistent with our theoretical model, there is an emerging body of evidence that poorer households tend to hold on to their (modest) assets and smooth consumption less effectively than they might, and certainly less effectively than wealthier households do. Townsend (Reference Townsend1994), Jalan and Ravallion (Reference Jalan and Ravallion1999) and Kazianga and Udry (Reference Kazianga and Udry2006) note that poor households smooth consumption less effectively than wealthier neighbors. In later work, Hoddinott (Reference Hoddinott2006) provides evidence that in the wake of the 1994-1995 drought in Zimbabwe, richer households sold livestock in order to maintain consumption, while poorer households did not, destabilizing consumption instead. Similar evidence is found by Carter et al. (Reference Carter, Little, Mogues and Negatu2007) (for Ethiopia) and Carter and Lybbert (Reference Carter and Lybbert2012) (in Burkina Faso). Exploiting a randomized controlled trial in Kenya, Janzen and Carter (Reference Janzen and Carter2013) find evidence not only of differential asset smoothing by the poor, but also evidence that insurance allows the poor to improve consumption smoothing, while the impacts for the wealthier allow them to hold on to assets that they would otherwise sell to smooth consumption.
While asset smoothing by the vulnerable thus has both theoretical and empirical foundations, the full welfare consequences of asset smoothing are less explored. Hoddinott (Reference Hoddinott2006) points out that even though asset smoothing is an attempt to preserve assets, consumption itself is an input into the formation and maintenance of human capital, and hence ‘the true distinction lies in households’ choices regarding what type of capital–physical, financial, social or human (and which human)–that they should draw down given an income shock.' With this tradeoff in mind, Jacoby and Skoufias (Reference Jacoby and Skoufias1997) present evidence that households in rural India cope with shocks by reducing child school attendance–another way of drawing down human capital in the wake of a shock. While asset smoothing strategies may be rational, when they come at the cost of immediately reduced consumption, such strategies are likley to result in irreversible losses in child health, nutrition and long term well being.Footnote 2
In short, asset smoothing may set the stage for the intergenerational transmission of poverty. The implications for poverty dynamics, and ultimately the design of social protection–especially in the face of climate change–warrant attention. While asset smoothing protects the dynasty from immediate danger of permanent economic collapse, it may also impinge on future capabilities and human capital of the family. To explore the longer-term implications of asset smoothing by the vulnerable, we modify the equation of motion for human capital in model (1) as follows:
 $$H_{dgt} = \left\{ {\matrix{ {H_{dgt - 1}\forall t \ne 1} \hfill \cr {\left\{ {wH_{d(g - 1),25} + (1 - w)\tilde H} \right\} - \left\{ {\lambda \sum\limits_{t = 1}^5 1 (z > c_{d(g - 1)t}){\left( {{\textstyle{{(z - c_{d(g - 1)t})} \over z}}} \right)}^2} \right\}} \hfill \cr {\quad {\rm if}{\mkern 1mu} t = 1.} \hfill \cr } } \right.$$
 Here we still assume human capital within a generation is fixed at its starting value for that generation, but two forces now shape the human capital update with each new generation. As before, the first term in curly brackets is the next generation's genetic potential. The second new term in curly brackets is a penalty pushing an individual below genetic potential if she or he suffered consumption shortfalls (c dgt < z, where z is the nutritional poverty line) in the first critical five years of life. This specification is meant to capture the idea that undernutrition en utero and in the first four years of life can have irreversible damage on the physical and cognitive development of the child. Note that a dynasty that avoids nutritional penalties will regress towards mean human capital potential, E[ $\tilde H$].
After replacing the fixed human capital specification in model (1) with the new human capital equation of motion (2), we use the same parameter values to reanalyze the implications of the dynasty's intertemporal problem for long-term poverty dynamics.Footnote 3 For this analysis, we assume households ignore these long-term feedbacks into their long-term human capital. While this assumption helps keep the problem mathematically tractable, it is consistent with a broad range of evidence that families often overlook the long-term consequences of nutritional shortfall on the long-term economic capacity of children. The strength of this evidence is reflected in the routine practice that interventions intended to boost family income must include an element of nutrition behavior change communication to be sure that income gains translate into improved child food intake.Footnote 4 Simple discounting will also lead current decision makers to largely, but not completely, ignore impacts that occur in the distant future. We leave it to future work to incorporate nutritional awareness in this model. Note also that for the asset smoothers, a choice even with full knowledge of its long-term consequences may be no different than that which is modeled when this human capital feedback is ignored. For these households, failure to consumption smooth would mean an immediate descent into chronic poverty as opposed to putting it off for a generation.
Figure 1b displays the modified frontier that evolves across the generations when human capital is nutritionally sensitive. The color contours again mark the probability of chronic poverty as a function of the dynasty's initial human capital and asset endowments. The results are quite striking. Comparing figures 1a and b, we see that the Micawber Frontier has moved to the northeast. Initial endowment positions in the southwest corner of the diagram, which used to have some probability of escaping long-term poverty have seen those prospects drop to zero. Moreover, vulnerability has increased for a broad range of dynasties that used to be able to rely on rapid accumulation and asset smoothing to ensure a near certain escape from poverty.
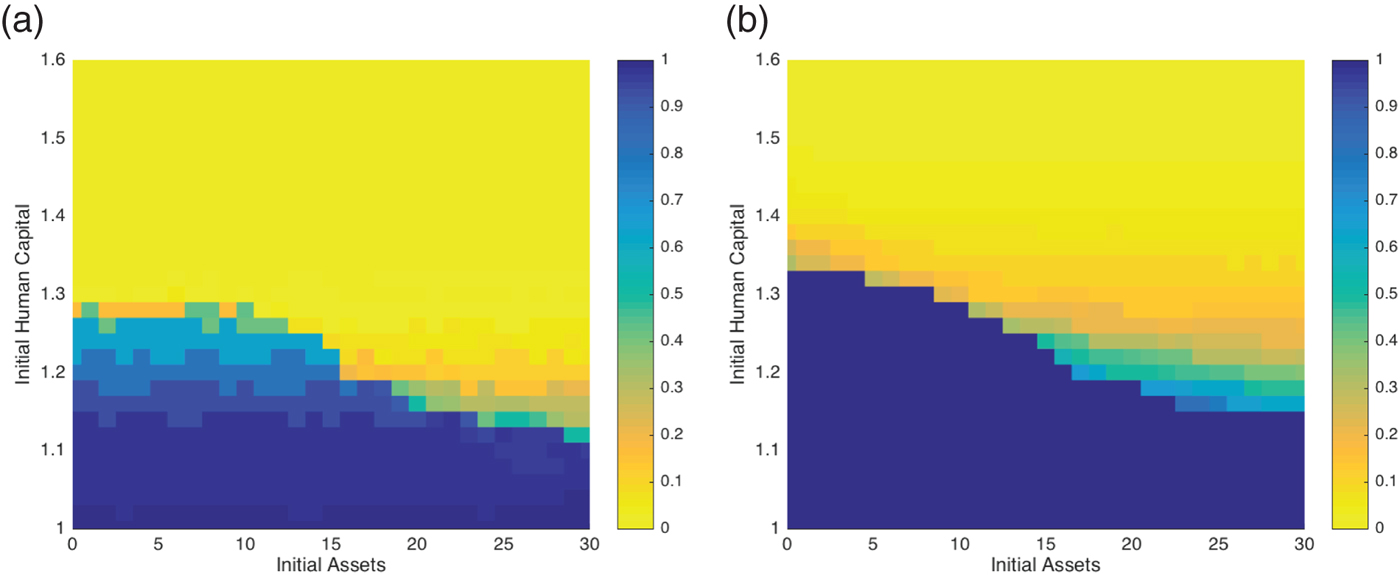
Figure 1. Chronic poverty maps: with and without endogenously evolving human capital (a) Fixed human capital (b) Endogenous human capital.
3. Targeting principles and financing mechanisms
As analyzed in the previous section, undernutrition worsens the poverty map by deepening the intergenerational transmission of poverty as the children and grandchildren of initially poor and vulnerable households tend to suffer a long-term deterioration in their realized levels of human capital. This result is strikingly illustrated in figure 1b where we see that after three generations, initially disadvantaged dynasties fall short of their potential human capabilities, whereas initially better off dynasties oscillate around the population potential level (set at 1.35 in our simulations).
The concern that long-term poverty sometimes deepens and perpetuates itself by diminishing the human capital of the next generation motivated the outpouring of both in-kind and cash transfer programs that have been largely focused on helping poor families invest in the nutrition, health and education of their children. In order to achieve these goals, in-kind transfers often limit consumer choice by providing food or education stipends directly. Similarly, cash transfer programs often come with ‘conditions’ attached requiring investments in nutrition, health and/or education. Note that at least in principle, cash or in-kind transfers could help avoid the deterioration of human capital and thereby alter poverty dynamics.
The goal of this section is to explore the impact of a stylized, means-tested, in-kind transfer program on long-term poverty dynamics in a world with risk and poverty traps. This type of program can be thought of as food aid, but it is also similar to a conditional cash transfer program that encourages investments in education and nutrition (the human capital of future generations) rather than physical capital accumulation.Footnote 5 After exploring the efficacy of such a program in terms of its impacts on the evolution of both the poverty headcount and the poverty gap, we consider the tradeoffs (in terms of the core poverty measures) that are induced if a proportion of a given social protection budget is targeted at the vulnerable rather than the destitute.
To explore these social protection tradeoffs we analyze a stylized economy comprised of D dynasties that are uniformly distributed across the domain of the endowment space shown in the preceding poverty maps. This distributional assumption is meant to illustrate the workings of the model from the full range of possible original positions. Over time, as dynasties move to the stochastic steady states associated with this model, certain portions of the endowment space will of course become less densely populated. Subsequent dynamic simulation results are then best considered as illustrations of the underlying economic mechanisms, and not as a prediction of impacts on any actually existing economy (found in mid-history).
3.1. Poverty dynamics with traditional in-kind transfers
We begin by considering a stylized social protection program that offers in-kind transfers τdgt with the following characteristics:
Means Tested: Eligible households are those for whom c dgt < z, where z is the consumption poverty line.
Contingent Transfers: Subject to budget constraints, each household receives the transfer needed to completely close the poverty gap–i.e.,
 $\tau_{dgt}=z-c_{dgt}$. Under this specification, transfers are contingent in the sense that a dynasty experiencing asset losses and hence lower consumption, will receive a larger transfer than an otherwise identical dynasty. We assume that all transfers are channeled directly into consumption, not anticipated, and hence do not influence the decision to accumulate physical capital.Footnote 6
Government Budget Constraint: The government has a fixed social protection budget, B, that is initially just large enough to close the poverty gap for all destitute households. If the budget becomes insufficient at any point in time, transfers are adjusted so all destitute dynasties receive transfers that close an equal fraction of their poverty gap.

More specifically, we define the total social protection needed at each point in time as:
 $$ \tilde{B}_{gt} = \sum_{d=1}^{D}(z-c_{dgt})1(z\gt c_{dgt}) $$
and define the available budget adequacy as  $\lambda_{gt}={B}/{\tilde{B}_{gt}}.$ If a defines administrative costs, then individual transfers are given by:
 $$\tau _{dgt} = \left\{ {\matrix{ {(1 - a_t)(z - c_{dgt})\>{\rm if}\>\lambda _{gt} \ge 1} \hfill \cr {\lambda _{gt}(1 - a_t)(z - c_{dgt}),\>{\rm otherwise}.} \hfill \cr } } \right.$$
While there is some (very) modest empirical evidence that cash or in-kind transfers spill over into investment and increase potential earnings,Footnote 7 in our simulation, we assume the transfer goes directly to consumption. Figure 2b displays the chronic poverty map for the case of perfectly targeted in-kind transfers (i.e. a = 0). For ease of comparison to the base scenario without transfers, figure 2a duplicates figure 1b. In-kind transfers do impact poverty dynamics; the area of certain chronic poverty in the southeast corner of figure 2b shrinks compared to figure 2a. Indeed, the chronic poverty map under in-kind transfers is similar to figure 1a, the chronic map when we ignored the deleterious long-term consequences of asset smoothing and undernutrition on dynastic human capital. Despite these positive impacts of transfers, vulnerability remains high in certain portions of the endowment space.
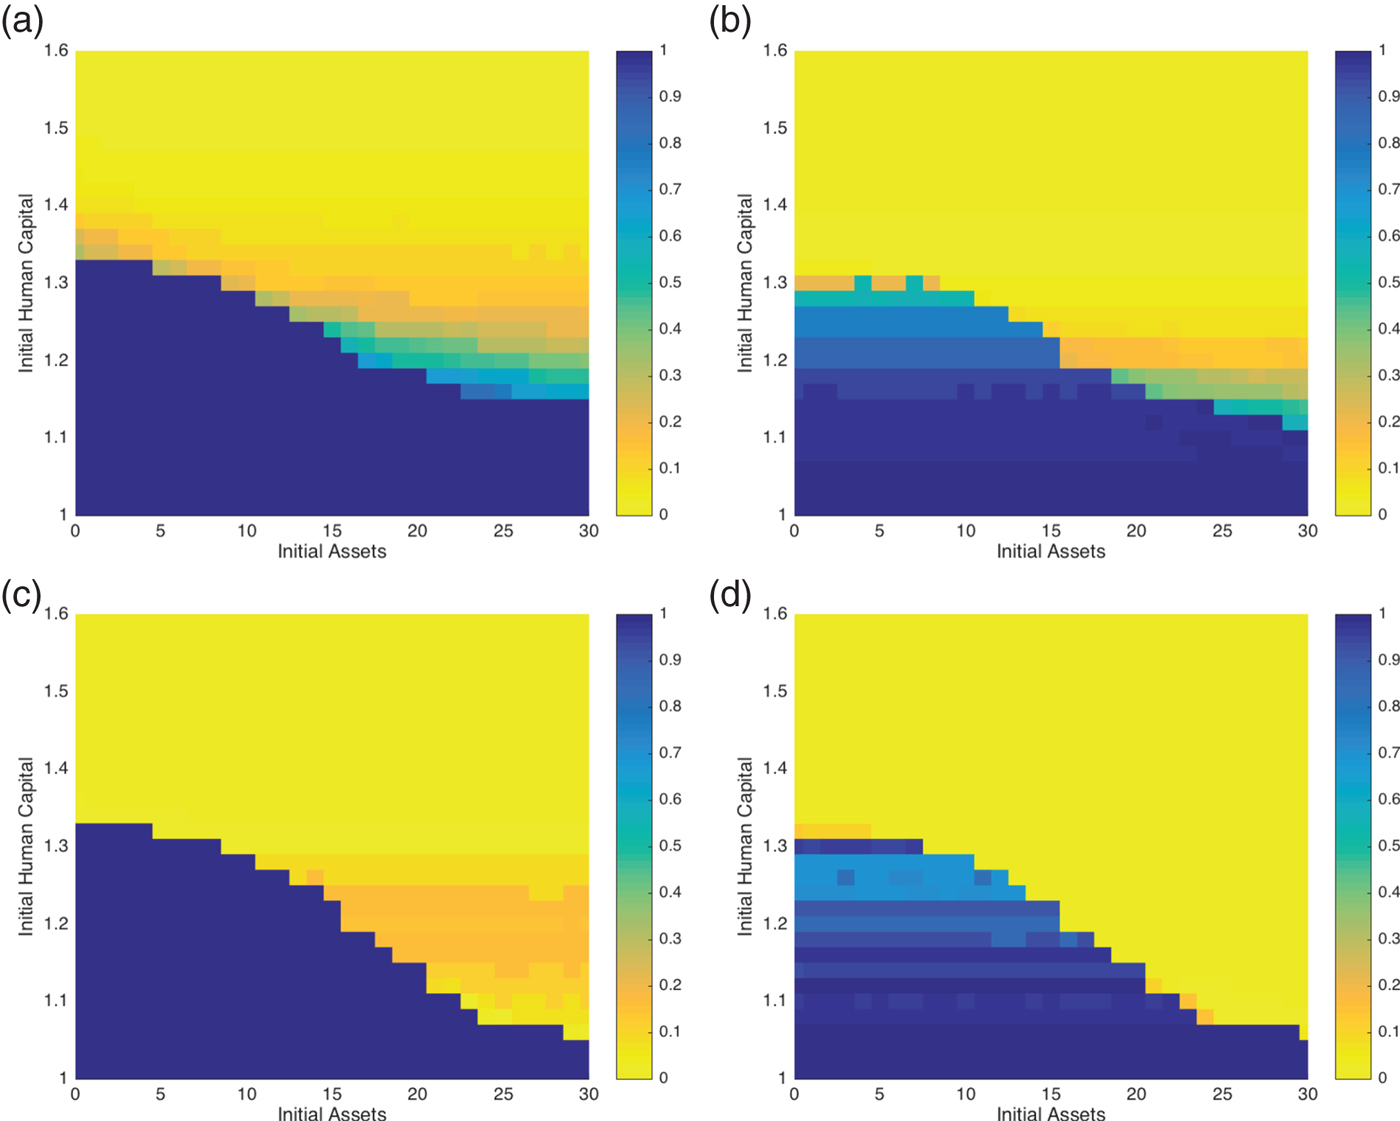
Figure 2. Chronic poverty maps with and without social protection (a) No social protection (b) In-kind transfers to destitute (c) VSP asset replacement (d) VSP subsidized insurance.
An alternative way to gauge the effectiveness of different social protection schemes is to define a set of standard poverty measures, whose evolution over time can be traced under different policies. We consider headcount and poverty gap measures using realized consumption (optimal consumption plus in-kind transfers when appropriate) defined as follows:
 $$P_{gt} = \sum\limits_{d = 1}^D {\displaystyle{{1(z > c_{dgt})} \over D}} $$
 $$G_{gt} = \displaystyle{1 \over {DH_{gt}}}\sum\limits_{d = 1}^D {(z - c_{dgt})} 1(z > c_{cgt}).$$
Note the poverty gap measure, G gt, measures the average depth of poverty across poor dynasties. For both measures we present the average across a large number of simulations.
In addition to these headcount and gap measures based on realized consumption, we can also define variants of these measures based on a dynasty's potential earnings given its current holdings of physical and human assets.Footnote 8 These potential earnings measures will of course be smoother than those based on realized consumption. Notice that since we assume the transfer goes directly to consumption, an in-kind transfer does not increase production in a given period. The potential earnings measures also allow us to see how potential earnings and economic capacity evolves under any particular policy regime.
Figure 3 traces the evolution of both measures over the course of four generations, or 100 years.Footnote 9 This shows the aggregate impact of these changes in the poverty map for the stylized population with a uniform distribution of initial endowments of physical and human assets. The top two figures display poverty measures based on realized consumption, whereas the bottom two illustrate the poverty headcount and gap measures based on potential earnings. In all figures and for each time period, the highest (solid black) line shows the poverty measures for the autarky case with no social protection, while a second dotted gray line tracks these measures for an in-kind transfer program. We will discuss the other two (lighter) lines, which correspond to alternative social protection schemes, momentarily.

Figure 3. Evolution of Poverty Measures under Social Protection (a) Headcount (realized consumption) (b) Gap (realized consumption) (c) Headcount (potential earnings) (d) Gap (potential earnings).
As illustrated by the solid black line, in the absence of social protection, poverty increases markedly upwards over generations. The dotted line shows the impact of (perfectly) targeted in-kind transfers. In-kind transfers eliminate nearly all consumption-based poverty in the short-term.Footnote 10 Over the longer term, the extent and depth of poverty drift up over time as those who have collapsed because of shocks become eligible for in-kind transfers, reducing the amount available for other indigent households. Given the fixed budget, this increase in the number of in-kind transfer-eligible households in turn pushes up the average depth of poverty. As can be seen in the lower two graphs in figure 3, in-kind transfers over the first generation have no impact on the potential earnings of the beneficiary population. This reflects our assumption that in-kind transfers are unanticipated and delivered directly as in-kind additions to consumption. Despite this increase in poverty, the simulated economy grows very modestly across the generations (as demonstrated by figure A2 in the online appendix). The increase in poverty thus does not reflect an aggregate economic collapse, but rather a process of bifurcation in which some dynasties succeed economically, while others do not.
We also see that at later generational shift points, in-kind transfers do positively impact potential earnings, thereby reducing the earnings-based poverty measures relative to the autarky case. This improvement of course reflects the intention of in-kind transfers to enhance the human capital of the next generation. Note that the poverty reduction impact of this improved human capital are relatively modest. This finding in part reflects the fact that in this model, human capital generates income only when employed in conjunction with physical assets. As the poor by definition have few physical assets, the impact of improved human capital is modest. Adding a second technology in which returns to human capital do not require physical assets would improve the economic impact of in-kind transfers.Footnote 11
3.2. Poverty dynamics under VSP asset replacement
The underlying dynamics of the system, which steadily adds individuals to the aid-eligible population, undercuts the efficacy of in-kind transfers scheme analyzed in section 3.1. In this section, we explore whether a budget-neutral, vulnerability-targeted contingent social protection policy (VSP) can further reduce chronic poverty by reducing the pernicious effects of the underlying system dynamics. There are three key elements to VSP as we model it here:
Vulnerability Targeted: Eligible households are ‘moderately vulnerable,’ which we define as the non-poor who face between a 20 and 80 per cent chance of collapsing into destitution. As with the in-kind transfer program, we assume costless and perfect targeting.Footnote 12
Triage: Under this scheme, social protection resources are triaged by first prioritizing the ‘moderately vulnerable,’ and then transferring the residual social protection budget to the already destitute. We are not advocating this as an optimal scheme, but this assumption allows us to explore the potential of VSP to alter poverty dynamics relative to a budget in-kind transfer program, which effectively has the opposite prioritization (spending money first on the destitute).
Government Budget Constraint: As before, we assume the government has a fixed social protection budget, B, that is initially just large enough to close the poverty gap for all destitute households. At any point in time in which the budget becomes insufficient, then we assume transfers are adjusted so all destitute dynasties receive transfers that close an equal fraction of their poverty gap.
The first VSP scheme we analyze issues payments to eligible (vulnerable) households any time they are hit with a shock that could potentially push them into chronic poverty. These payments are contingent on the realized state of the world, meaning these payments rise in bad years. This scheme can be considered an analogue to the restocking programs in the northern reaches of Kenya in which livestock lost to a drought are replaced by government programs. We refer to this program as VSP Asset Replacement.
We first analyze VSP asset replacement using the chronic poverty map provided in figure 2c. As expected, this figure shows the benefits of VSP asset replacement accruing largely to the moderately vulnerable. These benefits largely crowd out the benefits of the in-kind transfer for those below the original autarkic (no social protection) Micawber frontier. With the budget available for assisting these households dramatically reduced in bad years (as transfers go to vulnerable households instead), the intergenerational shifting of poverty persists.
Returning to figure 3, we see the impact of VSP asset replacement on the evolution of the extent and depth of poverty. Looking first at the potential earnings-based poverty measures, we see VSP asset replacement does a much better job than in-kind transfers in slowing the growth in the structurally poor. Over the four generations of the simulation, the headcount and poverty gap measures decline by roughly a quarter under VSP.
At the same time, the consumption-based measures shown in the top half of figure 3 reveal a consumption/production tradeoff in the well-being of the poor. Throughout the simulation, the headcount and poverty gap measures based on realized consumption are much lower for the in-kind transfer program. Put differently, using the consumption-based measures, indigent households are unambiguously better off under a social protection scheme that prioritizes their needs.
Further investigation reveals two additional insights (as shown in figure A3 of the online appendix) regarding the workings and tradeoffs of the VSP scheme. First, the VSP transfers on average eat deeply into the available budget. Second, the amount of funds needed for VSP fluctuates wildly from year to year. In bad years, in fact, VSP transfers consume the entire social protection budget, leaving nothing for transfers to the indigent such that the poverty gap skyrockets. Both of these observations suggest that even though some vulnerability targeting has some potential to improve the overall situation for the poor, there might be a better budgetary and social protection model.
Poverty dynamics under VSP insurance subsidy
The tradeoffs potentially induced by the system of VSP analyzed in section 3.2 motivate the search for alternative financing mechanisms. The VSP asset replacement scheme analyzed in section 3.2 operates like a publicly funded insurance scheme: those suffering shocks receive payments in the wake of a shock that drives them below the Micawber Frontier. This observation motivates the question as to whether VSP could be offered in the form of an insurance contract that is funded in part by beneficiary contributions to the insurance premium.
Index insurance has recently received attention as a possible resolution to the moral hazard and adverse selection problems that have historically crippled the use of insurance amongst poor populations, although such products still suffer from basis risk (for recent reviews, see IFAD (2011), Miranda and Farrin (Reference Miranda and Farrin2012) and Carter et al. (Reference Carter, de Janvry, Sadoulet and Sarris2017)). Despite being seemingly valuable to poor populations, demand for insurance products has been lower than originally expected (Gine et al., Reference Gine, Townsend and Vickery2008; Patt et al., Reference Patt, Suarez and Hess2010; Mobarak and Rosenzweig, Reference Mobarak and Rosenzweig2012; Cole et al., Reference Cole, Gine, Tobacman, Townsend, Topalova and Vickery2013; McIntosh et al., Reference McIntosh, Sarris and Papadopoulos2013; Dercon et al., Reference Dercon, Hill, Clarke, Outes-Leon and Taffesse2014; Jensen et al., Reference Jensen, Mude and Barrett2017; Cai et al., Reference Cai, de Janvry and Sadoulet2015). We recognize the challenges regarding the design of and demand for insurance, but leave deeper discussion of these issues to other work.
We consider an index-based insurance contract designed to issue payouts based on the realization of the covariant climatic shock to assets, rather than actual total losses  $\lpar \theta_{t}=\varepsilon_{t}^{c}+\varepsilon_{t}^{i}$). In this paper we assume the covariant shock,
  $\varepsilon_{t}^{c}$, is observed directly without error so that basis risk is determined solely by idiosyncratic shocks,
  $\varepsilon_{t}^{i}$, rather than contract design. In this way
  $\varepsilon_{t}^{c}$ can function directly as the index that triggers payments.Footnote 13 We denote s ≥ 0 as the strike point or index level at which insurance payments begin. We assume a linear payout function such that insurance payouts, δ, are given by:
 $$ \delta(\varepsilon_{t}^{c})=\max((\varepsilon_{t}^{c})-s),\;0). $$
Under this specification, the insurance fully indemnifies all losses driven by covariant events beyond the deductible level, s. In our model, the household now chooses the level of insurance coverage, I dgt given the insurance premium p. The budget constraint becomes:
 $$ c_{dgt} + pI_{dgt}\le A_{dgt}+f(A_{dgt}, H_{dgt}) $$
and future assets update according to:
 $$ A_{dgt+1} = \lsqb f(A_{dgt},H_{dgt})+(1-\theta_{dgt+1})A_{dgt}\rsqb -c_{dgt}+\lsqb \delta(\varepsilon_{t}^{c})-p\rsqb I. $$
Janzen et al. (Reference Janzen, Carter and Ikegami2017) explore the demand for index insurance using a variant of the model presented here. Intuitively, we might expect the vulnerable to voluntarily purchase insurance as they have the most to gain. As Janzen et al. (Reference Janzen, Carter and Ikegami2017) detail, while it is correct that insurance is highly valuable to vulnerable households, it is also the case that these households are the most liquidity-constrained, and incremental assets are highly valuable (as a form of protection) for these households. Note that it becomes optimal for these vulnerable households to purchase insurance as soon as they build up their asset stocks. In the end, the long-run prospects of vulnerable households is substantially changed by the availability of insurance. It does not, however, completely eliminate their vulnerability.
Because the unwillingness of the vulnerable to purchase insurance is primarily driven by liquidity constraints, it may be suspected that their demand would be highly price elastic and sensitive to partial subsidization of insurance. Janzen et al. (Reference Janzen, Carter and Ikegami2017) confirm this intuition. When subsidies cut the cost of insurance in half, demand by the vulnerable responds rapidly, with implied gains in reduced vulnerability. This insight suggests the vulnerable may be able to foot some substantial portion of the bill for their own social protection that might eventually benefit the already destitute. In addition, the government's share of an insurance contract would be smooth over time, unlike the VSP asset replacement program considered in the prior sub-section.
Building on this intuition, we consider the impact now of a mixed VSP insurance scheme that relies on insurance mechanisms and a mixed public-beneficiary funding model. As before, we assume the three key elements of VSP (vulnerability-targeted, triage, and a fixed government budget constraint). In contrast to VSP asset replacement transfers, we here assume the government offers a 50 per cent subsidy on the purchase of insurance for all eligible households. Any remaining budget after providing insurance subsidies to the vulnerable is used to provide in-kind transfers to destitute households.
The impact of this scheme is demonstrated by the chronic poverty map presented in figure 2d. The poverty map reveals a Pareto improvement over the alternative social protection policies. Because individuals purchasing insurance anticipate the protection it will provide in the event of adverse events, the Micawber Frontier shifts to the southwest, and dynasties become more willing to invest (what we call the ‘risk reduction dividend’). When combined with the fact that insurance helps brake the descent of the vulnerable into poverty, this risk reduction dividend leads to substantial drops in both the extent and depth of poverty over the long-run, as shown in figure 3. Appendix figure A2 shows that the combined impact of these forces is a substantial growth in GDP, which ends up some 20 per cent higher under this insurance-based social protection scheme than it did under the budget neutral in-kind transfer scheme.
All this said, figures 3a and b reveal an intertemporal tradeoff in the well-being of the poor using the consumption-based measures of poverty. For at least the first ten years of the simulation, there are fewer poor households under a pure in-kind transfer scenario and the depth of poverty is also lower. From year 10 onward, the insurance scheme catches up–the headcount is lower under the VSP insurance scheme and the depth of poverty is fairly similar. This tradeoff creates a potential conundrum for policymakers.
The differences between the insurance scheme and the VSP asset replacement scheme is visible not only in figure 3, but also in figure A3 of the online appendix, which presents the budgetary implications of the various policies. The budgetary draw down of the VSP insurance scheme is both lower and more stable than the requirements of the VSP asset replacement program. These savings are of course good for destitute dynasties, and for the future human capital of their children.
4. Stress testing VSP with increased climate risk
The global poor and vulnerable are exposed to an ever-evolving portfolio of risk. New risks can arise from socioeconomic and labor market changes, environmental changes (for example through soil degradation), and climate change, among others. Climate change, in particular, will affect both temperature and rainfall, and therefore drought and flood risks–two major risks for farmers. Winsemius et al. (Reference Winsemius, Jongman, Veldkamp, Hallegatte, Bangalore and Ward2015) calculate the extent to which poor populations are disproportionately affected by the increasing risk of floods and droughts that are projected to occur with climate change. While results vary by country, across sub-Saharan Africa they consistently find poor populations are disproportionately exposed to increases in climate risk.
Climate change thus raises the stakes for VSP through heightened risk and increased vulnerability. On the one hand, we may suspect that increased risk and vulnerability will enhance the gains made possible with vulnerability-based targeting and an insurance-based financing mechanism. On the other hand, increased risk will slowly raise the price of insurance, suggesting an increase in the risk load may erode the efficacy of the insurance-based VSP policy. In this section we will ‘stress test’ this policy to see if it is robust to increases in climate risk.
To analyze the effect of increasing risk, we assume the climate shifts discretely with the changing of each generation in our model. For simplicity, we also assume each generation knows exactly the climate risk it faces and re-optimizes, adapting consumption and investment rules to the new risk scenario. While obviously unrealistic, these assumptions allow us to look carefully at the impacts of climate change, or other increases in risk exposure.Footnote 14 Insurance is also re-priced to conform to the new risk levels at each generational transition.Footnote 15 However, no generation anticipates the further deterioration in climate that will take place and be confronted by its children, grandchildren, etc. While this latter assumption departs somewhat from the economist's usual rational expectations specification, it does not seem highly unrealistic in this case.
Figure A1 of the online appendix presents the assumed parameters of the stochastic mortality or asset depreciation shocks faced by dynasties under the alternative climate scenarios. As described previously, the base case (generation 1) scenario is meant to represent the extent and severity of risk faced by pastoralist households circa 2,000, where we generate a discretized approximation of the livestock mortality data from northern Kenya used in the analysis of Chantarat et al. (Reference Chantarat, Mude, Barrett and Carter2013). The other three scenarios (generations 2–4) present a stress test for the different social protection schemes with increasing climate risk. Our calibrated baseline assumptions imply droughts occur 20 per cent of the time (here, a drought is defined by any negative losses). Relative to baseline, we assume drought risk rises 31 per cent (from a 19 per cent to a 25 per cent risk) in generation 2, increases by a total of 68 per cent in generation 3 (from 19 per cent to 32 per cent) and finally by a total of 100 per cent in generation 4 (from 19 per cent to 38 per cent). In addition to this aggregate drought probability, we also assume the severity of drought events creeps up over time.
To put these numbers in perspective, it is useful to compare them to drought projections reported in Prudhomme et al. (Reference Prudhomme, Giuntoli, Robinson, Clark, Arnell, Dankers, Fekete, Franssen, Gerten, Gosling, Hagemann, Hannah, Kim, Masaki, Satoh, Stacke, Wada and Wisser2014). These authors assemble a set of projections by combining simulation results from various climate change models coupled with multiple hydrological impact models that transform climate predictions into drought predictions under different assumptions about the increases in atmospheric carbon. Under the most severe assumptions (representative concentration pathway RCP8.5), they find that by the conclusion of the 21st century (specifically, 2070–2099), some global regions will have experienced a 60 per cent increase in the probability of drought occurrence relative to the final quarter of the 20th century (specifically, 1975–2005). These assumptions are similar to our generation 3 assumption, while Prudhomme et al. (Reference Prudhomme, Giuntoli, Robinson, Clark, Arnell, Dankers, Fekete, Franssen, Gerten, Gosling, Hagemann, Hannah, Kim, Masaki, Satoh, Stacke, Wada and Wisser2014) also find that a broader swatch of areas will experience drought increases in the range of 20 to 40 per cent, similar to our generation 2 assumption. As these authors stress, there is substantial model variability around these mean predicted changes.Footnote 16 In rough terms, our stress test through generation 3 shows what might happen in the most severely affected regions, while generation 2 captures the climate risk that might affect those regions suffering intermediate impacts under RCP8.5. The generation 4 results can be considered an extreme stress test in which increases in drought risk exceed even the most pessimistic current predictions.
In the appendix we show how increasing climate risk of this sort shifts the Micawber Frontier to the northeast and causes a deterioration of the chronic poverty maps after three generations under all policy scenarios. Rather than focus on these maps for each policy scenario, figure 4 traces out the impact of climate change using the consumption-based poverty measures introduced earlier. The first generation results are as in figure 3 above, while climate change kicks in beginning with the second generation (year 26 and beyond). The budget is held fixed for comparison with the baseline scenario.Footnote 17 As can be seen, without social protection, both the poverty headcount and poverty gap measures worsen substantially in this stylized system in which risk is a major driver of poverty.
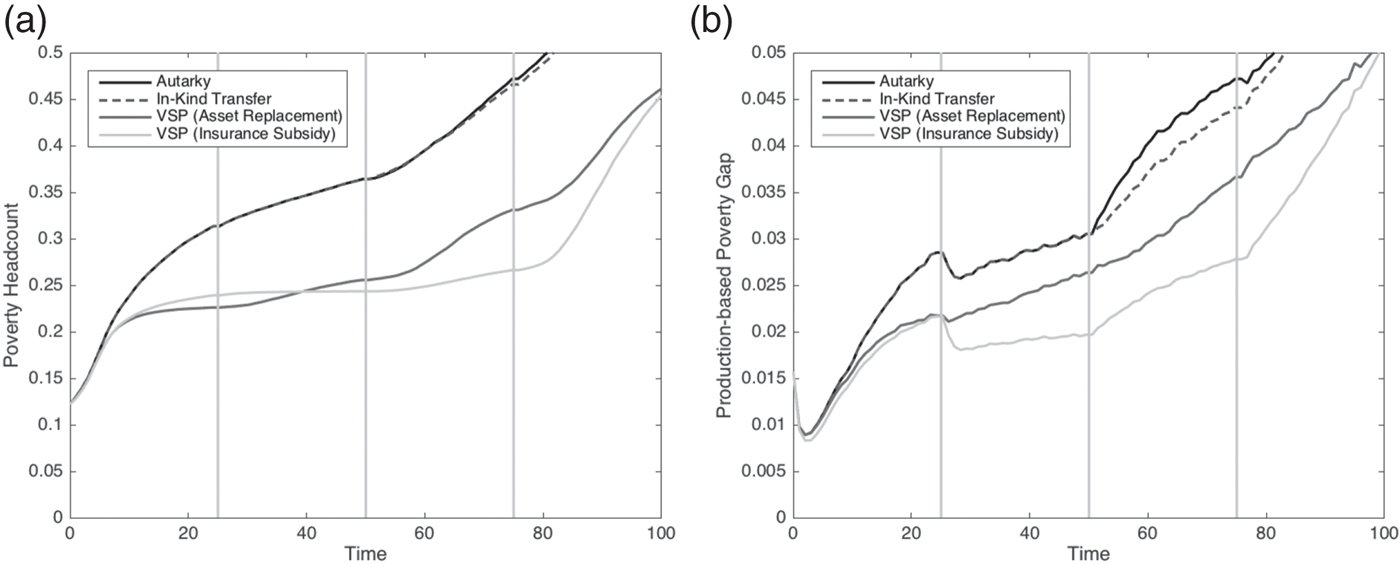
Figure 4. Climate Change & Poverty Dynamics under Alternative Social Protection Scenarios (a) Headcount under Climate Change (b) Poverty Gap under Climate Change.
Importantly, under the climate change scenario, in-kind transfers become much less effective than the insurance-based subsidy scheme. Whereas without increases in climate risk the insurance-based scheme modestly outperformed in-kind transfers, under increased climate risk the insurance-based scheme has poverty rates and gaps that are roughly half those of the budget neutral in-kind transfer scheme. Interestingly, the insurance-based VSP policy holds up quite well to increased climate risk under the generation 2 and 3 scenarios, although the depth of poverty starts to climb under the generation 3 scenario.Footnote 18 If we step beyond current worst-case scenario predictions and look at the generation 4 scenarios, we see that even the insurance-based VSP begins to lose its effectiveness as poverty headcounts begin to climb sharply.
5. Conclusion
Climate-based risk and vulnerability have long been seen as key drivers of poverty, particularly in many rural areas of the developing world. In this paper, we have developed a dynamic stochastic programming model of such an area. In such a model, the relatively poor, but vulnerable, will tend to ‘asset smooth.’ That is, they choose to absorb a larger fraction of any realized climate shocks through reduced consumption. Unlike prior models, our analysis has drawn out the full consequences of this behavior by the vulnerable through incorporating the long-term impacts of consumption shortfalls (induced by the optimal asset smoothing coping behavior of the vulnerable) on the human capital and long-term well-being of multi-generational family dynasties.
We then explore how best to control poverty by a budget-constrained program of social protection. We first show that a standard program of conditional in-kind transfers, which target only the destitute but not the non-poor vulnerable, helps protect against the intergenerational transmission of poverty caused by asset smoothing. However, the program has limited efficacy in the medium run as the ranks of the destitute grow, diluting the amount of cash available for each poor household.
We then show the long-term level and depth of poverty can be improved by incorporating elements of ‘Vulnerability-targeted Social Protection’ (VSP) into a national system of social protection. As modeled here, the first VSP program we considered (asset replacement) effectively operates as a restocking program, replacing the assets of the vulnerable population so that they retain the ability to be non-poor into the future. However, these VSP asset replacement payments, if publicly funded from the same fixed social protection budget, imply less funds for in-kind transfers targeted at the destitute. Moreover, the budgetary requirements of VSP asset replacement payments vary sharply across years. In the worst years, they in fact absorb almost all the social protection budget, leading to a sharp uptick in the average depth of poverty amongst the poor.
In an effort to mediate this tradeoff between the well-being of the destitute and the need to keep the number of destitute from rising, we then explore the degree to which an insurance mechanism can be used to implement VSP. Using this mechanism not only allows the public sector to smooth its spending on helping the vulnerable, it also opens the door to having the vulnerable pay a portion of their own social protection. While empirical demand for insurance in a variety of contexts has been modest, we have shown in other work (Janzen et al., Reference Janzen, Carter and Ikegami2017) that demand by vulnerable households is highly price elastic. That is, the demand for insurance by the vulnerable responds strongly to partial price subsidies.
Exploiting these insights, we then study the impact of having the public sector fund 50 per cent of the cost of a market-based insurance scheme for vulnerable households, while the other 50 per cent is paid for privately by insured beneficiaries. Subsidies are again paid out of the fixed social protection budget. Unlike the simple VSP asset replacement program, after the first few years of the simulation, insurance-based VSP performs at least as well on poverty metrics as the in-kind transfer system. It also results in higher levels of investment and 20 per cent higher GDP in the simple model economy.
Finally, we analyze what happens when climate change increases the frequency and severity of shocks. While our baseline climate and risk scenario was calibrated on northern Kenya circa 2,000, allowing for the sorts of changes expected with climate change shows the insurance-augmented social protection scheme strongly outperforms the budget neutral in-kind transfer scheme. Over the range of increasing climate risk that is consistent with the current worst case projections about drought risk, we find poverty headcounts and gaps are some 50 per cent lower under the insurance augmented social protection scheme compared to a standard in-kind transfer system. However, were drought frequency to climb even higher than predicted for the late 21st century, then even the insurance-based system loses its ability to prevent a swelling in the number of destitute households. The effectiveness of insurance-based vulnerability-targeted social protection thus survives a stress test motivated by current worst case scenario projections for the next century, but its efficacy begins to collapse at stress levels beyond those projections.
These results all emerge from a highly stylized model, and ignore some of the challenges that arise with designing index-based insurance contracts that minimize basis risk: marketing insurance to often illiterate and innumerate populations, implementing complex public private partnerships in weak and often corrupt environments, and perfect targeting. Nonetheless, these results do strongly call our attention to the often overlooked intertemporal tradeoff between the well-being of the poor in the present versus their well-being in the future. They suggest that diverting some budget toward protecting the vulnerable non-poor may pay off big dividends in terms of reduced poverty rates, especially as climate change increases vulnerability.
SUPPLEMENTARY MATERIAL
The supplementary material for this article can be found at https://doi.org/10.1017/S1355770X17000407.
Acknowledgements
The authors wish to thank the World Bank for financial support, and Harold Alderman, Mook Bangalore, Stephane Hallegatte, Rasmus Heltberg, Peter Lanjouw, Matthew McLaughlin, Emmanuel Skoufias, Adrien Vogt-Schilb, Steve Vosti, participants at the World Bank Climate Change and Poverty Conference, the Midwest International Economic Development Conference, and the Georgia State University Center for the Economic Analysis of Risk's Food Security and Sustainable Supply Chains Workshop, and seminar audiences at Michigan State University and the University of Washington for helpful comments. All errors are our own.


