


1 Introduction
Environmental economics demonstrates that the quality of the environment is correlated with economic growth in the long term. On the one hand, some existing studies suggest that economic growth affects environmental quality. The Environmental Kuznets Curve (EKC) illustrates that there is an inverted-U shaped relationship between environmental pollution and income level (Grossman and Krueger, Reference Grossman and Krueger1991, Reference Grossman and Krueger1995; Selden and Song, Reference Selden and Song1994; Galeotti and Lanza, Reference Galeotti and Lanza2005; Destek and Sarkodie, Reference Destek and Sarkodie2019). However, other studies oppose this inverted-U shaped relationship. Pfaff et al. (Reference Pfaff, Chaudhuri and Nye2004) and Cohen et al. (Reference Cohen, Stelcer, Hawas and Garton2004) provided evidence that there is a U-shaped and N-shaped relationship between income level and environmental quality, respectively. In particular, in China, they demonstrated that decreasing air quality and fast economic growth have had a linear relationship since the 1978 Reform and Opening Up (De Groot et al., Reference De Groot, Withagen and Minliang2004; Shen, Reference Shen2006; Brajer et al., Reference Brajer, Mead and Xiao2008, Reference Brajer, Mead and Xiao2011). However, other studies suggest that environmental quality influences economic growth. Brakman et al. (Reference Brakman, Garretsen and Van Marrewijk2001) implied that environmental deterioration reduces industrial agglomeration in the context of the classical core and periphery theory. Marrewijk (Reference Marrewijk2005) argued that the agglomeration of economic activity tends to become less attractive if the problem of pollution arises, and Lange and Quaas (Reference Lange and Quaas2007) suggested that the extent of agglomeration crucially depends on the damage caused by local pollution.
However, the aforementioned studies present a correlation rather than a causal relationship between economic growth and environmental pollution in the long term. There is limited literature on the relationship between air quality and economic development in the short term, and it is unclear how human economic activities affect air quality in the short term, especially in Chenery's late industrialization stage in developing countries. In theory, Grossman and Krueger (Reference Grossman and Krueger1995) pointed out that with the development of industrialization, clean technology replaces technologies which would generate more pollution, and heavy industries gradually shift to service industries and, therefore, pollutant emissions have been reduced and the environmental quality is improved. Nevertheless, such a theoretical hypothesis has not been proved by empirical research as most of the research suffers from severe endogeneity problems. The outbreak of COVID-19 provides an opportunity to examine the impact of gradual economic recovery on air quality in China in the short term.
The spread of COVID-19 has pressed a stop button for economic activities. Since the control of COVID-19 in China, economic activities have gradually restarted. This paper utilizes the outbreak of COVID-19 to explore the correlation between economic activities and the quality of the environment with the data from 1012 air quality monitoring stations in 233 cities in China.
With the subsiding of the epidemic, 30 provinces – not including Hubei province – in China have gradually resumed work and production by implementing less strict restriction policies directed by the provincial governments in China since February 10, 2020. The work resumption in Hubei province, the center of the pandemic, was postponed until March 10, 2020, and thus could be utilized as the control group by employing a difference-in-differences (DID) method to study the impact of work resumption on air quality. This paper merges the data on air quality from different sites and weather conditions in cities using the cities’ code. We find that the resumption of work and production leads to an increase in the air quality index (AQI) by 7.226 (equivalent to a rise of 11.28 per cent relative to the baseline mean). Similarly, work resumption also leads to an increase in PM2.5 by 5.323 μg/m3, in PM10 by 6.19 μg/m3, and in NO2 by 4.584 μg/m3, equivalent to a rise of 12.47, 10.49 and 23.64 per cent relative to the baseline mean respectively. The estimation is robust by altering the sample size and using the propensity score matching difference-in-differences (PSM-DID) method. We also find that the air quality of cities with larger size of population, less proportion of secondary industry, and decentralized heating system decreases significantly after resumption of work. Moreover, the intracity migration is a potential mechanism to interpret the correlation between the resumption of work and production and air quality.
Our study makes four primary contributions. First, it contributes to the literature regarding the relationship between economic development and the environment. This paper provides an estimation of the impact of work resumption on air quality after COVID-19 in China in the short term, which to some extent alleviates the endogeneity problems between economic development and environmental protection existing in most of the current literature. Our analysis treats the observations from Hubei province as the control group, where the work resumption took place on March 10, 2020 (much later than in other provinces).
Second, we supplement the literature on the cause of haze (He, Reference He2009; Auffhammer and Kellogg, Reference Auffhammer and Kellogg2011; Liang et al., Reference Liang, Zou, Guo, Li, Zhang, Zhang, Huang and Chen2015; Fu and Gu, Reference Fu and Gu2017).Footnote 1 This paper provides evidence suggesting that the population flow, which is brought about by the resumption of work and production, might be one of the main sources of smog and, thus, we offer a new insight on the cause of haze.
Third, this paper contributes to the studies working on COVID-19. Most papers focus on the infectivity of the pandemic (Alvarez et al., Reference Alvarez, Argente and Lippi2020; Anderson et al., Reference Anderson, Heesterbeek, Klinkenberg and Hollingsworth2020; Bai et al., Reference Bai, Yao, Wei, Tian, Jin, Chen and Wang2020; Chinazzi et al., Reference Chinazzi, Davis, Ajelli, Gioannini, Litvinova, Merler, Pastore y Piontti, Mu, Rossi, Sun, Viboud, Xiong, Yu, Halloran, Longini and Vespignani2020) and the destructive impacts of the outbreak on the economy or human mobility (Alon et al., Reference Alon, Doepke, Olmstead-Rumsey and Tertilt2020; Atkeson, Reference Atkeson2020; Baker et al., Reference Baker, Farrokhnia, Meyer, Pagel and Yannelis2020; Bartik et al., Reference Bartik, Bertrand, Cullen, Glaeser, Luca and Stanton2020; Cao et al., Reference Cao, Fang, Hou, Han, Xu, Dong and Zheng2020; Guerrieri et al., Reference Guerrieri, Lorenzoni, Straub and Werning2020; Zhang et al., Reference Zhang, Luo and Zhu2021). The paper focuses on the economic production and human mobility after the COVID-19 epidemic subsided and provides a new perspective on the environmental impact of the epidemic.
Fourth, this paper provides a reference for policy-makers that pollution should be reduced to the largest extent by improving economic efficiency to maintain a sustainable development given the tough trade-off between economic development and environmental protection.
The remainder of this paper is organized as follows. Section 2 provides the background on work resumption and our hypotheses. Section 3 introduces the identification strategy and the data. Section 4 presents the empirical results, and section 5 concludes.
2 Background on work resumption and theoretical hypothesis
2.1 Background on work resumption
Since the outbreak of COVID-19, the Chinese government has implemented prevention and control measures requiring social isolation. From January 23–25, 2020, 30 provinces and autonomous regions (except for Hong Kong, Macao, Taiwan, and TibetFootnote 2) launched the first-level public health emergency response.Footnote 3 Figure 1 demonstrates that all provinces in China have been influenced by the COVID-19 pandemic, and the number of COVID-19 cases are collected by the Chinese Center for Disease Control and Prevention (China CDC). Notably, Hubei province, where Wuhan is the capital city, is the epicenter of the epidemic. The accumulated confirmed cases and deaths in Hubei province accounted for 83 and 96 per cent of the total amount in China on March 10, 2020, respectively (according to the data released by China CDC). The number and the distribution of urban infections in Hubei province (according to China CDC) are presented in online appendix table A1 and figure A1. They suggest that cities, except for Shennongjia, have also gradually implemented lockdown measures since January 23, 2020, when Wuhan initially implemented the lockdown policy, because of the severity of the epidemic. To reduce the spread of the virus, the Hubei provincial government put forward the policy for preventing virus transmission to other provinces as well as within Hubei province. In contrast, the policy of other provinces emphasized the prevention of the inflow of the virus. Almost all citizens were required to stay at home as long as possible and decrease the frequency of outdoor activities to reduce the risk of infection. As a result, most enterprises and public institutions were unable to carry out production and operation activities.

Figure 1. Accumulated confirmed COVID-19 cases by province on March 10, 2020.
Notes: This figure presents the geographic distribution of accumulated confirmed cases in different provinces in China on March 10, 2020. The map is plotted with ArcGIS 10.7.
To prevent the spread of the epidemic, 30 provinces – not including Hubei – issued policies about resuming work and production from January 30 to February 3, and the documents required that the time of resuming work and production should not be earlier than 24:00 on February 9. When COVID-19 subsided owing to suitable control measures, the State Council published the Notice on Strengthening the Scientific Prevention and Control of COVID-19 and Resuming Work and Production in an Orderly Manner on February 8. This document states that each provincial government should promote orderly returning to work in batches of workers, and plan for work and production resumption with classifications and batches. The important industries in the national economy and people's livelihood, such as epidemic prevention and control, energy supply, transportation and logistics, production of medical supplies, food and other daily necessities, and market circulation and sales, should be resumed as soon as possible. Subsequently, 30 provinces began to resume work and production as requested by the policy on February 10, 2020, whilst Hubei province was postponed to March 10, 2020, given the severity of the pandemic. Thus, we treat 30 provinces as the treatment group and treat Hubei province as the control group. However, some cities, such as Wenzhou and Shihezi, chose to resume work and production on February 17 and February 15 respectively,Footnote 4 hence we drop the observations from these cities in the baseline estimation. The time of work and production resumption in provinces and some cities are shown in online appendix table A2.
2.2 Theoretical hypothesis
The basic livelihood industries have started to resume production since February 10, 2020. The express delivery companies, such as STO, ZTO, YTO, and Yunda, and commercial service enterprises, such as banks and insurance companies, returned to normal operation on February 10, 2020. In the manufacturing industry, over 76 per cent of enterprises that produce masks, 77 per cent of protective clothing enterprises, 94.6 per cent of grain processing enterprises, and 57.8 per cent of coal mines resumed work.Footnote 5 According to the National Bureau of Statistics, the cumulative growth rate of industrial value-added in 30 provinces and cities decreased by 11.77 per cent on average, while the index in Hubei province dropped by 46.2 per cent from January to February in 2020.Footnote 6 By decomposing the EKC (Grossman and Krueger, Reference Grossman and Krueger1995), the scale effects of work resumption may bring about increasing emissions of pollutants.
Thus, given that the clean technology and industrial restructuring can hardly fully improve air quality in the late stage of industrialization, we propose hypothesis 1: the resumption of work and production leads to a decline in air quality outside Hubei province.
The lockdown policy in Hubei province restricts the movement of people and reduces air pollution (He et al., Reference He, Pan and Tanaka2020). The resumption of work and production increases human mobility between workplaces and residences. The increasing human mobility, together with longer commuting time and more emissions from vehicles, leads to a deterioration in air quality (Cai and Xie, Reference Cai and Xie2007). Figure 2 demonstrates that the intracity migration intensity outside Hubei province has increased significantly, whilst the others have remained at the previous level in Hubei province since February 10, 2020.

Figure 2. Population flow within cities in Hubei province and non-Hubei provinces, 2020.
Notes: The data on migration intensity were obtained from the Baidu Migration Map. We calculate the mean of the intracity migration intensity in Hubei province and outside Hubei province.
Therefore, we propose hypothesis 2: that the resumption of work and production leads to an increase in human mobility outside Hubei province.
3 Data and empirical strategy
3.1 Data
In this study, data on air quality and pollutants (i.e., AQI, PM2.5, PM10 and NO2) are derived from the Real-time Release Air Quality Platform in the China National Environmental Monitoring Center. The data are recorded every hour. We construct four alternative dependent variables by calculating the mean of AQI, PM2.5, PM10, and NO2 from 1012 monitoring stations every day from January 24 to March 9, 2020. Each city has 2 to 12 monitoring stations.
Weather data are derived from the US National Oceanic and Atmosphere Administration, and contains data on the city-level temperature, barometric pressure, wind velocity, wind direction, and cloudage of 389 weather monitoring stations. Due to the inconsistency of weather condition sites and air quality monitoring stations, we summarize the weather data at the city level. Data on the human migration index are taken from the Baidu Migration Database, which covers the data on the index of inflows, outflows and within-city movement of 233 cities in China. We merge all the aforementioned data together according to the city code and date. Table 1 reports the descriptive statistics.
Table 1. Summary statistics

Notes: AQI denotes the air quality index, taken from the Chinese Environmental Monitoring Department. PM2.5 and PM10 are the concentration of particulate matter with a diameter of 2.5 and 10 μm per cubic meter of air respectively. NO2 denotes the concentration of NO2 per cubic meter of air. Temperature is the daily average temperature. Barometric pressure denotes the air pressure relative to Mean Sea Level. Wind Direction is the angle, measured in a clockwise direction, between the north and the direction from which the wind is blowing. Wind velocity denotes the rate of horizontal travel of wind relative to a fixed point. Cloudage denotes the fraction of the total celestial dome covered by clouds or other obscuring phenomena. Inflow Index, Outflow Index and Within-city Flow Intensity, taken from the Baidu Map Location Based Service, are the index of the proportion of the population who move into the city, move out of the city, and travel within the city, respectively.
3.2 Empirical strategy
This paper employs the DID method to capture the impact of work and production resumption on air quality. We treat 33 monitoring sites in 13 cities in Hubei provinceFootnote 7 as the control group, and 979 monitoring sites in 220 cities outside Hubei province as the treatment group. The main identification strategy in this paper is:

where ${y_{ijt}}$ represents the air quality of monitoring station i in city j in period t. The variable treatj is a dummy variable that equals one if the city starts to resume work and production outside Hubei province, and zero if the city belongs to Hubei province. Specifically, we drop the cities of Wenzhou in Zhejiang province and Shihezi in Xinjiang province, where the date of work and production resumption was not February 10, 2020. The variable postt is a dummy variable that equals one if t is after February 9, 2020, and zero otherwise. The coefficient ${\beta _1}$
 of the interaction term ${\rm{treat}} \times {\rm{post}}\;$
 captures the treatment effects. We include weather characteristics, ${X_{jt}}$
 , to control the weather conditions in city j at time period t. ${\varepsilon _{ijt}}$
 is the error term.
4 Empirical results
4.1 Baseline estimation results
The baseline estimation results are reported in table 2. Column (1) shows that AQI outside Hubei province increased by 8.108, which improved by 13 per cent compared with the average level with inclusion of monitoring sites and time fixed effects. By adding control variables of weather characteristics in column (2), the treatment effect of work resumption on air quality fell but is still significant at the level of 5 per cent. In columns (3) to (5), we use PM2.5, PM10 and NO2 as alternative dependent variables, which increased by 5.323 μg/m3, 6.19 μg/m3 and 4.584 μg/m3, respectively. The results suggest that air quality outside Hubei province may become worse as work resumption keeps going on, in support of hypothesis 1.
Table 2. The effects of work resumption on air quality
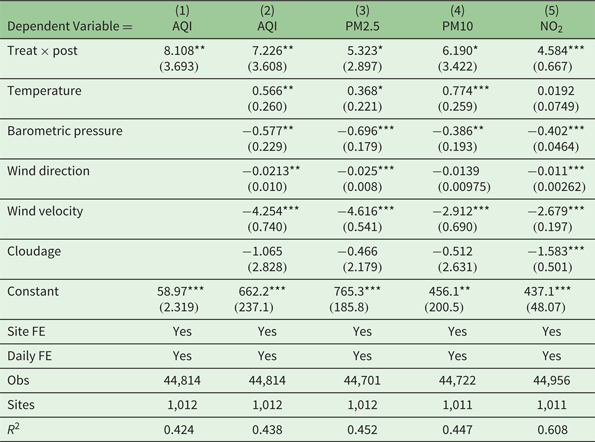
Notes: Table 2 contains results using OLS regression of major indicators of air pollution, including AQI, PM2.5, PM10 and NO2. Columns (1) and (2) report the results of AQI as the core dependent variable without and with control variables, respectively. Columns (3)–(5) show the results of PM2.5, PM10 and NO2 as dependent variables with control variables, respectively. Robust standard errors are shown in parentheses. Standard errors are clustered by city. *, ** and *** denote significance levels at 10%, 5% and 1% respectively.
For control variables, air quality is positively related to temperature whilst negatively related to barometric pressure, wind direction and wind velocity. The results are consistent with Fu and Gu (Reference Fu and Gu2017) and Li et al. (Reference Li, Liu, Purevjav and Yang2019).
In addition, we redefine the wind direction as upwind, downwind and others, named wind orientation, which represent the economic significance of wind direction. The definition of wind direction is in the online appendix, figure A2 and table A3, and the specific results are presented in online appendix table A4. We find that the coefficient relating to wind orientation is positive and insignificant, which implies that the air quality monitoring station located in a downwind place may not be significantly affected. The estimations of treatment effect are consistent with table 2.
We now turn to check two assumptions of estimation strategy. One important question regarding the validity of our empirical strategy is the common trend. We provide evidence from three aspects.
First, we provide figures on the raw data of air quality. We calculate the average of AQI, PM2.5, PM10 and NO2 at the weekly level, which are presented in figure 3. Panels A and B illustrate that AQI and PM2.5 of the treatment group are slightly lower than that of the control group before work and production resumption, but the downward trend in both groups is consistent. Panel C illustrates that the amount and trend of PM10 of the treatment group are consistent with that of the control group before resumption. Panel D shows that NO2 of the treatment group is slightly higher than that of the control group, but the trend is consistent before resumption. Figure 3 suggests that we confirm the common trend before resumption and outside Hubei province air quality is declining after resumption.

Figure 3. The common trend test.
Notes: 8-week window is included. Week 0 is defined as the week of resumption.
Second, we analyze the dynamic effects of work resumption on air quality. We extend the data sample one week forward and backward based on the date of resumption and conduct the regression analysis using equation (1) at the weekly level. Panel A of figure 4 focuses on the dynamic effects of comprehensive AQI. The results suggest that the AQI of monitoring sites in the 30 provinces outside Hubei province and in Hubei province has no significant differences before February 10, 2020, which confirms the common trend again before work resumption of non-Hubei provinces. After work resumption, compared with Hubei province, the AQI of non-Hubei provinces increases significantly. Notably, air quality has not deteriorated further with the pace of resumption of work. It is possible that the epidemic has promoted the large-scale application of environmental protection technologies in enterprises.

Figure 4. The effect of work resumption on air quality over time.
Notes: We use the week before the lockdown as the benchmark, and present the dynamic effects of AQI, PM2.5, PM10 and NO2. Hubei province began to restart in the fourth week (a4) after February 10, 2020.
In panels B and C of figure 4, we present the results of PM2.5 and PM10, respectively. The results are similar to panel A and the concentration of PM2.5 and PM10 rises more than 10 μg/m3. Panel D suggests that the concentration of NO2 gradually increases with the resumption of work. After the resumption of work in Hubei province, the difference between the 30 provinces and Hubei province begins to shrink. This result is consistent with the results in figure 2, indicating that the emissions caused by automobiles invoked by human mobility might be an important source of pollution.
Third, we further explain that the common trend holds up, which seems to be inconsistent with some studies (Almond et al., Reference Almond, Du and Zhang2020; Liu et al., Reference Liu, Kong and Kong2020). First, Almond et al. (Reference Almond, Du and Zhang2020) and Liu et al. (Reference Liu, Kong and Kong2020) chose the sites or cities themselves in 2019 as the control group and those in 2020 as the treatment group, while we choose the sites in Hubei province as the control group and other sites outside of Hubei province as the treatment group. Second, Almond et al. (Reference Almond, Du and Zhang2020) found that the magnitudes of decline in NO2 in China, Hubei province, and the neighboring provinces of Hubei province are 0.494, 0.551 and 0.498 respectively, compared to those in 2019, which means that the magnitude of decline in NO2 in both Hubei province and other provinces is consistent. This provides evidence for the common trend. Third, Liu et al. (Reference Liu, Kong and Kong2020) suggested that the lockdown policies significantly reduced air pollution, using the timing of lockdown in different cities. In fact, the complete lockdown of cities mainly took place from January 23 to 24, and the population flow declined rapidly from January 23 to 25, when 30 provinces activated the first-level public health emergency response (except Tibet). (The primary response dates are presented in the last column in online appendix table A2.) Therefore, at the weekly level, the common trend holds up.
Another important problem regarding the validity of the empirical strategy is the comparability of the sites in the control group and treatment group before work resumption. Figure 3 reveals that AQI, PM2.5, PM10 and NO2 demonstrate a downward trend before work resumption. Thus, we test the difference of trends of all variables in table 3. These two groups are similar in columns (2) and (4) before work resumption, and column (5) shows that the difference is insignificantly different from zero because the p-value is greater than 0.1 in column (6).
Table 3. Summary statistics of first-order differential of all variables intreatment group and control group

In addition, we check the difference before work resumption between the control group and treatment group in online appendix table A5. This table shows that the key dependent variables AQI, PM2.5, PM10, and NO2 are insignificant between two groups. However, the temperature is higher whilst the wind velocity is lower in Hubei province than those in non-Hubei provinces. One possible explanation is that Hubei province is located in the south of China; cold currents and winds from Siberia are blocked by the mountains in the north region, and the temperature over the period January 23–February 9 in winter is normally higher than the average temperature in China. In terms of barometric pressure, the magnitude of the coefficient is insignificant compared with the mean (1027) barometric pressure, although the difference is statistically significant. Notably, the difference in the flow of population in the last three rows is significant between two groups because the travel restrictions are stricter in Hubei province than in other provinces. However, the last three rows in table 3 demonstrate that there is no difference in the trends of Within-city Flow Intensity, Inflow Index and Outflow Index between the control and treatment groups. Figure 2 also provides such evidence of the Within-city Flow Intensity between Hubei province and the provinces outside Hubei before resumption.
In conclusion, the assumptions of common trend and balance test hold up, and the identification strategy is valid.
4.2 Robustness checks
We next conduct robustness checks and report the results in table 4. First, we include four monitoring sites in Wenzhou because we exclude Wenzhou in the baseline estimation, and reset the DID approach. Column (1) demonstrates that air quality declines as in table 2. Second, the Lantern Festival, an important traditional festival in China, may lead to a higher level of human mobility, thus compounding the estimation results. We then exclude the Lantern Festival observations. Column (2) illustrates that the positive and significant coefficient is larger compared with the baseline results, which suggests that the baseline estimation is underestimated. Third, we consider extending the estimation sample to March 15, 2020, in column (3), and we exclude the observations in March in column (4). The results show that the air quality gap between the non-Hubei provinces and Hubei province is narrowing with the resumption of work in Hubei province, consistent with figure 3. Lastly, by utilizing the different methods of basic propensity score matching (PSM) by matching the level of urban population, GDP per capita, industrial structure, FDI, longitude and latitude of the monitoring station, temperature, atmosphere pressure, wind velocity, and wind direction before the resumption of work and production to rule out the possible disturbances of specific characteristics of both the treatment and control groups, the results reported in column (5) with k-nearest neighbor matching (k = 1) and column (6) with kernel matching suggest that the resumption of work increases the weight of air pollution significantly.
Table 4. Robustness checks of the effect of work resumption on air quality

Notes: Column (1) includes the observations of the monitoring sites of Wenzhou. Column (2) excludes the observations of Lantern Festival, which is January 15 and 16 of the Chinese lunar calendar. Column (3) extends the estimation sample to March 16. Column (4) excludes the observations in March. Columns (5) and (6) report the results using the k-nearest neighbor matching (k = 1) and the kernel matching of PSM method. *, **, and *** denote significance levels at 10%, 5%, and 1% respectively.
In addition, we utilize the PSM-DID method with kernel matching, using PM2.5, PM10 and NO2 as alternative dependent variables. The estimated coefficients in columns (1)–(3) in table 5 are larger than those in the baseline estimation, with significance at the 1 per cent level except that in column (2). This table suggests that the impact of production resumption on air quality might be underestimated due to the differences in geographical and socioeconomic factors.
Table 5. Robustness checks using PSM-DID with PM2.5, PM10 and NO2

Notes: Robust standard errors are in parentheses. Standard errors are clustered by city. * and *** denote significance levels at 10% and 1% respectively.
4.3 Heterogeneity analysis
We conduct the heterogeneous analysis, as shown in table 6. We first consider the characteristics of cities. The agglomeration effect of an urban economy leads to the continuous concentration of population to cities, which could result in the deterioration of urban environment. Therefore, the air quality of cities with different population sizes is likely to be significantly different after the resumption of work and production. We investigate the heterogeneity according to the city size. The sample is split based on the median value of the total population (i.e., large vs. small cities). Columns (1) and (2) illustrate that air pollution is more serious in large cities than in small cities after resumption. In large cities, resumption may lead to an increase in vehicle emissions due to the population flow (because initially people would like to choose private cars in large cities to avoid the possibility of novel coronavirus infection through public transportation).
Table 6. Heterogeneity of the effect of work resumption on air quality with different cities

Notes: It reports the heterogeneity between cities in different groups. Columns (1) and (2) respectively correspond to large and small cities by the size of population. Columns (3) and (4) respectively correspond to industrial and non-industrial cities by the proportion of secondary industry. Columns (5) and (6) respectively correspond to cities with central-heating system and non-central-heating system by the Qinling Mountains-Huai River Line. Columns (7) and (8) respectively correspond to cities with strict and loose human mobility restrictions. Regression specification follows table 2. Robust standard errors are shown in parentheses. Standard errors are clustered by city. * and *** denote significance levels at 10% and 1% respectively.
Then, people gather in cities because of the need for large amounts of labor in non-agricultural industries. However, emissions from different industries are quite different, and manufacturing is the primary source of urban air pollution, such as the Big Smoke in London in 1952. Thus, we focus on the urban-leading industries. The sample is split based on the median value of the proportion of secondary industry (i.e., industry vs. non-industry cities). Surprisingly, columns (3) and (4) show that the resumption of work has caused greater pollution in non-industrial cities. The reasons behind this might have two aspects. On the one hand, the Chinese government has imposed environmental regulations on industrial enterprises for 30 years and, as a result, industrial pollution has dropped significantly. From our data, the average AQI of industrial cities in 2019 was 66.28, while that of non-industrial cities was 64.49. On the other hand, the industrial sectors were allowed to resume work following the medical services (services), transportation and logistics (services), and grain production (agriculture), in order to ensure the safety of people's lives and the supply of basic goods and materials. The results in columns (1)–(4) may lead to a concern that we separate the control group into the corresponding categories. Therefore, we compare the median value of the total population and the proportion of secondary industry between the control and treatment groups (online appendix table A6). The two groups appear to be similar, and the control group is not separated into large cities and non-industrial cities.
Inadequate combustion of coal, which is the main energy source for centralized heating in northern Chinese cities, may lead to poor air quality. Some of the existing literature suggests that the centralized heating system in northern China causes poor air quality. Thus, we consider the centralized heating in northern cities of China. We treat the northern cities and southern cities (excluding the cities in Hubei province) divided by the Qinling Mountains-Huai River as the treatment group in columns (5) and (6) respectively. Surprisingly, the estimation finds that the cities without centralized heating systems are more seriously polluted. The results imply that the heating system did not have an obvious change after February 9, 2020, and the centralized heating system does not account for air pollution. Centralized heating in northern China lasts from November to mid-March in the following year. There was no change in heating before and after the resumption of work during our sample period. This means that air quality in the north was at a higher level before the resumption of work, hence air quality would not significantly decrease after resumption.
Based on the above findings that the population size has an impact on urban air quality, in cities with a severe COVID-19 situation, both human mobility and economic activities decrease. Therefore, the travel restriction due to COVID-19 affects population movement and business production, which has an influence on air quality. Thus, we attempt to explore the effect of different levels of human mobility on air pollution. Columns (7) and (8) suggest that compared with Hubei province, cities with loose restrictions on human mobility as the treatment group have more severe air pollution than the cities with strict restrictions, which implies that work resumption in the 178 cities with loose restrictions recovers rapidly, and work resumption of the 47 cities with checkpoints and partial shutdown caused by the COVID-19 epidemic (Fang et al., Reference Fang, Wang and Yang2020) has a slower recovery.
In sum, according to the above heterogeneity analysis, we need to pay attention to the following aspects of urban air quality. First, the population size of megacities should be properly controlled to mitigate the deterioration of urban air quality. Second, after the completion of industrial pollution treatment, the focus should instead be on the impact of the services sector on air quality. Third, governments can encourage citizens to adopt green, energy-saving and environment-friendly ways of commuting, and gradually replace traditional heating with natural gas.
4.4 Potential channel
In this section, we further investigate the underlying mechanisms. Work resumption increases human mobility with transportation between people's residence and workplace (i.e., commuting). When the commuting distance is more than 30 km, then it will normally take more than one hour to travel within a city with vehicles. Both exhaust and dust from motor vehicles are important sources of air pollution. Column (1) of table 7 shows that work resumption significantly increases intracity migration intensity. This is because the restart of work and production is in need of human mobility within a city. However, the resumption has no impacts on the intercity migration intensities (i.e., inflows and outflows) as shown in columns (2) and (3), since the municipal governments discouraged human mobility between cites considering the policy to ‘restrain the inflows of COVID-19 cases from the outside’. Even if people can travel between cities, they have to face more complicated procedures, such as the COVID-19 Nucleic Acid Test, 14-day home quarantine, and so on. As a result, the within-city human mobility can, to some extent, explain the causality between work resumption and the deterioration of air quality, and our hypothesis 2 is verified.
Table 7. Mechanisms of the effect of work resumption on air quality

Notes: Columns (1)–(3) use the within-city flow intensity, inflow index, and outflow index as alternative dependent variables. Regression specification follows table 2. Robust standard errors are shown in parentheses. Standard errors are clustered by city. *** denotes significant levels at 1%.
Furthermore, we also consider that the expansion of production scale exacerbates air pollution. In fact, as the strengthening of COVID-19 epidemic prevention measures – such as cleaning and sterilizing every day and keeping a social distance of more than two meters – alleviates the deterioration of air quality, both the AQI and the concentration of particulate matter are not found to rise, which is shown in figure 3. Due to the availability of daily data on vehicles and enterprises, this argument can hardly be tested empirically. To eliminate the influence of outliers, we winsorize the Within-city Flow Intensity, Inflow Index and Outflow Index at the 1st and 99th percentiles. We report this in online appendix table A7. The estimates are consistent with table 7, which suggests that the estimation is not affected by the outliers.
In addition, we further test the mediation effect using the Within-city Flow Intensity as the mediating variable. In table 8, we add the Within-city Flow Intensity on the right-hand side. We find that the range of the coefficients relating to the Within-city Flow Intensity is from 3 to 5, with statistical significance at the 1 per cent level. Meanwhile, the magnitude and the significance level of the effect of resumption on air quality decline compared with those in the baseline estimation. To be specific, the increase of Within-city Flow Intensity partially explains the increase in AQI and NO2, and fully explains the increase in PM2.5 and PM10. In reality, the resumption of work leads to population mobility, bringing about an increase in the number of vehicles on the road, while their exhaust emissions further cause air pollution.
Table 8. Mechanisms of the effect of work resumption on air quality with mediation effect

Notes: Robust standard errors are shown in parentheses. Standard errors are clustered by city. *, ** and *** denote significance levels at 10%, 5% and 1% respectively.
4.5 Counterfactual test
Although the time of work resumption was instructed by provincial governments, we were concerned that many cities might not implement this policy on February 10, 2020. We use the pseudo regression to test these possibilities. In practice, we generate the policy implementation date – which is February 3, 2020 in column (1), February 15, 2020 in column (2), February 17, 2020 in column (3), and February 24, 2020 in column (4) in online appendix table A8– and replicate the regression utilizing equation (1). The results show that if the cut-off is not on February 10, 2020, then we can hardly find a rise in the AQI, suggesting that the treatment effect of work resumption is not just by chance.
5 Conclusion
In general, there is an inverted-U shape in most countries between economic development and environmental pollution in the long term. However, this paper attempts to analyze the causality between economic activities and air quality in the presence of the COVID-19 epidemic in the short term in China. Utilizing the quasi-natural experiment of work resumption during the COVID-19 epidemic, this paper uses the DID approach to quantify the relationship between economic activities and air quality. We find that work resumption after subsiding of COVID-19 leads to an increase in the AQI of 7.226, compared to Hubei province. Our results are robust to various specifications. We further discuss the mechanism that the intracity migration leads to environmental degradation from the perspective of air quality. Work resumption has greater influences on cities with larger size of population, smaller proportion of secondary industry, non-centralized heating system, and lower level of mobility restrictions.
Why is the short-term perspective of the relationship between economic development and air quality important in the late industrialization age for developing countries? The reasons might consist of two aspects. First, human exposure to air pollution in the short term affects their long-term health, which has an influence on the accumulation of human capital. Second, the short-term perspective is beneficial to the adjustment of environmental policy. Maynard Keynes said, ‘The long run is a misleading guide to current affairs. In the long run we are all dead.’ The paper provides evidence that, in the short term, most developing countries need to choose appropriate environmental protection policies rather than a pattern of ‘grow first, clean up later’ or a pattern of ‘treat and pollute simultaneously’ over the period of industrial development. In addition, the short-term perspective is beneficial to identify the causality between air quality and economic development by solving the disturbing reserve causality.
During the period of the epidemic, how can economic development and environmental protection be balanced? According to the work resumption index in table A9 (online appendix), the average national resumption except Hubei province is about 65.77 per cent and that of Hubei province is 30.8 per cent (on March 10, 2020). Our paper illustrates that the AQI increases by 7.2. This suggests that a 1 per cent work resumption index is equivalent to about 0.2 of the AQI. If the resumption of work and production returns to the level of 2019, the AQI will rise by 20. Suppose that the index is 0 before resumption, and the average AQI ranges from 60 to 76 (as shown in figure 3) before resumption of work and the AQI will be 80–96, which implies that air quality is at a good level. The conjecture is confirmed by China's economic growth data and the air quality data in 2020. In 2020, the average number of days with good air quality in 337 cities increased by 5 per cent year-on-year, while China's GDP grew at 2.3 per cent. COVID-19 has changed the way of production and life, and some nonessential work has changed from offline to online. However, in the post-epidemic era, economic recovery still needs to be accompanied by consideration regarding the deterioration of air quality, especially in Hubei province. We can balance economic development and environmental protection through the transformation of mode of production. This paper sheds light on the trade-off between economic development and environmental protection, which could be a reference for policy-makers to implement policies that focus on air quality control by improving economic efficiency to obtain sustainable development.
Supplementary material
The supplementary material for this article can be found at https://doi.org/10.1017/S1355770X21000309
Acknowledgments
Jingci Zhu gratefully acknowledges her parents, who give her great love, patience and unconditional support all the time. She loves them both deeply. Weijie Luo gratefully acknowledges support from the Center for China Fiscal Development, Central University of Finance and Economics (grant 024050321016).


