


1. Introduction
Climate change is a global phenomenon, which requires concerted action in terms of reductions of greenhouse gas (GHG) emissions by all sectors of society, whether residential, transport, agriculture or commercial. Reducing energy consumption from fossil fuels is one means of achieving reductions in emissions. However, this is easier said than done, given the dominance of fossil fuels in the global energy mix (World Energy Council, 2016). Achieving energy efficiency in consumption is another important way to mitigate climate change, with the added benefit of being a (relatively) less costly measure to achieve GHG emission reduction targets, especially at the economy-wide level (Stern, Reference Stern2007). Energy efficiency measures are often referred to as the ‘low-hanging fruit’ of energy saving, given that they are relatively simple and yield large benefits, while having the potential to deliver more than half the emissions cuts needed to keep the increase in global temperatures within 2°C (Sustainable Energy for All, 2015).
Furthermore, while low- and middle-income countries (LMICs) have low levels of per capita energy consumption relative to developed countries, higher levels of expected future growth, along with the expected increases in their population, imply that energy consumption (and the use of energy services) is likely to increase. This may have further repercussions on GHG emissions, and thus on climate change, as well as on ensuring energy security. The latter point is more crucial for small countries like Nepal that have a high share of renewables in the production of electricity, but still need to invest a lot in the development of the necessary energy infrastructure to meet the growing demand. In this context, it is then vital that policy-makers implement policies to improve energy efficiency in order to optimize the investment in the electricity supply infrastructure, and to ensure sustainable development.Footnote 1
One (relatively) low-cost means of achieving energy efficiency is by investing in energy-saving technologies. However, the economic literature abounds with examples of underinvestment in such technologies (and the resulting private and social losses). A range of market and non-market (e.g., behavioral psychology) failures are responsible for this ‘energy-efficiency gap’, where individuals may make suboptimal investment decisions when the benefits and costs of owning a durable are distributed unevenly over time (Hausman, Reference Hausman1979; Jaffe and Stavins, Reference Jaffe and Stavins1994; Allcott and Greenstone, Reference Allcott and Greenstone2012; Gillingham and Palmer, Reference Gillingham and Palmer2014).
Important examples of market failures include uninternalized externalities from energy consumption, and imperfect information, as well as a lack of capital (or even hidden costs of investment in energy-efficient technologies) (Schleich, Reference Schleich2009). Such failures imply that consumers and firms may not be able to exploit privately-profitable energy efficiency investments. In an LMIC context, the high transaction costs of acquiring information on the attributes of new energy-saving technologies that are available to them, or of making an investment analysis of their costs and benefits, are important examples of market failures (Jeuland et al., Reference Jeuland, Pattanayak and Bluffstone2015). Further, in settings where energy access is a serious concern, credit and information-related market failures, along with weak institutions, may further depress clean technology adoption (Pattanayak et al., Reference Pattanayak, Pakhtigian, Litzow, Dasgupta, Pattanayak and Smith2018).
Behavioral failures that may result in the energy-efficiency gap often stem from the risk and uncertainty involved (such as high implied discount rates for investments in energy efficiency), loss aversion and bounded rationality (Schleich, Reference Schleich2009). While neoclassical economics assumes that rational decision makers choose the optimal solution given their budget constraint and given all available alternatives, real-world decision makers may often fail to behave as ‘Homo Economicus’.
One form of bounded rationality is the failure of agents to compute the life-cycle costs of durables correctly when making decisions to invest in energy-saving technologies. Energy-efficient technologies usually have higher upfront costs than other appliances, despite their lower operating costs, which means that households need to have the computational abilities as well as energy-related knowledge in order to calculate the cost over the lifetime of the appliance. Blasch et al. (Reference Blasch, Boogen, Daminato and Filippini2018) coin a new term for this conjoint ability, namely energy-related financial literacy, which is the combination of energy-related knowledge and cognitive abilities (or computational skills) that agents need in order to take decisions with respect to their investment decisions in durables, for the production of energy services and their consumption.
Although the per capita energy consumption in developing countries is usually quite low, one can expect, at least in urban areas, that agents will purchase more energy consuming appliances and vehicles as their disposable incomes increase when their countries witness economic growth and development (Wolfram et al., Reference Wolfram, Shelef and Gertler2012). This implies that the risks of bounded rationality, and therefore of low levels of energy-related financial literacy, are likely to be high. However, little is known about the ability of agents to undertake an investment analysis before making these technological choices, which may have repercussions on the efficiency of the technologies that they end up purchasing. While there are some studies (Klapper et al., Reference Klapper, Lusardi and Van Oudheusden2015) that have looked at the role of price constraints or lack of information in hampering greater adoption of energy-saving technologies in LMICs, to the best of our understanding, this research has not considered whether these barriers may stem from a lack of ability of agents to do investment calculations when they face uncertainty and risks, and how low levels of education and literacy may play a role.
A few studies in the context of developed countries have analyzed the effects of higher levels of energy-related financial literacy on the identification of the most cost-efficient technologies by respondents (Blasch et al., Reference Blasch, Boogen, Filippini and Kumar2017a,Reference Blasch, Filippini, Kumar and Martinez-Cruzb, Reference Blasch, Boogen, Daminato and Filippini2018, Reference Blasch, Filippini and Kumar2019). However, very little is known about this in the LMIC context. We hypothesize that this is a significant gap in the energy and development literature. These investments are likely to influence the paths of energy consumption in developing countries in the coming decades. Thus, two pieces of policy-focused research are helpful: (1) What are the determinants of energy-related financial literacy in LMICs, such as Nepal (which is one of the poorest countries in the world, with a per capita annual income of US$ 835)?, and (2) Are higher levels of energy-related financial literacy correlated with the replacement attitudes regarding inefficient appliances in the Nepali context? Furthermore, we also provide information on the levels of financial literacy for households in some of the urban areas in the lowlands of Nepal.
In 2017, households accounted for about 45 per cent of the total electricity consumption in Nepal whereas only 65 per cent of the population had access to the grid, even though this number has been steadily increasing by about 10 per cent annually (Nepal Electricity Authority, 2017). The current electricity supply, predominantly based on run-of-the-river type hydropower plants, has been unable to meet Nepal's growing peak time demand. Demand-side management measures to improve end-use efficiency at the household level may yield significant reductions in electricity consumption. Even though Nepal primarily uses hydropower, which is a renewable resource, it is important to stress that achieving energy efficiency is a crucial goal in the Nepalese context. There are two reasons for this: (1) it will enable the Nepalese electricity authorities to reduce peak demand, and avoid load-shedding, which will have other related benefits such as reduced air pollution (given the rampant use of diesel-run generators due to frequent interruptions, for instance), and (2) it may improve the balance of payments situation due to reduced imports of fuel from India.
This study is the first, to our knowledge, to undertake an analysis of energy-related financial literacy in a developing country context. Using novel data from a survey conducted in some of the urban municipalities in the eastern Terai region (lowlands) of Nepal with the cooperation of the Nepal Electricity Authority (NEA), we provide descriptive evidence on the appliance stock, energy-related literacy and financial knowledge, as well as information on environment-related attitudes and behavior for a sample of about 2,000 households that have regular access to electricity. We then estimate the determinants of energy-related financial literacy using an ordered probit regression model. In the second part of this study, we evaluate the association between higher levels of energy-related financial literacy of respondents, and the rationality in attitudes regarding replacement of a major household appliance that is old and inefficient. While we are not able to causally identify the effect of literacy on level of rationality, to the best of our knowledge this is still one of the first studies in LMICs that explores this research question.Footnote 2
Credit and liquidity constraints are also likely to play an important role in underinvestment in energy-efficient durables, especially in low- and middle-income countries such as Nepal. Purchasing appliances requires an investment to be made upfront, which may not be affordable for all households. In order to mitigate this concern, we focus our attention in this study on urban households that have regular access to electricity, and already own at least a few appliances.
The results show that the levels of appliance ownership are low for households in the region, as one can expect. We find that the levels of energy-related knowledge, as well as their computational skills and financial literacy, are quite poor for the respondents in these households. Regarding the determinants of energy-related financial literacy, we find that there is a gender gap, with females having lower levels of literacy than males. This finding has been confirmed in developed countries as well, with females scoring lower on measures of both computational skills and of energy knowledge. Moreover, we also observe that less-educated households have lower levels of energy-related financial literacy, while income is not found to be a significant determinant of this score, unlike in developed countries (Blasch et al., Reference Blasch, Boogen, Daminato and Filippini2018).
While we do not observe the actual replacement behavior of these households in this cross-sectional analysis, we have information on their revealed attitudes regarding the replacement of a major appliance that is old and inefficient. We find that higher levels of energy-related financial literacy, especially stronger computational abilities, are associated with lower levels of irrationality and bounded rationality of consumers, and are correlated with more rational attitudes towards replacement of old and inefficient appliances. This suggests that it is important to understand the binding constraints towards greater energy-efficient technology adoption in a developing country context.
Our contribution through this paper is to shed light on the level and determinants of energy-related financial literacy, and on the underlying barriers to higher levels of literacy that are specific to LMICs. Furthermore, this paper aims to inform policy-makers about how limited levels of energy-related financial literacy may influence consumers' attitudes towards replacement of old and inefficient household appliances. The insights we derive from this study are a useful step towards the design of demand-side management policies that may address low literacy levels. This is particularly relevant to policy-makers looking to address behavioral reasons for the energy-efficiency gap in developing countries.
The remaining sections are organized as follows. Section 2 reviews the literature on the topics of energy-related literacy and financial literacy in the context of household energy consumption and adoption of new appliances. Section 3 describes the survey and the data used. Section 4 discusses the empirical strategy and presents the econometric analysis. Section 5 presents the results and section 6 concludes.
2. Literature review
In this paper, we are interested in two interrelated types of literacy, which we argue are important in determining whether households are able to correctly value the benefits from the adoption of energy-efficient durables (such as appliances). The first is the idea of financial literacy, or computational ability in general, which would facilitate the performing of an investment analysis. The effects of higher levels of financial literacy have been extensively studied for both developed and developing countries, with regard to retirement decisions (such as pensions) as well as the adoption of other financial products and services (Lusardi and Mitchell, Reference Lusardi and Mitchell2007; Lusardi et al., Reference Lusardi, Mitchell and Curto2009; Lusardi and Mitchell, Reference Lusardi and Mitchell2011, Reference Lusardi and Mitchell2014; Xu and Zia, Reference Xu and Zia2012; Karakurum-Ozdemir et al., Reference Karakurum-Ozdemir, Kokkizil and Uysal2018). This literature finds an important role for financial literacy programs in determining financial knowledge-related outcomes, but also in determining financial behavior. For instance, education through financial literacy programs has been found to have a profound effect on the likelihood of opening savings accounts (and the take-up of financial products in general), but also on financial proficiency scores and knowledge (Xu and Zia, Reference Xu and Zia2012; Bruhn et al., Reference Bruhn, Lara Ibarra and McKenzie2014). However, except for Blasch et al. (Reference Blasch, Boogen, Daminato and Filippini2018), few studies have considered whether this measure may be correlated with the adoption of energy-efficient technologies (or durables, in general).
Another aspect of literacy that may play a role in facilitating the ability of households to perform an investment analysis, which may then influence their adoption of energy-efficient durables, is their knowledge of energy-related matters, such as whether they are cognizant of the operating costs of appliances, or of possible savings from the use of energy-efficient technologies. This has been understudied in the literature, in comparison to the determinants of financial literacy, even in developed countries. Previous papers have studied the effects of environmental attitudes and behavior (Ameli and Brandt, Reference Ameli and Brandt2015), as well as prices (Jacobsen, Reference Jacobsen2015), on energy-efficient adoption decisions, but less is known about the role of households' knowledge in determining these choices. Studies such as Brounen et al. (Reference Brounen, Kok and Quigley2013) and Kalmi et al. (Reference Kalmi, Trotta and Kazukauskas2017) have found that households suffer from low levels of energy literacy (or energy knowledge) in the Netherlands and Finland respectively. One study that emphasized the importance of knowledge is Mills and Schleich (Reference Mills and Schleich2012), who find that knowledge about energy consumption and energy-efficient technology options has a strong correlation with the household-level adoption of energy conservation practices, but not necessarily with the adoption of energy-efficient appliances. In a recent study, Prest (Reference Prest2020) finds that the most critical determinant of electricity demand for Irish households in response to a policy of peak-load pricing was whether consumers were aware of the policy.
Other studies have looked at the link between being able to compute the lifetime costs of appliances and a household's decision to purchase energy-efficient appliances. Blasch et al. (Reference Blasch, Boogen, Daminato and Filippini2018) evaluate the determinants of energy-related financial literacy, and also show that higher levels of energy-related financial literacy are correlated with the share of energy-efficient technologies (in this case, light bulbs) adopted by households. They use data from a sample of European countries (Italy, the Netherlands and Switzerland) for their analysis, and propose the concept of ‘energy-related financial literacy’, which encompasses both energy-related knowledge and cognitive skills, to process available information in order to take informed energy-related investment decisions.
A stream of literature based on developed countries such as Switzerland has found that many households have poor levels of energy-related financial literacy, and that this is often associated with households taking suboptimal decisions regarding identification of the appliances having the lowest lifetime costs (Blasch et al., Reference Blasch, Boogen, Filippini and Kumar2017a,Reference Blasch, Filippini, Kumar and Martinez-Cruzb, Reference Blasch, Filippini and Kumar2019). These studies have also found a largely positive impact of enhancing both a household's energy knowledge and their ability to do financial calculations, on their ability to identify the appliances having the lowest lifetime costs. Blasch et al. (Reference Blasch, Boogen, Filippini and Kumar2017a) show that more literate households are more likely to consume less electricity, and Blasch et al. (Reference Blasch, Filippini, Kumar and Martinez-Cruz2017b, Reference Blasch, Filippini and Kumar2019) find that households which have higher levels of literacy are more likely to calculate investment costs for themselves, rather than relying on simple rule-of-thumb heuristics.
Our paper is methodologically similar to that of Blasch et al. (Reference Blasch, Boogen, Daminato and Filippini2018), in that we are also seeking to understand the determinants of energy-related financial literacy, but in an LMIC context.Footnote 3 For developing countries, there is neither much evidence on the barriers to greater adoption of energy-efficient technologies in general, nor evidence on the determinants of energy-related financial literacy or on the ability of households to compute lifetime costs. We find this to be a big gap in the literature, especially because these countries suffer from already low levels of education and literacy (Klapper et al., Reference Klapper, Lusardi and Van Oudheusden2015). Moreover, as their populations and incomes increase, LMIC households are more likely to purchase appliances and vehicles, which is likely to influence energy consumption pathways in the coming decades (Wolfram et al., Reference Wolfram, Shelef and Gertler2012).
This paper attempts to fill this gap at least partially, by: (a) providing a descriptive analysis of appliance stock, financial literacy and energy-related financial literacy, as well as replacement attitudes for our sample; and (b) analyzing the determinants of energy-related financial literacy for a sample of urban households in the eastern lowlands of Nepal. While we do not have information on electricity consumption or other types of behavior, such as actual adoption of an energy-efficient appliance, which may be interpreted as a direct outcome of having a high level of energy-related financial literacy, we also seek to: (c) evaluate the association between higher levels of literacy and attitudes of households regarding replacement of old and inefficient appliances. The results of this study provide important findings that enable us to undertake future experiments to study the effects of enhancing literacy in influencing households' adoption decisions.
3. Data
The data is drawn from a household-level survey conducted by the Centre for Energy Policy and Economics (CEPE), ETH Zurich, in collaboration with the Nepal Electricity Authority (NEA).Footnote 4 The survey was administered during the first quarter of 2018. A total of 2,042 respondents and households were part of the survey that was conducted in some of the urban municipalities in the Morang and Sunsari districts of Nepal, e.g., Urlabari, Itahari, Biratnagar, Duhabi and Dharan. These municipalities belong to the eastern Terai region (lowlands) of Nepal.Footnote 5 The survey was paper-based and in the local language (Nepali) and consisted of 31 questions spread over 6 pages. At the beginning of the survey, there was an introductory page with project information, incentives for participation and a few basic instructions. The survey was administered by the local distribution offices of the NEA with the help of their on-field meter-readers – that is, the utility's staff who are responsible for physically visiting the addresses having electricity meters, checking the meter readings and handing out the electricity bills for the last month (or last quarter if it is a remote location).Footnote 6 Further details on the project and the household survey can be found in the report, ‘A descriptive overview of literacy, attitudes and behaviorus towards energy consumption in Nepal’ (Kumar, Reference Kumar2018).
The questions included in the survey were designed to collect information on households' sociodemographic characteristics, dwelling-related attributes, capital stock, energy-related knowledge, computational skills, attitudes and behavior towards electricity consumption and adoption of energy-efficient appliances. Below we present some descriptive statistics of the data.
3.1. Descriptive statistics
3.1.1. Sociodemographic and dwelling characteristics
Table 1 shows the percentage distribution of the basic sociodemographic characteristics of the respondents and households. Both genders are almost equally represented in the data. The typical respondent is married, lives in a joint family, both the respondent and the spouse are educated at the primary level (below high school), and the monthly household income is less than Rs.20,000.Footnote 7 One in every three households declares that they regularly receive foreign remittance from a family member who works abroad.Footnote 8 The median age of respondents in the household survey is found to be 43 years. The most frequent response with regard to the total number of people regularly living in the household is 4.
Table 1. Basic sociodemographic attributes of the survey sample
# Sample excluding missing values from a total of 2,042 observations.
Table A1 in the online appendix presents some information on the features of the dwelling. Most respondents live in a single family house (97.5 per cent) and in most cases the house is owned by a member of the household (95.2 per cent). Almost half of the households belong to the town of Urlabari, the second largest city (after Biratnagar) in the Morang District in the lowlands of Nepal. The most frequent response on the total number of bedrooms and living rooms within the dwelling is 4.
Tables A2 and A3 in the online appendix provide these summary statistics for the regression sample of table 6 of our results.
3.1.2. Capital stock
The survey asked respondents if they owned certain types of household appliances, a motorcycle, or an inverter-battery system (or backup-system), and whether or not they were planning to buy or replace these durables in the next two years. Table 2 shows the share of responses to this question as percentages. We find that the share of households owning an electric rice cooker is more than 60 per cent, followed by fridge (58.4 per cent), motorcycle (39.5 per cent), an inverter-battery based electricity backup system (21.4 per cent), washing machine (8.9 per cent), electric geyser (8.5 per cent) and air-conditioner (4 per cent). The share of households planning to add or replace one of these appliances in the next two years varies from 2–5 per cent.
Table 2. Capital stock and plan to add or replace in the next two years

# Sample excluding missing values from a total of 2,042 observations.
3.2. Definition of literacy scores
Measurement of the level of energy-related knowledge and computational skills was one of the main objectives of the survey which consisted of several questions for this purpose. Below we present an overview of these questions and use the responses to construct three types of scores, following the approach in Blasch et al. (Reference Blasch, Boogen, Daminato and Filippini2018). Our first score is an index that measures energy knowledge, and the second is a score of that we term ‘computational skills’, which is a combination of financial literacy along with the ability to do a lifetime cost calculation. The final measure has been referred to as energy-related financial literacy, which is defined as the sum of the energy knowledge as well as computational skills scores of the respondents.
3.2.1. Energy-related knowledge
Questions on energy-related knowledge checked whether respondents knew the cost of electricity (in monetary terms) for some of the daily electricity consuming activities, or energy services, at home, and whether they were able to compare two energy services and determine which one consumed more electricity. The respondents were also asked how much they thought the percentage of energy savings was when using an LED bulb as opposed to an incandescent bulb.Footnote 9 These questions are described in table A4 in the online appendix; summary statistics on the correct responses are presented in table 3.
Table 3. Energy-related knowledge

Notes: All variables are binary with 1 implying a correct response.
The mean values in table 3 are on the lower side (in an absolute sense). In general, this highlights a low level of energy-related knowledge among the Nepalese respondents in our sample. Among all questions, respondents seem to be better informed about comparison and savings on LED bulbs compared to regular incandescent bulbs. This is likely due to the fact that the NEA has been actively promoting the benefits of LED bulbs through advertisements and information campaigns since 2016 (Nepal Electricity Authority, 2017).Footnote 10
The index capturing energy-related knowledge is created as the sum of the number of questions which the respondent answered correctly (theoretically, it can vary from 0 to 6, given that we ask 6 questions to measure the respondent's knowledge and energy-related awareness).Footnote 11 In our sample, a plurality (almost 40 per cent) of households incorrectly answered (or did not know the answer to) every question related to energy consumption.
3.2.2. Computational skills
The questionnaire contained a few questions to assess the level of financial literacy and computational skills. Some of these questions pertain to calculations of simple interest, compound interest as well as to the effects of inflation, which are standard in the financial literacy literature (Lusardi and Mitchell, Reference Lusardi and Mitchell2014).Footnote 12 Additionally, we asked the respondents a question that sought to identify their ability to perform an investment analysis by means of comparing two appliances. This question captures whether households can compare two fridges, and identify the one having a lower lifetime cost (defined as the sum of the purchasing cost, and the operating costs).Footnote 13 These questions are described in table A4 in the online appendix; the summary statistics on correct responses are presented in table 4.
Table 4. Financial literacy and computational skills

Notes: All variables are binary with 1 implying a correct response.
Table 4 depicts a generally low level of financial skills. Nearly 30 per cent of respondents appear to be aware of how to calculate a compound interest rate. Understanding of the interplay of rate of inflation and bank interest rate appears to be lower. The poor performance in the simple interest question when compared to the compound interest question is somewhat strange. It might be due to the use of a larger monetary amount (Rs. 10,000) and a longer time duration (5 years) in the simple interest question, which, if true, again points to cognitive limitations of consumers in processing large numbers. On the other hand, this may also have happened due to the layout of the questionnaire, as this particular question started on page 4, and ended on page 5 in the paper survey.Footnote 14 Lastly, respondents perform very poorly on the question concerning identification of the appliance with the lower lifetime cost – only about 1 in 10 answer this correctly – which highlights the inability of consumers to perform investment analysis in the domain of appliance choice. We originally planned to conduct a randomized controlled trial using this question, by providing half of the respondents with a one-page educational brochure on how to calculate the lifetime cost of a durable before they answered this question. Unfortunately, because of logistical limitations, this could not be implemented. However, about 20 per cent of the respondents still ended up receiving the survey with the brochure attached to the end of the questionnaire, but this was not communicated to them. Later in the empirical section, we also account for this aspect.
Our score measuring computational skills is constructed by summing up the number of above described questions that the household answered correctly in the survey, i.e., it varies from 0 to 4, and considers both financial knowledge and ability to perform a simple lifetime cost calculation of an appliance. Thus, the index attempts to represent the computational ability of the respondents. While it is closely related to a typical measure of financial literacy, we prefer it over financial literacy because it is more comprehensive – it incorporates a critical component of the ability to perform an investment analysis, namely, the ability to calculate and compare lifetime costs of appliances. Nevertheless, for the empirical analysis, we also consider the financial literacy score that varies from 0 to 3 (i.e., without considering the lifetime cost comparison question).
3.2.3. Energy-related financial literacy
The total number of questions answered correctly by the respondent pertaining to both energy knowledge and computational skills are the two components of the index of energy-related financial literacy. Theoretically, the index can vary from 0 to 10 (there are six questions aimed at capturing energy knowledge and four questions for computational skills). In our data, the maximum score that households got is 8. Interestingly, 30 per cent of the households got a score of zero, meaning that they were unable to answer a single question correctly.
Following the arguments listed in Blasch et al. (Reference Blasch, Boogen, Daminato and Filippini2018), one way to justify combining these different components together in creating the energy-related financial literacy index, at least statistically speaking, is to check for: (a) the correlation between them, and (b) the internal consistency of the scales that have been used to measure the two components. The pairwise correlation coefficient between the two different indices that we have used to measure energy-related financial literacy, namely energy knowledge and computational skills, is found to be 27.24 per cent. The correlation coefficient between computational skills and energy knowledge is comparable to that of about 27 per cent for the Swiss, Italian and Dutch population (Blasch et al., Reference Blasch, Boogen, Daminato and Filippini2018). This suggests that there may be common determinants of the two factors, such as income and education, which are closely related to one another in the context of developing countries.
In addition, table A5 in the online appendix includes information on Cronbach's alpha measures which tests the internal consistency of the indices. Internal consistency refers to the strength of association between multiple items that are used to measure the same construct (often the components of a Likert Scale index, or a score). Higher levels of internal consistency (usually measured using Cronbach's alpha) indicate that the components of the index are closely related to one another, and thus invoke more reliability in the measure. From the results in table A5, we find that the measures of Cronbach's alpha are high for each combination of measures that we use. This suggests scale reliability as well as internal consistency of these measures when they are used as a group (Tavakol and Dennick, Reference Tavakol and Dennick2011).
Table 5 presents the summary statistics on the energy knowledge index, the index for computational skills, the energy-related financial literacy index, as well as the classical financial literacy index. Given the maximum score that was achievable, we see that the mean scores are very low for our sample, along both dimensions of energy knowledge and computational skills, and that no household attains scores of energy-related financial literacy which are higher than 8 (the theoretical maximum is 10). Moreover, the low median scores suggest that a large share of the sample fares poorly.
Table 5. Summary statistics on the scores

3.3. Replacement attitudes
The survey also asked the respondents about their attitudes regarding replacement of old appliances. The question that the households were asked, along with the potential responses, are listed below:
Question In case at least one of your major electrical appliances (e.g., fridge, washing machine or geyser) is 10 or more years old and inefficient, why did you not replace the appliance so far with a new, more efficient one? Please choose which of the following statements is most applicable to you.
Response 1 I only replace appliances when they stop working.
Response 2 I have never really thought about it.
Response 3 So far, I didn't inform myself because it is tedious to find out all the information.
Response 4 I did an investment analysis, and found the current appliance to be more cost-effective.
Response 5 High upfront costs prevent me from buying a new appliance, even though I realize that it might be more cost-effective in the long-run.
Response 6 I do not own any old appliancess.
About 42 per cent of the respondents chose Response 6, i.e., they do not own any old appliances. This high share likely reflects the low ownership of major appliances that was also seen earlier in table 2.Footnote 15 Around 27 per cent selected Response 2, i.e., they never really thought about replacing an old appliance. The share of other options were – Response 1 (9 per cent),Response 3 (10 per cent), Response 4 (7 per cent), and Response 5 (5 per cent).
The answers to this question could be used to gain insights into the rationality of consumers, which is likely to vary across the sample. Households may exhibit irrational attitudes, boundedly rational attitudes, or rational attitudes. Therefore, based on the answers to this question, we group our sample into three categories. The first group have what we term ‘irrational’ replacement attitudes (respondents who selected Response 2). The second group are the ‘boundedly rational’ (those who choseResponse 1 or 3), and lastly we identify the third group as ‘rational’ (those who opted for Response 4 or 5). Hence, we are able to identify an ordinal nature, or ranking, among the three groups, i.e., ‘irrational’ < ‘boundedly rational’ < ‘rational’. In the second part of the econometric analysis, we will use an ordered probit methodology in order to estimate the determinants of this replacement attitude with a particular focus on the role of our literacy-based indices.Footnote 16
4. Empirical model
In this section, we first present the empirical model pertaining to determinants of the different literacy scores. Next, we illustrate the empirical model to analyze the replacement attitudes. For the first model, we adopt an approach similar to that of Blasch et al. (Reference Blasch, Boogen, Daminato and Filippini2018), in using an ordered probit estimation to model energy knowledge, computational skills, and energy-related financial literacy (defined as the sum of the indices for energy knowledge, and computational skills). This is intuitive, given that the dependent variables for this set of estimations are scores, with a natural ordering (a higher score indicates a more ‘literate’ respondent). This methodology assumes that there is a continuous, latent measure underlying the observable ordinal variable, and that it can be expressed as

where $y^{*}_{i}$ is a latent (continuous) variable measuring the literacy score of the respondents, $X_{i}$
 is a vector denoting the socioeconomic characteristics of household i such as age, income, level of education and dwelling-specific characteristics, and β is the vector of parameters that need to be estimated. $\epsilon _{i}$
 denotes the stochastic error term, which is assumed to be independently and identically distributed across households. This model is estimated using maximum likelihood estimation.
The probability that household i has reached a literacy level of j (where j can vary from 0 to 10 in the case of the model estimating energy-related financial literacy), is given by

where the $y_{i}$ s are the ordinal values of the literacy score, and the $k_{j}$
 s are the threshold parameters. We estimate this model separately for each score that we are interested in, namely the energy knowledge of the households, their skills score, the energy-related financial literacy index; lastly, we also estimate the determinants of the financial literacy score.
In the second part, we evaluate the association between these literacy scores and the replacement attitudes among our sample of Nepalese households. While we do not observe their actual replacement behavior, the respondents are asked about their reasons for not having replaced their old and inefficient appliances. Recall that, based on the replacement attitudes, we were able to group our sample into three categories – ‘irrational’, ‘boundedly rational’, and ‘rational’. These groups exhibit an ordinal nature, i.e., ‘irrational’ < ‘boundedly rational’ < ‘rational’. We also use, in this case, an ordered probit methodology.
We first estimate the association between energy-related financial literacy and the level of rationality in replacement attitudes. This estimation can be represented by the expression for the ordered probit regression:

where $r^{*}_{i}$ is a latent (continuous) variable measuring the replacement attitudes of the households, $E_{i}$
 is the energy-related financial literacy score of household i, and $X_{i}$
 denotes the same vector of socioeconomic characteristics of household i that we used for the previous estimation. $\nu _{i}$
 denotes the stochastic error term, which is assumed to be independently and identically distributed across households.
The probability that household i has reached a level of rationality j in terms of replacement attitudes (where j can vary from 1 (irrational) to 3 (rational)), is given by

where the $r_{i}$ s are the ordinal values of the replacement attitudes as defined above, and the $s_{j}$
 s are the threshold parameters.
We then also estimate this model in a specification using the components of the energy-related financial literacy score separately, i.e., introducing the energy knowledge index along with the computational skills measure as independent variables. Finally, we incorporate the financial literacy score as an independent variable in one specification.
In the estimation of equation (3), there is a concern about endogeneity which prevents us from causally identifying the effect of literacy on the level of rationality. For instance, it is not straightforward to rule out the possibility of correlated unobservables influencing both the dependent variable and our explanatory variables, such as having a bank account or membership in a co-operative (since engagement in financial services helps to accumulate computational skills).Footnote 17 In order to partially mitigate this concern, we control for important determinants of both attitudes and literacy (such as education and income, as well as the total number of investments already made by households in appliances and personal mobility).
It is also likely that credit constraints influence outcomes such as replacement attitudes, given that energy-efficient appliances are often relatively more expensive, and that households may not be able to afford them, irrespective of their levels of energy-related financial literacy. For our sample, we feel that this is relatively less likely to be a concern, because our focus in this study is on urban households that have access to electricity, and already own a few appliances. In our regressions, we attempt to control for the importance of credit and liquidity constraints by including socioeconomic controls for income, education, and stock of durables owned by households. Moreover, in response to the question on replacement attitudes regarding an old appliance, we find that only 5 per cent of respondents stated that high upfront costs prevented them from investing in a more energy-efficient appliance.
5. Results
In this section, we first present the estimation results pertaining to determinants of the different literacy scores. Next, we look at the estimation results with appliance replacement attitudes as the outcome variable. Lastly, we present a discussion on the marginal effects and predicted probabilities following these estimations.
The results of the baseline model, which evaluates the determinants of the literacy scores, are presented in table 6, which includes the coefficients for the models estimated using the ordered probit methodology. In column (1), we present the results for the estimation of energy knowledge, column (2) includes the results of estimation of computational skills, whereas column (3) presents the results of the estimation of the energy-related financial literacy index of households (as defined in section 3.2.3). The results of column (4) are those we estimate the determinants of financial literacy.
Table 6. Determinants of literacy scores

Notes: The dependent variable in columns (1) to (2) is the sum of the number of questions pertaining to energy knowledge and computational skills that the respondent answered correctly, respectively. In column (3), it is the total number of questions pertaining to energy knowledge and computational skills (combined) that were answered correctly. In column (4), it is the financial literacy score. Ordered probit methodology is used for the estimations. Coefficients are reported in this table. The thresholds are all found to be significantly different from one another at the 1% level. We restrict the sample to those respondents in the age group 18–102, living in houses with less than 10 rooms and less than 12 people living in the household, in order to reduce noise in the regressions. Huber-White heteroscedasticity-consistent standard errors are reported in parentheses. ** and *** respectively denote significance at 5% and 1% levels. The coefficient of the constant has not been reported.
We find that older respondents, on average, have lower levels of energy knowledge, whereas they have higher levels of computational skills (as can be seen in columns (1) and (2)). The effect of age on energy-related financial literacy is insignificant (driven by these two opposing effects on the components of the score). This is in contrast to the findings of Blasch et al. (Reference Blasch, Boogen, Daminato and Filippini2018), one of which was that older households have higher levels of energy-related financial literacy in the context of a sample of European countries. Younger respondents fare better on energy knowledge, which suggests that improvements in the quality of education (over time) may arguably have had an impact on energy knowledge, while the same cannot be said of computational and/or financial skills.
One of the most important findings of this paper, which has been confirmed in previous studies from developed countries as well, is that on average women fare much worse than men in these surveys, with their scores on energy knowledge, skills, and energy-related financial literacy being lower than those of male respondents (Lusardi and Mitchell, Reference Lusardi and Mitchell2014; Blasch et al., Reference Blasch, Boogen, Daminato and Filippini2018; Kumar, Reference Kumar2019). The variable is found to be significant at the 1 per cent level in each model of table 6. This finding has broad connotations in the context of the general educational gap between men and women, which is even more sharply-defined in developing countries. It also has implications for which group should be targeted by policy-makers for educational campaigns. The optimal policy measures should take into account the intra-household bargaining power of women in this context, and how much of a say they have in investment decisions for durables.
We do not find evidence to suggest that income is a significant determinant of energy knowledge, whereas it is found to be a significant determinant of skills and financial literacy (with low-income households having higher scores than high income households). There may be multiple reasons for these findings. One may be that in an LMIC context, lower-income households are more likely to be employed in the informal sector. These individuals are more likely to be in need of, and thereby also use, skills related to financial calculations, than individuals earning a higher income. Secondly, low-income households are more likely to be reliant on credit assistance, or aid in some form, which often requires them to be able to perform simple financial calculations in return. Without further information on the nature of occupations of the respondents and their access to banks and informal financial arrangements in general, it is difficult to pinpoint the exact channel of influence. Having stated that, the result regarding the insignificance of the income variable for the estimation of energy-related financial literacy highlights that it may be critical to understand how the barriers towards higher knowledge and skills in an LMIC context may differ from those in developed countries.
We also find that the role of education in determining energy knowledge, as well as energy-related financial literacy, is positive and significant for our sample (as can be seen in columns (1) and (3)), while we do not find this effect in column (2). Higher levels of education are thus a strong determinant of higher levels of energy-related knowledge, but not of their ability to perform numerical computations (which are more likely to be influenced by lower income levels). Thus, unlike the findings of Blasch et al. (Reference Blasch, Boogen, Daminato and Filippini2018), the determinants of energy knowledge and computational skills in our sample are quite different.
In this analysis, we also control for the total ‘capital stock’ of the households, namely the total number of investments that households have made in durables such as electrical appliances, back-up systems and personal mobility. Specifically, we sum the total number of appliances that households have already purchased (amongst rice cookers, fridges, washing machines, water heaters, and air-conditioners), as well as investments in inverter-battery systems, and in personal mobility (namely, whether they have already purchased a two-wheeler such as a motorcycle). This variable aims to capture the total number of assets that households have accumulated, with the potential to undertake an investment calculation. We find that this variable has a positive and significant effect on literacy scores across all models in table 6.
Moreover, our results suggest that respondents who live with extended family (or with friends) have lower levels of energy knowledge (and energy-related financial literacy) than respondents who live in a single-family arrangement, while this is not observed in the results of column (2). There is also no significant difference in the levels of literacy between respondents that lived in rented versus owned households, although we do find that respondents that live in larger houses (with more rooms) are likely to have lower levels of computational skills, as can be inferred from column (2). This effect appears to be in line with the previous finding regarding the negative effect of income on financial literacy.
The results of column (4) are similar to those of column (2), given the similarity of the dependent variables in the two estimations.
Next we examine the appliance replacement attitudes of the respondents. Recall that the outcome variable is ordinal and depicts whether the respondent's attitude towards replacement of a major household durable is irrational, boundedly rational, or rational.
In table 7, we present the results of the estimations using ordered probit methodology for estimating the correlation between literacy scores and replacement attitudes. Column (1) includes the results of the model using the energy-related financial literacy score as an independent variable, column (2) uses its two components, namely energy knowledge and computational skills as independent variables, while in column (3), we present the results of the estimation using financial literacy as an independent variable.
Table 7. Association between literacy scores and replacement attitudes

Notes: The dependent variable in columns (1) to (3) is an ordered variable representing rationality in replacement attitudes (varying from 1 (irrational) to 2 (boundedly rational) to 3 (rational)). Ordered probit methodology is used for the estimations in columns (1) to (3). Coefficients are reported in this table. The thresholds are all found to be significantly different from one another at the 1% level. We restrict the sample to those respondents in the age group 18-102, living in houses with less than 10 rooms and less than 12 people living in the household, in order to reduce noise in the regressions. Huber-White heteroscedasticity-consistent standard errors are reported in parentheses. *, ** and *** respectively denote significance at 10%, 5% and 1% levels. The coefficient of the constant has not been reported.
We see from the results of column (1) that higher scores of energy-related financial literacy are positively correlated to rational replacement attitudes. This is in line with our intuition: higher scores of energy-related financial literacy imply that respondents are more likely to perform an investment calculation, or at least perceive the benefits from adopting energy-efficient technologies, compared to respondents having a lower score, and thus are more likely positively associated with being rational in terms of their attitudes regarding replacement.
In the estimation results of column (2), we find that while the variable for energy knowledge is insignificant in the estimation, the variable representing computational skills is positively and significantly correlated with rationality in replacement attitudes of households (the variable is significant at the 1 per cent level). We expect energy knowledge to play a minimal role in determining replacement attitudes, given the nature of questions they are asked in order to assess this (namely, costs of operating major appliances, and comparing the energy-efficiency of appliances). On the other hand, the significance of stronger computational skills in enabling households to make investment decisions in developing country contexts (such as in Nepal) is likely to be higher, especially when budget constraints may dictate replacement decisions. While our data is limited, as it does not collect information on actual electricity consumption or on the adoption of an energy-efficient appliance, we are able to observe a positive correlation between computational skills and how rational households are in deciding whether to replace old and inefficient appliances.
Lastly, in column (3), we incorporate the measure of financial literacy as an independent variable. We find that the coefficient is positive, and significant at the 1 per cent level. However, we find that the model in column (2) has a slightly lower value of the Akaike Information Criterion (AIC), which suggests that it has higher statistical power than the model in column (3). We also find that being married is positively correlated to rational replacement attitudes, whereas living with extended families is negatively correlated with it. This suggests that household composition may play a role in determining appliance needs, as well as rationality in replacement attitudes.Footnote 18
5.1. Marginal effects and predicted probabilities
The marginal effects for the estimation in column (3) of table 6 related to the determinants of energy-related financial literacy are provided in table A6 in the online appendix. The negative marginal effect of being female is found to increase with increasing energy-related financial literacy scores, i.e., being a female additionally decreases the probability of possessing higher levels of energy-related financial literacy. Similarly, having a low level of education (below high school) additionally decreases the probability of having high levels of energy-related financial literacy. These findings support our key observations regarding the gender gap in literacy levels, as well as the importance of education in determining energy-related financial literacy in developing countries. Lastly, the number of investments made by households in appliances and personal mobility additionally increases the probability of possessing higher levels of energy-related financial literacy.
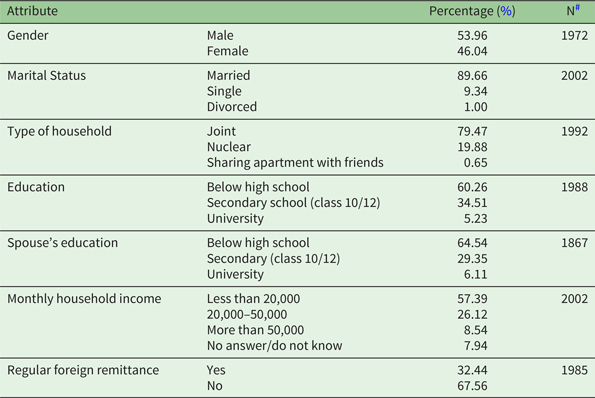
Next, we present the predicted probabilities with respect to the score variables for the replacement attitudes. Figure 1 shows the predicted probabilities for increasing values of energy-related financial literacy from the results of column (1) of table 7 whereas figures 2a and b show the predicted probabilities for increasing values of energy knowledge and computational skills. We find from the predicted probability plot in figure 1 that higher levels of energy-related financial literacy are associated with an increase in the probability of belonging to the ‘boundedly rational’ group, or the ‘rational group’, whereas it is associated with a lower probability of belonging to the irrational group, which is intuitive.
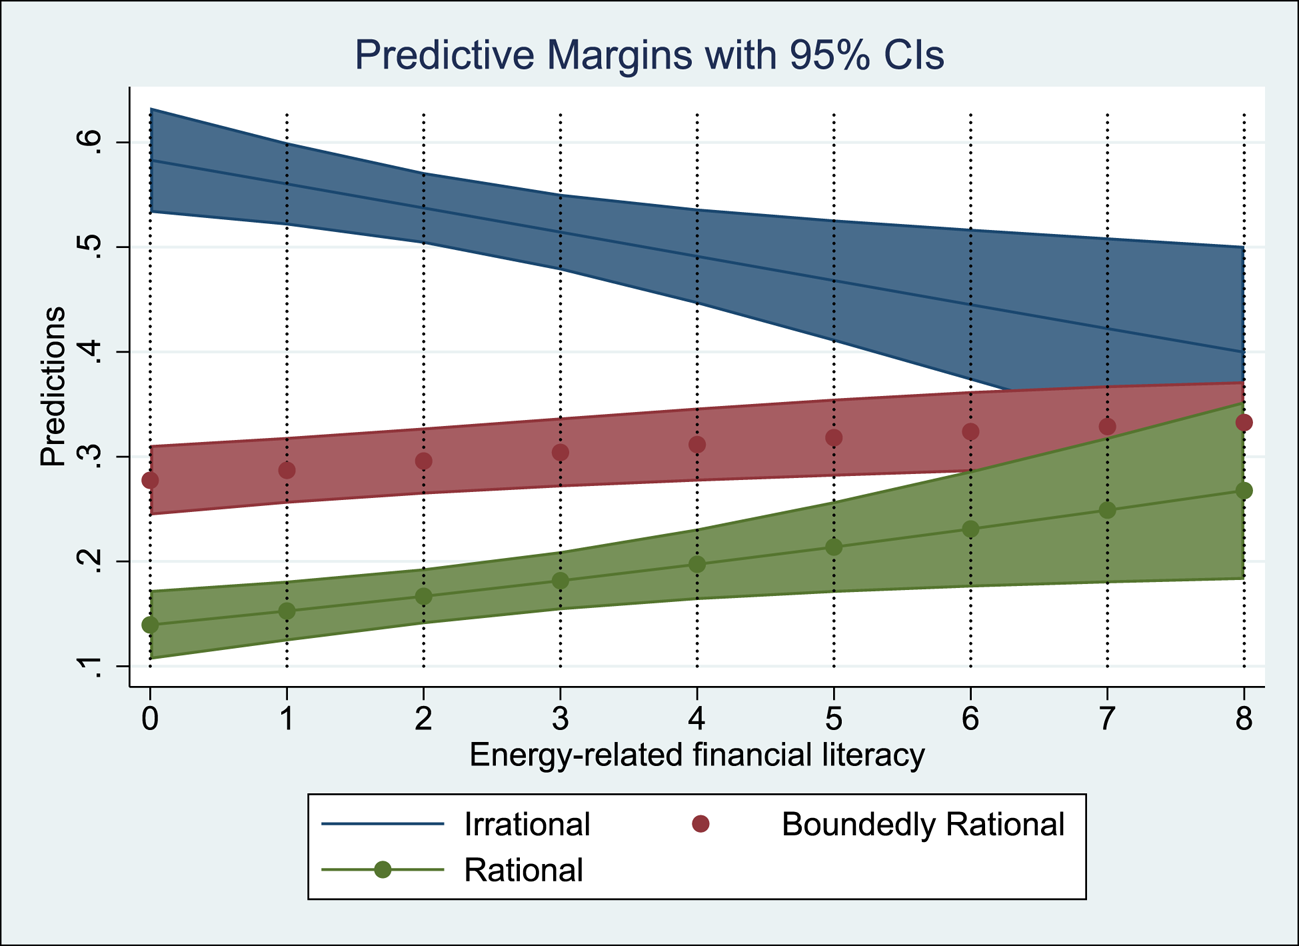
Figure 1. Effect of energy-related financial literacy on the predicted probabilities of replacement attitudes.
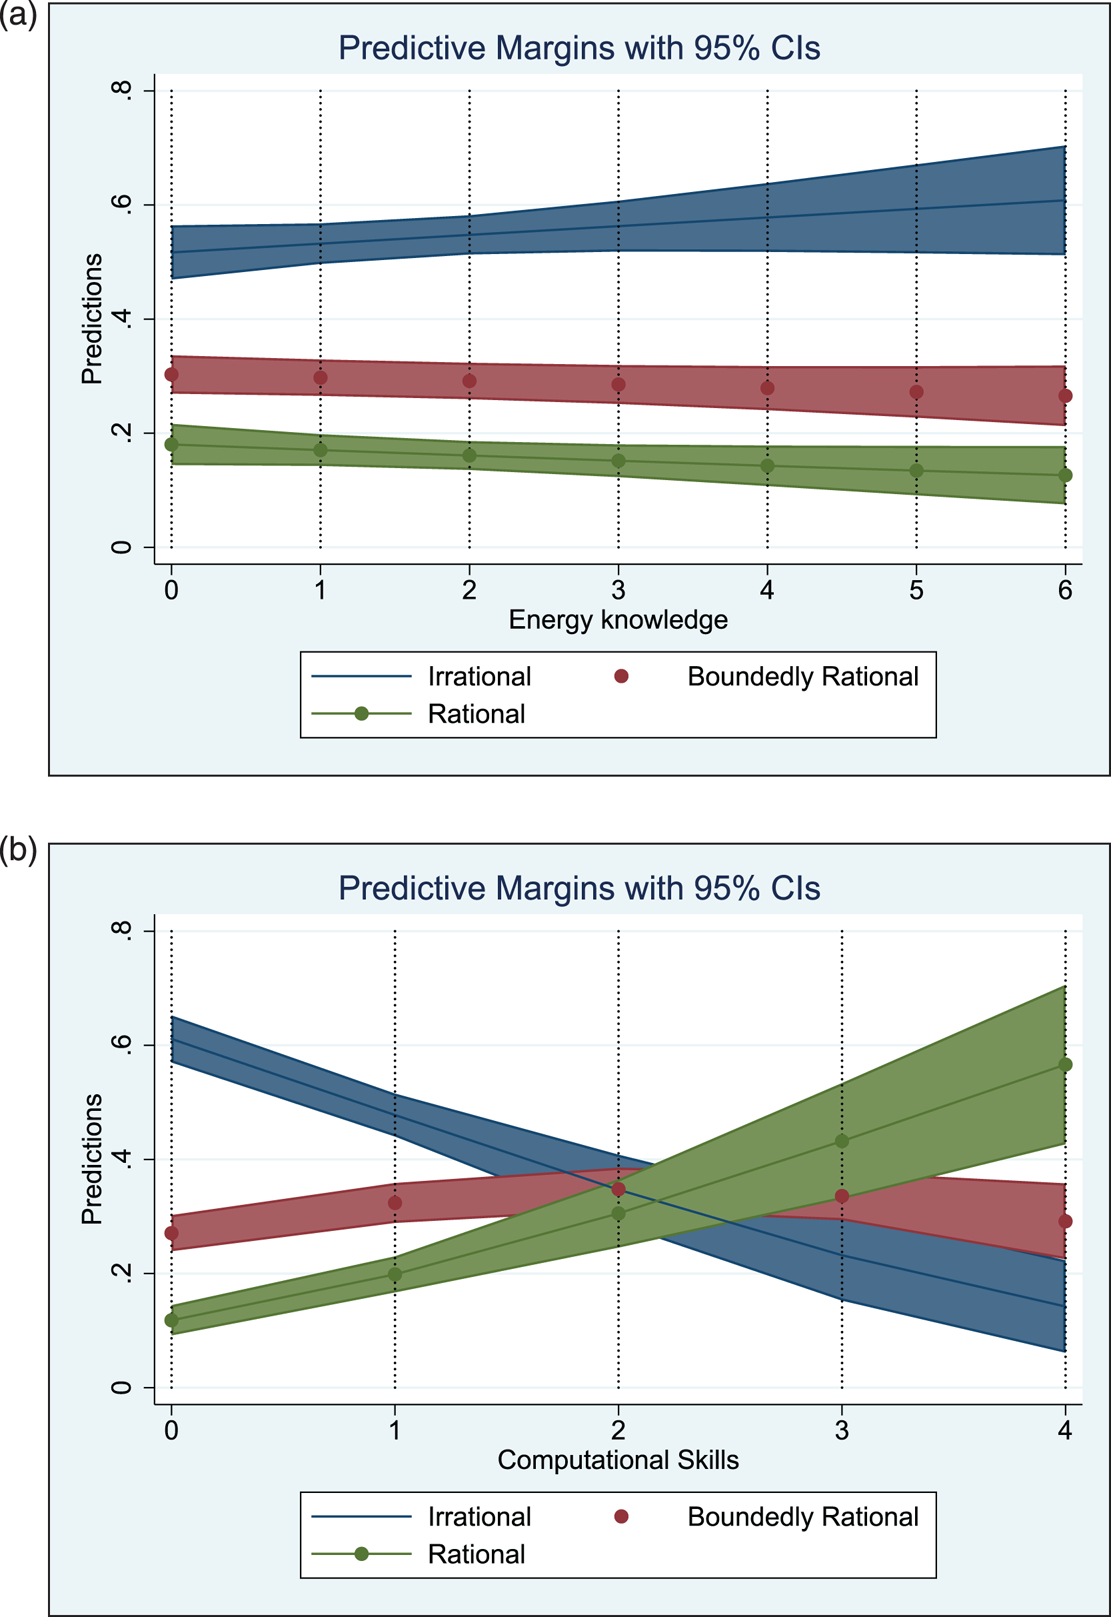
Figure 2. Effect of energy knowledge and computational skills on the predicted probabilities of replacement attitudes. (a) Energy knowledge. (b) Computational skills.
Figures 2a and b display the predicted probability plots for the model of column (2) of table 7, namely the results of the estimation using the two components of energy-related financial literacy (energy knowledge and computational skills) as independent variables. Figure 2a contains the plot for energy knowledge; we find that the level of energy knowledge does not significantly influence the probability of belonging to a particular attitude group, although it appears that in our case, higher levels of energy knowledge may be associated with slightly higher probabilities of belonging to the irrational group, and slightly lower probabilities of belonging to the boundedly rational or rational groups. On the other hand, in figure 2b, we find that higher levels of computational skills have a strong positive correlation in determining rationality in replacement attitudes (with the predicted probability of being rational being more than 50 per cent for those who answer all questions correctly). Furthermore, the likelihood of being irrational is negatively correlated to increases in computational skills. Lastly, the likelihood of being boundedly rational and computational skills are initially positively correlated from low to medium levels of computational skills and then negatively correlated at higher levels of computational skills, i.e., among all levels of computation skills, the likelihood of belonging to the boundedly rational group is highest at medium levels of skills.
6. Conclusion and policy implications
Information on the adoption of appliances, environmental attitudes and behavior within the residential sector is scarce for households in developing countries, as is information on the determinants of their knowledge on energy-related matters and computational skills. In this paper, using novel data from a survey of about 2,000 households conducted in some of the urban municipalities of the eastern Terai region (lowlands) of Nepal, we shed some light on the determinants of energy-related financial literacy of respondents, and also identify its association with attitudes towards replacement of old and inefficient appliances.
The initial results suggest low levels of energy-related financial literacy for our sample and we observe that important determinants such as age and income do not necessarily play a role in the same direction in determining them as they do for developed countries. For instance, we find that older respondents are more likely to have lower levels of energy knowledge but higher levels of financial literacy. Likewise, low-income households are more likely to have higher levels of financial literacy (a finding that is in contrast to what is observed in developed countries), whereas higher levels of education are a strong determinant of the energy knowledge (but not financial literacy). This suggests that it may be important, in a developing country context, to understand the nature of occupations, as well as the formal banking and credit arrangements available to households.
At the same time, we are also able to confirm certain findings from the literature on developed countries, primarily the lower literacy levels for female respondents compared to male respondents. This finding has important repercussions for policy-makers in the design of education policies catering to households in developing countries.
Furthermore, we also observe that higher levels of energy-related financial literacy, especially stronger computational abilities, are linked to lower levels of irrationality and bounded rationality of consumers, and are found to be associated with more rational attitudes towards replacement of old and inefficient appliances. This may have repercussions on their consequent adoption behavior as well. This is a critical finding, which sheds light on the nature of barriers in greater adoption of energy-efficient technologies in developing countries, but also has implications for policy design.
Thus, both the descriptive evidence and the regression-based results of this paper provide a plethora of relevant findings on environmental and energy-related issues for policy-makers in low- and middle-income countries. The consequences of this study are especially far-reaching, as both development and population growth enable more households to purchase appliances. Our goal is to highlight, based on previous literature, that energy-related financial literacy may be an important determinant of households' decisions to adopt (or to replace) energy-efficient technologies. Moreover, while previous studies have shown the importance of financial literacy in influencing intertemporal decision making, we show that computational skills (more broadly defined, to include the ability to compute lifetime costs of durables) are also strongly correlated with replacement attitudes. Effective policy design, especially of educational or informational programs, may benefit from taking these findings into account.
Supplementary Material
The supplementary material for this article can be found at https://doi.org/10.1017/S1355770X20000078
Acknowledgments
We are grateful to the Nepal Electricity Authority (NEA) for their collaboration on this project. We would like to particularly thank our local collaborator, Mr. Chandrakant Lal Das, and officials at the utility distribution office in Biratnagar, Nepal who provided local support in administering the household survey. Neither NEA nor its officials were responsible for the survey design, data analysis, interpretation of the results, or the writing of this report. The content in the report does not necessarily represent the official views of the NEA. We also thank participants at a research seminar at Tribhuvan University, Kathmandu, Nepal in January 2019, as well as at the IAREP-SABE 2019 conference in Dublin, Ireland for their comments. Comments from two anonymous referees are gratefully acknowledged. All omissions and remaining errors are our responsibility.


