


1. Introduction
Coal plays an important role in social and economic development worldwide. Arguably, as a fuel for steam engines, it lay at the heart of the industrial revolution. Coal has driven industrialization through the past several centuries, although its production in 1900 was only 250 million tonnes (Church, Reference Church1986), in contrast to 6.94 billion tonnes in 2009 (BP, 2010). Other examples of the importance of coal are that 70 per cent of global steel has been produced by technologies requiring coal as a necessary input, and that many countries, such as China, Poland, South Africa and Australia, obtain more than 80 per cent of their electricity from coal (WCI, 2008).
Coal, however, is one of the primary environmental polluters, particularly in China. It has been reported that 85 per cent of SO2, 70 per cent of soot and 60 per cent of NO2 emitted into the atmosphere in China comes from the use of coal (Wang and Feng, Reference Wang and Feng2003). The correlation between increased SO2 levels and coal consumption in China is over 95 per cent (He et al., Reference He, Huo and Zhang2002).
With the emergence of more environmental regulations, concerns are often raised that the use of coal cannot be reconciled with the environment, and thus the future for coal is gloomy. In contrast, many people argue that the prospect for coal is promising, at least in the foreseeable future, because coal can be clean and has in fact become cleaner (McGinley, Reference McGinley1992; Wang, Reference Wang1999; Shi, Reference Shi, Garnaut and Song2006, Reference Shi, Song and Woo2008; MIT, 2007). However, most of these arguments were presented using qualitative analysis and lacked quantitative evidence, except for the MIT report (MIT, 2007) and Shi (Reference Shi, Song and Woo2008). The issues of whether and by how much coal has become cleaner and the implications of this trend remain to be further explored. These issues are important to countries that rely heavily on coal, such as China, India and Australia, in terms of energy supply, energy security, jobs and economic development. They are also important to the global community in terms of environmental protection and climate change.
This paper demonstrates that the use of coal can be reconciled with the environment by examining changes in the emission intensity of coal using China's empirical data. The paper updates a recent quantitative study (Shi, Reference Shi, Song and Woo2008) using the latest data and more robust estimation techniques. The proposal and demonstration of the common trend of the emission intensity of coal and the differentiated trend of emission intensities between two kinds of coal, and the use of variables measuring regulatory enforcement are also new to the literature.
Carbon dioxide emissions are not studied in this paper because of the way in which CO2 emissions are inferred, even though coal emits the largest amount of CO2 due to its dominance in China's energy mix. There are no official data on CO2 emissions in China published in a time series and thus CO2 emissions are often inferred by assuming constant emission intensity for each fossil fuel (Ang and Pandiyan, Reference Ang and Pandiyan1997; Ang et al., Reference Ang, Zhang and Choi1998; Wang et al., Reference Wang, Chen and Zou2005; IPCC, 2006; Wu et al., Reference Wu, Kaneko and Matsuoka2006). This is understandable given that CO2 emissions have seldom been the subject of environmental regulation. Therefore, the current data for CO2 emissions are not suitable for this analysis to demonstrate non-constant emission intensity. However, since technically CO2 emissions from coal combustion can be reduced, findings from the study of non-CO2 emissions may be able to be applied to the case of CO2 and we will slightly extend the discussion to touch the case of CO2.
The rest of the paper is organized as follows. The next section introduces the hypothesis of declining emission intensity, and the models and data that will be used to test it. The third section presents results about the environmental performance of coal in China from the two quantitative models. The fourth section discusses China's environmental protection efforts in terms of emission control with a brief international comparison, the role of clean coal technologies (CCTs), improvement of energy efficiency, and policy implications. The final section concludes the paper.
2. Hypothesis, modelling and the data
2.1. The hypothesis of declining emission intensity
Despite the increasing number of environmental regulations relating to coal and consequent reductions in emissions since the 1970s, global demand for coal has increased steadily over the past three decades (EIA, 2010). In 2009 coal accounted for 29.4 per cent of the world's energy consumption (BP, 2010). Coal consumption is expected to continue to increase in the next two decades. Total world consumption of coal is projected to increase by 73 per cent and its share of energy will increase from 25 per cent to 28 per cent during the period 2005–2030 (IEA, 2007).
As the world's largest producer and consumer of coal, the Chinese coal industry has managed to develop despite increased environmental protection measures. Since environmental protection was entrenched as one of China's basic national policies in the 1980s, a considerable degree of control of air pollution has been achieved. For example, the amount of industrial SO2, industrial soot, and dust discharged in the generation of one unit of GDP in China dropped in 2004 by 42 per cent, 55 per cent and 39 per cent, respectively, from the levels recorded in 1995 (State News Office, 2006). As shown in figure 1, while coal consumption has been soaring in recent years, industrial dust and soot emissions were declining. There has been a slight increase in SO2 emissions from around 2005, but the speed of the increase is far slower than that of coal consumption.

Figure 1. Coal consumption and air pollution emissions in China, 1997–2008
Note: Mt denotes million tonnes.
Sources: CEYP (various years); NBS (various years).
One hypothesis to explain this reconciliation of coal and the environment is that emissions per unit of coal, that is, emission intensity, has been declining, and continues to decline, mainly due to the application of CCTs, driven by social, economic and technical factors such as innovation, costs, environmental regulation and other policies (Shi, Reference Shi2003, Reference Shi, Garnaut and Song2006, Reference Shi, Song and Woo2008). According to this hypothesis, capping the amount of pollution emissions does not necessarily lead to a decline in coal consumption; a reconciliation between coal use and the environment is possible.
2.2. Two empirical models
To test the hypothesis of declining emission intensity over time, two alternative methods are employed. Econometric techniques are used to examine changes in the emission intensity of coal, with a focus on long-term dynamics. The index decomposition (ID) approach is used to qualify the individual contributions of various factors which determine the final emissions.
The first method to be used is a fixed-effects panel data model, which will test the trend of emission intensity. That is, at time t, in province i, the j th waste gas emissions (WGEs) are decided by the following equation:
in which j = 1, 2, 3 denotes SO2, soot and industrial dust, respectively; FuelC and FeedC denote consumption of fuel coal and feed coal,Footnote 1 respectively; their quadratic terms were assumed to test for misspecification of function form (Wooldridge, Reference Wooldridge2003). T is a general time trend; αij is the province-specific effect in the case of the j th pollutant in the i th province; uitj is a normally distributed error term; X is a vector of exogenous variables representing factors such as GDP per capita and enforcement of environmental regulation.
The variables of coal consumption will be in level form because here the coefficients, β1 to β4, represent emission intensity, which is the ratio of emissions to coal consumed. The pattern of emission intensity over time is modelled by β3 and β4. If β3 or β4 is significantly negative, it means that there is a declining emission intensity in that kind of coal. Due to differences in characteristics between fuel coal and feed coal in different cases of WGEs, β3 and β4 are likely to be different in different WGEs. If we aggregate both fuel coal and feed coal, the coefficient of the interaction term between time trend and the total coal variable will give the weighted-average trend of emission intensity, or a common trend of emission intensity.
The more stringent the enforcement of environmental regulation, the lower the WGEs would be because emissions are more likely to be deterred. The rates of removed WGEs are used as proxy variables for the enforcement. To avoid potential endogeneity in the equation of one emission, we use the closest correlated removal rate in the other two emissions as an instrument. We also use other instrumental variables to check the robustness of these estimations.
The second model uses ID, which is a popular tool used in the past 40 years for the quantitative assessment of various factors affecting WGEs and energy demand. Since there are many factors shaping WGEs, such as economic development and population growth, increased WGEs do not mean coal has not become cleaner. Therefore, it is necessary to access the impact of reduced emission intensity on WGEs through decomposition. In terms of the decomposition method, the Laspeyres index and the Divisia index are the most frequently used and preferred decomposition methods in energy-induced gas emission studies (Ang and Zhang, Reference Ang and Zhang2000).
The Logarithmic Mean Divisia Index (LMDI) approach is applied in this study because it has the time-reversal property of an ideal index and can perform a perfect decomposition and accommodate zero values in the data set, which is preferable to the refined Laspeyres method (Ang and Zhang, Reference Ang and Zhang2000). A detailed survey of this literature can be found in Shi (Reference Shi, Song and Woo2008). Similarly to Wang et al. (Reference Wang, Chen and Zou2005), the total WGE is expressed as an extended Kaya Identity (Kaya, Reference Kaya1990; IPCC, 2001) – that is:
in which j is the type of emission, including SO2, soot and dust; TC is total consumption of coal; FE is fossil fuel energy consumption and TE is total energy consumption; Y is GDP; and P is population.
In this method, the change of WGEs is decomposed into six effects: emission intensity effect (E), fossil fuel composition effect (C), energy composition effect (F), energy intensity effect (I), growth effect (G) and population effect (P). The explicit introduction of coal into the emissions function makes it possible to decompose the impact of the emission intensity of coal on final emissions.
As shown by Wang et al. (Reference Wang, Chen and Zou2005), using the LMDI approach (Ang et al., Reference Ang, Zhang and Choi1998), the difference in WGEs between two periods, t and T, can be expressed as:
in which, the K th effect on emission reduction is:
in which:
The case without change in emission intensity (Non-CEI) is also defined as the basis for comparison with the current status. The Non-CEI of WGEs can be derived by dropping the emission intensity effect, as:
2.3. The data
This hypothesis of declining emission intensity is tested using empirical data from China's industrial sector. The empirical study will focus on three WGEs: sulphur dioxide emissions (SO2), industrial soot emissions (soot) and dust emissions (dust). The focus on industrial WGEs only is appropriate because industrial pollution plays a dominant role in total emissions. For example, in the period 1997–2008, more than 80 per cent of SO2 emissions and soot emissions came from industrial sources (CEYP, various years).
China's provincial panel data from 1996–2008 for the three WGEs, consumption of two kinds of coal and various environmental variables were drawn from various issues of the China Environmental Yearbook (CEYP, various years). Thirty out of the 31 provinces are included in the panel data with Tibet excluded because of missing data. The starting point of 1996 was chosen because data for coal consumption broken down to fuel coal and feed coal were available only from that year. Table 1 presents a brief summary of the panel data set which will be used in the econometric model.
Table 1. Summary statistics of the panel dataset

Notes: GDP converted to 1996 constant prices.
Number of observations is 388 in all estimations. SD, standard deviation.
The data for national total coal production (in physical quantity and in standard coal equivalent), energy consumption and its mix, GDP and population are drawn from the relevant issues of the China Statistical Yearbook (NBS, various years). Total consumption of coal, fossil energy and energy are evaluated at standard coal equivalent, which will avoid problems with heterogeneity of coal qualities. The national GDP data are deflated to 1996 constant prices by GDP deflator.
3. Model results
3.1. The evidence for declining emission intensity
To accompany both the fixed effects and Seemingly Unrelated Regressions (SUR), a dummy variable fixed effects SUR model is used. A dummy variable is created for each province and all but one of these are included in the regression functions to capture fixed effects from unobserved provincial heterogeneity. Since unobserved factors such as new environmental legislation and policy will affect the outcomes for all WGEs simultaneously, as noted in the literature (Bao and Peng, Reference Bao, Peng, Garnaut and Song2006; Shadbegian and Gray, Reference Shadbegian and Gray2006; Shi, Reference Shi, Song and Woo2008), the SUR model is also employed, to allow for correlations in the residuals across equations for the three WGEs.
To test the endogeneity of coal consumption variables, both past and next year consumptions were used as instrumental variables for the current year consumption. However, the Hausman test rejects the assumption of endogeneity.
Several variations of equation (1) are examined using Stata 9.1 as shown in table 2: specification I is the original form, which will be the basis for discussion; specification II keeps only coal and time variables to test the robustness of the estimation of emission intensity; specification III excludes the coal variables to test the relationship between emissions and economic development. Two additional cases are also estimated to check the sensitivity and robustness of the estimations: the first case employs a fixed effects estimation, which will be used as a comparison with the SUR estimation (table 2); the second case combines the two kinds of coal as one, and thus tests the common trend of emission intensity of coal (table 3).
Table 2. Estimated results of differentiated emission intensities
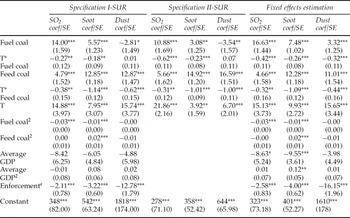
Notes: Number of observations is 388 in all estimations. Standard errors (SE) in parentheses.
***, **, ** show 1%, 5% and 10% levels of significance, respectively.
aEnforcement is approximate by the ratio of removed pollutants: dust in cases of SO2 and soot; soot in the case of dust.
Table 3. Estimated results of common emission intensity and Environmental Kuznets Curve

Notes: Number of observations is 388 in all estimations. Standard errors (SE) in parentheses.
***, **, ** show 1%, 5% and 10% levels of significance, respectively.
aEnforcement is approximate by the ratio of removed pollutants: dust in cases of SO2 and soot; soot in the case of dust.
The results demonstrate that there is a significant decline in emission intensity in the case of feed coal. For fuel coal, there is also a significant decline in emission intensity, except in the case of dust (table 2). Such different patterns demonstrate the differentiated trend of emission intensity between fuel coal and feed coal. The different trends, which imply that emissions from feed coal are more likely to have fallen than those from fuel coal, could have arisen because users of fuel coal did not install necessary equipment or did not keep the equipment operating efficiently.
The findings about the emission intensity are robust across these various estimations. In specification II, where square terms and economic variables are dropped, the conclusion is unchanged. With fixed effects estimation, the dust emission intensity of fuel coal becomes significant but the SO2 emission intensity of feed coal becomes insignificant (table 2). However, the findings about significant and differentiated emission intensity in these two kinds of coal still hold. Since the SUR regression can accommodate more unobservable factors, the estimated results of fixed effects are presented as a check of robustness only.
A further estimation without differentiation of fuel coal and feed coal shows that there is a significant common declining trend in the emission intensity of coal, which is consistent with the econometric estimations (table 3).
The findings about the pollution–income relationship are mixed. There is no significant relationship in specification I (tables 2 and 3). The reason could be that energy consumption serves as an intermediate between pollution and economic development and thus its inclusion will isolate the relationship between these two factors. Actually, none of the previous studies, such as Kaufmann et al. (Reference Kaufmann, Davidsdottir, Garnham and Pauly1998), Bao and Peng (Reference Bao, Peng, Garnaut and Song2006), Markandya et al. (Reference Markandya, Golub and Pedroso-Galinato2006) and Shen (Reference Shen2006), included energy consumption variables. This assumption is supported by the estimation, which excluded coal consumption variables (table 3). In that estimation, only one of the six economic variables in the three pollution cases is insignificant at the 10 per cent level. However, the Environmental Kuznets Curve (EKC) is only demonstrated in the case of SO2 – a finding also reported by Kaufmann et al. (Reference Kaufmann, Davidsdottir, Garnham and Pauly1998), Bao and Peng (Reference Bao, Peng, Garnaut and Song2006) and Markandya et al. (Reference Markandya, Golub and Pedroso-Galinato2006). In the case of dust, a U-shaped pollution–income relationship is found, which is different from the findings of Bao and Peng (Reference Bao, Peng, Garnaut and Song2006).
Enforcement of environmental regulations, approximated by the rates of removed emissions, is significantly negative and robust for all three WGEs (tables 2 and 3). This means that a tighter enforcement of environmental regulation will reduce the emissions of coal when all other factors are held constant, which is desirable. As a robust check, two other instrumental variables – the cumulative number of environmental standards as in Bao and Peng (Reference Bao, Peng, Garnaut and Song2006) and operating costs of WGE-treatment equipment as in Shi (Reference Shi, Song and Woo2008) – were used to approximate the enforcement; the conclusion remains unchanged.
3.2. Decomposition of the total emissions
These decomposition results show that economic growth and population growth have led to more emissions, while the other four factors boosted emission reduction during the period 1996–2008. In terms of scale, emission intensity and economic growth are major players, but in opposite directions; they are followed by the effect of energy intensity. The role of economic growth in the change of emissions is consistent with the theory and the literature (Lin and Chang, Reference Lin and Chang1996; Shalizi, Reference Shalizi2007). The decrease in soot and dust emissions was due primarily to the decrease in emission intensity. In the case of SO2 emissions, even though overall emissions increased on occasion, emission intensity and energy intensity always have negative effects (table 4). The significant effect of lowered emission intensity in reducing total emissions echoes the finding of reduced emission intensity in the econometric estimations.
Table 4. Decomposed effects of the changes in emissions (ΔWGE), 1997–2008

This study shows that energy intensity has played a less important role than emission intensity. In contrast to the literature, where decreases in the emissions are explained mainly by declines in energy intensity (Torvanger, Reference Torvanger1991; Lin and Chang, Reference Lin and Chang1996; Ang and Zhang, Reference Ang and Zhang2000; Shalizi, Reference Shalizi2007), this study finds that changes in industrial WGEs are to a large extent the result of the decline in the emission intensity of coal.
The changing structure of coal among fossil fuel energy and the change of energy mix also contribute to the decreases in WGEs. However, their small value reveals that they have a weak impact on final WGE reductions. The reason is that fossil fuel composition and the share of non-fossil energy in the energy mix changed little over the sample period.
For easy understanding, the decomposed effects for the three WGEs are normalized to the year 1997. That is, the cumulative changes of emissions between 1997 and 2008 are decomposed to the cumulative changes of the six effects over time (figures 2, 3 and 4).

Figure 2. Decomposed effects of SO2 emission changes, 1997–2008 Note: Cumulated impacts on changes of SO2 emissions compared with 1997.

Figure 3. Decomposed effects of soot emission changes, 1997–2008
Note: Cumulated impacts on changes of soot emissions compared with 1997.

Figure 4. Decomposed effects of dust emission changes, 1997–2008
Note: Cumulated impacts on changes of dust emissions compared with 1997.
In all three cases, it is clearly demonstrated that, without the factor of a decline in emission intensity (non-CEI), the emissions would be much higher than they were. This demonstrates that the decreasing emission intensity is the most significant contributor to emissions reductions.
4. Discussion and policy implications
Complete phasing out of coal worldwide is not practical in the near future because of reasons such as the dominance of coal in the energy mix in many countries, affordability, and vested interests in coal and related industries. Beyond the investment and employment in the coal mining industry, coal is also entrenched in the economy of many coal producing and consuming countries on a large scale in terms of investment, employment and revenue. There are also large numbers of coal-fired power plants, which often last several decades and thus cannot be reasonably changed in the short term. Coal is also a cheap and affordable energy source in many developing countries.
Coal is very likely to continue its dominance in the Chinese energy mix in the future. China is extremely rich in coal reserves but poor in gas and oil reserves and thus more than half of its oil consumption is supplied by imports at this stage, which has led to tensions in the world oil markets. Despite using an increasing share of non-fossil energies, together they provided only 8.9 per cent of China's national energy consumption in 2008 (NBS, various years). Even allowing for the planned building of 41 nuclear power stations before 2020, it is estimated that China's nuclear capacity will power only 4 per cent of the national total installed electricity capacity in 2020 (NDRC, 2007a). Since coal is still expected to be the major energy source in the future, it is important for China to find ways to reconcile the continuous use of coal and the protection of the environment.
4.1. China's efforts to minimize non-CO2 emissions in a global context
The Chinese government started to address environmental protection in the 1970s and to control air pollution in the 1980s (State News Office, 2006). In the area of emission control, the first national ambient air quality standards were published in 1982. These specify emission standards for such air pollutants as SO2, Total Suspended Particles (TSP), Nitrogen Oxides (NOx) and CO (SEPA, 1982). In 1998, the Chinese government (State Council, 1998) approved the delimiting of the ‘two control areas’ (sulphur dioxide control area and acid rain control area), which has led to a significant improvement in the environment (State News Office, 2006). Massive pollution control measures were also implemented, such as closing down small resource-wasting and polluting enterprises, renovating resource- and pollution-intensive industries including iron and steel, cement, electrolytic aluminium and coking, and suspending or even terminating numerous projects (State News Office, 2006).
Some financial incentive mechanisms for reducing air pollution are also being used to encourage emissions reduction. A pollution levy system based on the ‘polluter pays’ principle was implemented nationally in 1982, covering air pollution. The collection of SO2 discharge fees has been expanded to include all related enterprises; the rate has been raised steadily and is likely to continue increasing (State News Office, 2006). Tax reduction or exemption is given to enterprises engaged in environmental protection, including emission reductions (State News Office, 2006). A detailed review of the development of the regulatory framework on air pollution, and recent examples, can be found at Shi (Reference Shi, Song and Woo2008) and State News Office (2006).
With these efforts in place, air pollution control seems to be effective. The proportion of industrial SO2, soot and dust that meets discharge standards increased from 61.3 per cent, 67.3 per cent and 50.2 per cent respectively in 2001, to 88.9 per cent, 89.6 per cent and 89.3 per cent respectively in 2008 (CEYP, various years).
In the case of climate change, although the Chinese government has not committed to, and is unlikely to commit to, a cap on CO2 emissions, it has promised a 40–45 per cent reduction of carbon intensity in 2020 with reference to 2005 levels (Xinhua, 2010). Attempts to mitigate CO2 emissions are under way. For example, China's first Integrated Gasification Combined Cycle (IGCC) power station, a 250,000-kWh power station, which will reduce annual coal consumption by 70,000 tonnes and CO2 emissions by 90 per cent compared to a standard power plant, is scheduled to go online in Tianjin in 2011 (China Daily, 2010).
Given that China is the world's largest coal consumer, using 46.9 per cent of the world's total coal consumption in 2009 (BP, 2010), the clean use of coal is of great concern both to China and to the global community. The cleaning of coal is important to the Chinese people and the Chinese economy, as SO2 and other non-CO2 pollutions are by-products of China's economic growth, but with significant costs. Local ambient air pollution is predicted to cost 13 per cent of China's GDP by 2020, as a result of health damage (OECD, 2007). The attempts to clean up the use of coal are also important to the global community if it wants to mitigate the climate change impact of coal use.
As the world's second largest coal consumer, accounting for 15.2 per cent of the world's total coal consumption in 2009 (BP, 2010), the United States has also demonstrated a reconciliation of coal with the environment. In the United States, environmental regulations began to affect the coal industry in 1977 when the Clean Air Act (CAA) amendment established for the first time ‘ceilings’ for different amounts of air pollutants, including particulate matter, CO, SO2 and NOx (Shi, Reference Shi, Garnaut and Song2006). Although experiencing growing environmental regulations from the early 1970s, US coal production continued to increase, its price continued to decline (EIA, 2007) and emissions consistently decreased. For example, national average SO2 concentrations decreased 71 per cent between 1980 and 2008 and 59 per cent between 1990 and 2008 (US EPA, 2010).
India, the world's third largest coal consumer, which consumed 7.5 per cent of the world's total coal usage in 2009 (BP, 2010), is unfortunately an exception to the reconciliation. The emissions from coal in India have not been effectively controlled. The compounded growth rate of CO2 and SO2 emissions in India was above 5 per cent per annum around the year 2000, and was projected to continue to grow due to India's continued dependence on coal in its industrial sector (Menon-Choudhary et al., Reference Menon-Choudhary, Shukla and Garg2005). The Indian case may be a result of insufficient policy interventions in favour of clean coal uses, at least in the case of SO2. For example, the flue gas clean-up systems which are currently available commercially and which have long been used in power plants can remove 99.9 per cent of particulates, 95 per cent of SO2 and 90 per cent of NOx (ASME Council on Engineering, 2005).
When facing a future in which coal will continue to dominate the energy mix and the environment will be strictly projected, high efficiency and clean technology will be crucial for China. However, in general, the problem in China is not a shortage of feasible CCTs, but the lack of their application – the result of insufficient incentives and external pressures (Shi, Reference Shi, Song and Woo2008). For example, most of China's electricity is produced from coal and most coal-fired plants are far dirtier than those found in OECD countries (IEA, 2007); only 10 per cent of power plants had installed Flue Gas Desulphurization (FGD) equipment in 2005 (IEA, 2007); as a cheaper alternative to the use of FGD, coal washing has not been used widely. Washed coal accounted for only 32 per cent of total coal consumption in 2005 (NDRC, 2007b).
4.2. Policy implications
The development and utilization of CCTs should be promoted to make coal use more environmentally acceptable. The application of CCTs, which is often induced by environmental regulation and policy, is a major instrument in converting the goals of environmental regulation into reality. It is necessary to create an institutional environment with appropriate penalties and incentives which stimulates and forces coal users – particularly large-scale users such as steelmakers and power generators – to develop and employ appropriate technology. International cooperation and making use of international cooperation systems such as the Clean Development Mechanism are important to applying new CCTs and funding environmental protection projects.
It should be understood that many CCTs have both environmental and economic benefits and a push for the adoption of CCTs does not necessarily result in negative impact on economic growth. IGCC technology could increase generating efficiencies by 20–30 per cent, with reference to conventional coal-fired power plants, and reduce emission levels (especially of CO2 and SO2) more effectively than present pollution control technologies (EIA, 2001). Captured CO2 can be injected into oilfields to increase the oil recovery rate by 4–18 per cent (Tzimas et al., Reference Tzimas, Georgakaki, Cortes and Peteves2006). Other carbon storage technologies, such as the creation of charcoal by the pyrolysis of biomass (‘biochar’), can not only reduce atmospheric greenhouse gas levels, but also improve soil fertility, increase agricultural productivity and improve water quality (Lehmann et al., Reference Lehmann, Gaunt and Rondon2006).
Improvement of energy efficiency is another practical way to ease the tension between coal uses and the environment. The energy intensity per unit of GDP in China is 20 per cent higher than the OECD average (OECD, 2007), which implies a huge potential for improvement. A 1 per cent increase of efficiency by Chinese coal-fired plants could lead to an annual reduction of carbon emissions of more than 35 million tonnes; such a 1 per cent increase worldwide would reduce atmospheric carbon concentration by 10–20 ppm (Wells, Reference Wells2009). The improvement of energy efficiency can be delivered through commercial methods with the assistance of governments and non-government organizations (Shi, Reference Shi2010).
Appropriate legal regimes such as government policy and environmental regulations in areas such as environmental and energy efficiency should be put in place to force or encourage coal users to reduce their emissions, because many emissions were produced due to lack of application of, rather than a shortage of, available CCTs. Empirical estimations demonstrate that enforcement of environmental regulations plays a significant role in reducing non-CO2 emissions. This simple comparison across countries implies that technology availability is necessary but not sufficient to lead a reconciliation of coal use with the environment. Regulation and affiliated enforcement are also necessary to push or induce coal users to apply CCTs and thus reduce the emission intensity of coal.
Fiscal regimes that create incentives should be established, together with a tightening of regulations. Public funding for R&D and fiscal instruments such as tax holidays and tax credits should be employed. Economic instruments, in particular pricing, could be used to facilitate the reconciliation of coal and the environment. Pollution and carbon prices can also accelerate the pace of technical application by making new technologies more attractive (MIT, 2007).
This experience in reducing non-CO2 emissions and applying CCTs might imply that reduction of the CO2 emissions of coal could be possible in future, since zero or near-zero emissions from coal-fired power plants through carbon capture and storage (CCS) are technologically feasible (Sachs, Reference Sachs2008). Their economic viability can be improved through technical progress and a carbon cap or carbon taxes. Another positive factor is that the economic feasibility of CCT will increase over time, because people are willing to pay more when they are richer (Shi, Reference Shi, Song and Woo2008).
5. Conclusion
This paper tests the relationship between coal use and WGEs over time with two sets of Chinese data. The efforts China has made to achieve these results were briefly discussed and a simple comparison with the other two major coal users, the US and India, was presented. The paper also discusses the role of CCTs, energy efficiency, and legal and fiscal regimes related to environmental protection in reconciling coal and the environment.
The hypothesis that coal has experienced declining emission intensity is demonstrated by China's empirical data relating to three major non-CO2 emissions from coal. The econometric study finds a common declining trend of emission intensity in the three types of pollution and a differentiated declining trend of emission intensities between the two kinds of coal. The decomposition approach quantifies the individual effects of the six decomposed factors in changing total WGE and finds that declining emission intensity had the largest effect on emission reduction.
The decline in emission intensity provides a possible means of resolving the tension between the use of coal and the environment, which can ease the tension between the continuous use of coal to power economic development and increasing demand for environmental protection. Based on these quantitative and qualitative findings, the paper argues that coal has been, and is likely to be, reconciled with the environment in the case of non-CO2 emissions. Since CO2 is technically removable, such declining emission intensity could be applied to the case of CO2 in a carbon-constrained future.
The development and application of CCTs are important for the reconciliation of coal and the environment. The improvement of energy efficiency is another method for harmonizing the use of coal with the environment, and can be implemented through commercial methods. The application of CCTs and energy efficiency has both environmental and economic benefits. However, policy interventions are necessary and crucial to support the adoption of CCTs and the improvement of energy efficiency. Legal and fiscal regimes, including environmental regulations and economic instruments, should be established to push or encourage the adoption and development of CCTs. Enforcement of environmental regulations is also effective in facilitating the emission reduction and thus reconciliation.
This paper may be subject to criticism with regard to data quality, as it has been observed that environmental monitoring systems in China are being gradually improved, leaving scope for recording more accurate data in future. However, this observation will strengthen, rather than weaken, the empirical findings because even with a more accurate statistical record later on, there is evidence of significant estimated improvement of environmental performance over time.


