Soil moisture plays an important role in the terrestrial water cycle (Wang et al. Reference Wang, Shao, Liu and Warrington2012a; Huang et al. Reference Huang, Shi, Zhu, Zhang, Ai and Yin2016) and has great ecological significance because of its limiting effects on plant growth, especially in the semi-arid Loess Plateau (Yang et al. Reference Yang, Wei, Chen and Mo2012a, Reference Yang, Wei, Chen, Chen and Wang2014a). Soil moisture is mainly influenced by such factors as precipitation, evaporation and infiltration, and is partially controlled by biotic factors such as plant transpiration and root absorption (Chen et al. Reference Chen, Shao and Li2008; Cao et al. Reference Cao, Chen, Shankman, Wang, Wang and Zhang2011; Yang et al. Reference Yang, Wei, Chen, Jia and Mo2012b). In addition, soil moisture has significant implications for hydrological modelling, meteorological prediction, sustainable agriculture production, soil conservation and vegetation guidance (Starks et al. Reference Starks, Heathman, Jackson and Cosh2006; Brocca et al. Reference Brocca, Tullo, Melone, Moramarco and Morbdelli2012).
Soil moisture is extremely variable in both space and time (Famiglietti et al. Reference Famiglietti, Ryu, Berg, Rodell and Jackson2008; Heathman et al. Reference Heathman, Cosh, Merwade and Han2012). The emerging body of literature on the Loess Plateau emphasises the fact that temporal soil moisture variations can be divided into three phases: stable, consumption and compensation (Jia Reference Jia2006; Wang et al. Reference Wang, Zhu, Liu, Kuang and Zhao2011). For example, Jia (Reference Jia2006) divided the temporal variations of soil moisture under Caragana korshinskii Kom. and Hippophae rhamnoides in the loess hilly area into four phases, including a relatively stable stage (October–March), a slow evaporation stage (April–May), a serious deficit stage (June–July) and a rain compensation stage (July–September). However, Wang et al. (Reference Wang, Zhu, Liu, Kuang and Zhao2011) concluded that soil moisture changes mainly consist of recovery, consumption and replenishment periods during the growing season under different forests in the northwestern Loess Plateau. In addition, soil moisture variation with depth is an inevitable part of soil moisture dynamics. For example, Qiu et al. (Reference Qiu, Fu, Wang and Chen2001) and Fu et al. (Reference Fu, Wang, Chen and Qiu2003) concluded that the soil moisture content (SMC) variations in soil profiles may be considered to decrease or increase or to fluctuate with increasing soil depth. Some researchers also divided Sea buckthorn soil profiles into a weakly exploited layer, a use layer, a replenished adjustment layer and a weak adjustment layer based on the soil moisture utilisation by plant roots (Ruan & Li Reference Ruan and Li1999). Soil moisture dynamics, especially in deep soil layers, may significantly influence hydrological processes (Gao & Shao Reference Gao and Shao2012; Zhu et al. Reference Zhu, Shi, Fang, Wu, Guo and Zhang2014). However, most previous studies have only focused on shallow soil moisture dynamics, with few studies considering depths of more than 500cm. Moreover, because of climatic, topographical and soil texture differences, as well as the different division criteria, there is still great disparity in the methods used to divide soil moisture (Li et al. Reference Li, Zhang, Tan, Gao, Liu and Wang2014; Huang et al. Reference Huang, Shi, Zhu, Zhang, Ai and Yin2016). Thus, knowledge of deep soil moisture dynamics is necessary for understanding soil moisture variations with depth and for efficiently managing soil moisture utilisation.
Caragana korshinskii Kom., a perennial, deciduous and drought-tolerant mesquite, is widely distributed in the northern arid and semi-arid regions of the Loess Plateau with an average annual precipitation of 100–550mm, and is an important species for stabilising vegetation. A well-established body of literature indicates that C. korshinskii is ecologically effective at conserving soil and water resources (Li et al. Reference Li, Gao, Xu and Liu2006; Jian et al. Reference Jian, Zhao, Fang and Yu2014) and can improve soil structure and soil fertility (Niu et al. Reference Niu, Ding, Zhang and Xu2003; Zheng et al. Reference Zheng, Xie, Gao, Jiang, Shimizu and Tobe2004). C. korshinskii develops stems with many fasciculate branches and a strong root system to adapt to poor soil nutrient conditions and drought. However, large-scale ecological restoration by water demanding C. korshinskii vegetation has already resulted in serious ecological problems, such as habitat deterioration, vegetation degeneration and widespread death, and soil desiccation throughout the soil profile (Zheng et al. Reference Zheng, Gao, Teng, Feng and Tian2015; Fan et al. Reference Fan, Wang, Scott and Shao2016). Thus, it is of great ecological importance to understand the soil water dynamics in stands of C. korshinskii of different ages on the Loess Plateau.
We conducted long-term monitoring of the deep soil moisture dynamics in three C. korshinskii shrublands of different ages in a semi-arid region of the north-central Loess Plateau, China. Specifically, our objectives were to (1) systematically investigate how C. korshinskii shrubs affect deep soil moisture during the growing season and acquire information about the spatial–temporal characteristics of soil moisture, (2) identify soil moisture fluctuations with variations in C. korshinskii stand age and (3) analyse soil desiccation and soil moisture storage variations in different soil layers. We hope that the results of this study will be helpful for understanding the causes of soil desiccation in semi-arid regions of the Loess Plateau and will provide valuable information for plant restoration and land management practices.
1. Materials and methods
1.1. Study site
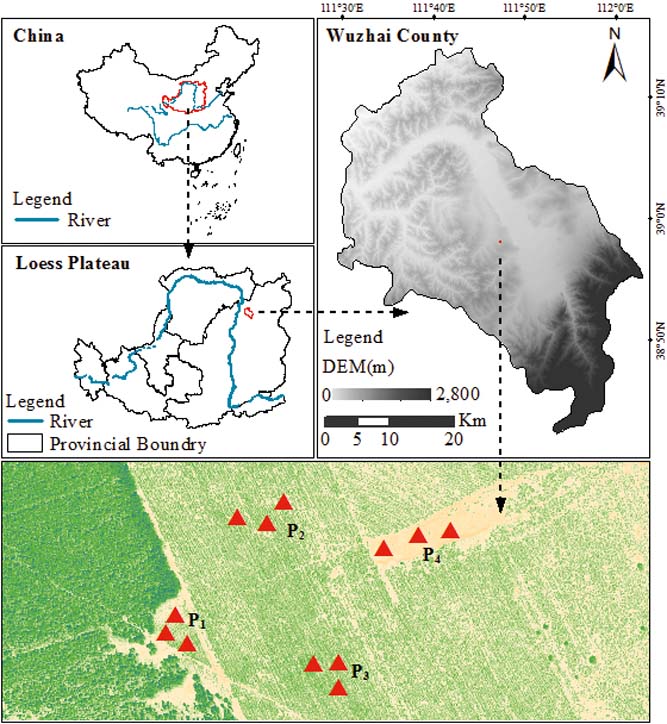
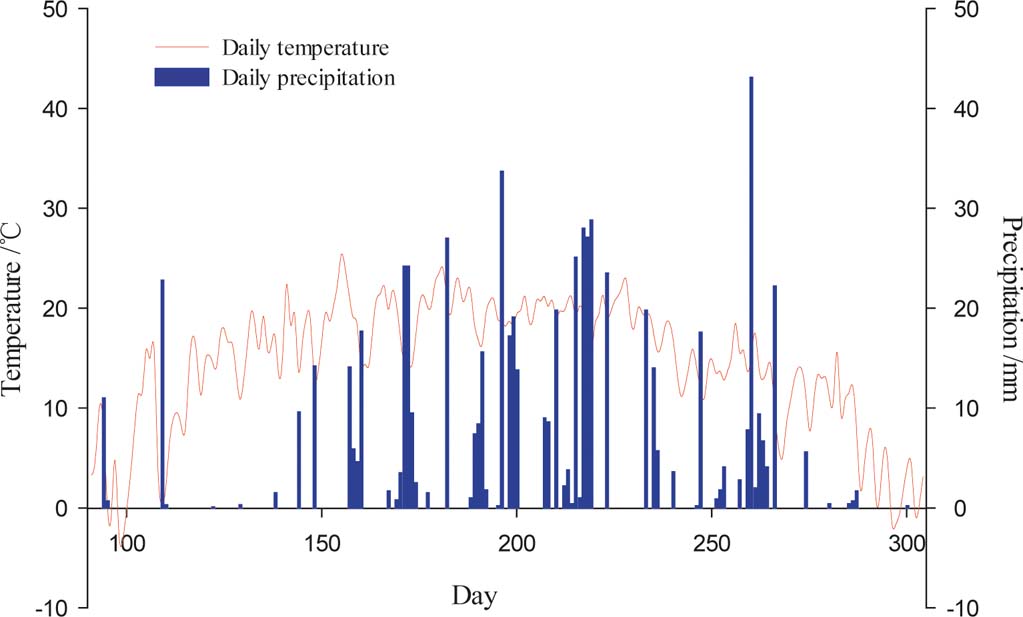
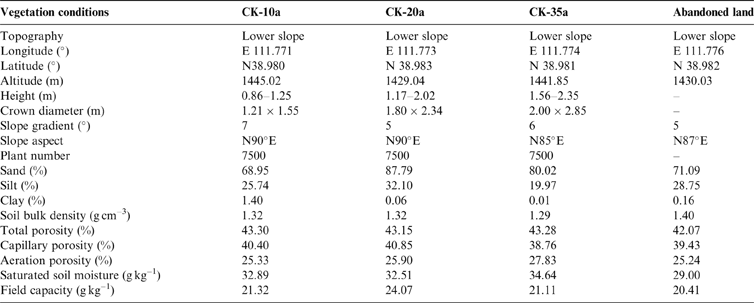
The study was conducted at the Zhangjiaping Forestry Centre [111±46.296′E, 38°58.825′N; 1448m altitude], which is located in Wuzhai County in the northwestern region of Shanxi Province, northern Loess Plateau of China (Fig. 1). The landscape is characterised as a hilly gullied Loess Plateau and has a temperate and monsoonal climate with four distinct seasons. The climate is dry and windy in the spring and rainy in the summer and autumn. The annual mean precipitation is 478.5mm (1980–2013) with great seasonal variations, of which over 70 % falls between June and September in the form of storms (Fig. 2). The average annual pan evaporation is 1784.4mm (Shi et al. Reference Shi, Qin and Chen2015). The average monthly air temperature ranges from −13.2 °C in January to 20.0 °C in July, with an average annual temperature of 4.8°C, and the accumulated temperature above 10°C is 2500°C. The annual average sunshine hours are 2872h, and the annual average frost-free period is 125d. The soils are predominantly light chestnut cinnamon soils, which are classified as Cambic Arenosols according to the FAO/UNESCO soil classification system and have loose, sandy textures with little organic matter (Yang et al. Reference Yang, Zhang, Wang, Zhang and Chen2011). The soil texture, especially the sand and silt contents, varied with vegetation age, with sand and silt contents ranging from 68.95 % to 87.79 % and 19.97 % to 32.10 %, respectively (Table 1). The ground water table was approximately 60–80m below the soil surface, which precluded upward capillary flow into the topsoil layers of the roots zone (Wang et al. Reference Wang, Shao, Liu and Zhang2012b). The relevant characteristics and soil hydraulic parameters of each sample plot are represented in Table 1. Because the soil texture was almost homogeneous in the soil profile (Zhao et al. Reference Zhao, Shao, Jia and Zhang2016), we hypothesised that the soil properties at a particular depth were similar. The soil moisture characteristics under three C. korshinskii stands of different ages (10 years (CK-10a), 20 years (CK-20a) and 35 years (CK-35a)) were measured. We used abandoned land as a control group.

Figure 1 Location of the sampling sites in Wuzhai County on the Loess Plateau of China. The red triangles represent the four sampling sites, i.e., CK-10a (P1), CK-20a (P2), CK-35a (P3) and the abandoned land (P4).

Figure 2 Daily temperature and precipitation during the growing season in 2013.
Table 1 Main characteristics and soil (moisture) parameters for each sample plot. The abandoned land was considered to represent as the background soil moisture content.

1.2. Plant species
The study area is covered by Populus simonii Carr., Populus cathayana Rehd., Salix matsudana Koidz., Pinus tabulaeformis Carr., Caragana korshinskii Kom., Bothriochloa ischcemum (L.) Keng, Artemisia spp. and Agriophyllum squarrosum (L.) Moq. Caragana korshinskii is the dominant pioneer species in the study area and has been widely planted for use as windbreaks and sand binders since the 1960s. The planting of these shrubs has resulted in stands with ages of 10, 20 and 35 years (represented by CK-10a, CK-20a and CK-35a, respectively).
1.3. Measurement methods
1.3.1. Soil sampling
To avoid being affected by different topographic features, such as slope position, gradient and aspect, the sampling points were selected where the site conditions were similar on the same slope. Three plots of C. korshinskii shrubs of different ages (10a, 20a, 35a) and a control (abandoned land) were demarcated and marked with a GPS receiver with 5-m precision in the study area. Four quadrats were chosen at the study site. In each quadrat, soil samples were collected in three repeats once a month from late April to late October in 2013. Soil sampling was performed using a W-shaped sampling pattern, and samples were collected from three different depths approximately 1m from the base of a C. korshinskii shrub to calculate the mean SMC. Soil samples were collected by a traditional soil-drilling auger (5cm in diameter), and the soil sampling depth was 0–600cm at an interval of 10cm (Wang et al. Reference Wang, Shao and Liu2010a). At each point, 60 samples were collected. Once collected, the soil samples were sealed in containers and taken to the laboratory. After field sampling, the soil samples were weighed. Precipitation and temperature data were obtained from the local national weather station 2km away from the study site.
At each sampling site, three undisturbed soil cores were synchronously collected with metal cylinders (5cm inner diameter, 5cm height, 100cm3 volume) to measure the soil bulk density (BD) and determine the field capacity (FC), saturated SMC, total porosity (TP), capillary porosity (CP) and aeration porosity (AP) by the cylinder soak method (Fang et al. Reference Fang, Zhao, Wang, Feng, Ding, Liu and Zhang2016). Simultaneously, disturbed soil samples from depths of 0–100cm (at 10-cm intervals, three sub-samples per sample) were collected and air dried. Then, the soil samples were sieved through a 2-mm screen and roots and other non-soil materials were removed. Soil particle size was determined by the laser-diffraction method (Malvern Mastersizer 3000, Malvern, England) (Liu et al. Reference Liu, Tong and Li2005) and was used to determine the proportions of clay (<0.002mm), silt (0.002–0.02mm) and sand (>0.02mm) in the samples.
1.3.2. Laboratory analysis and data preparation
An oven-drying method was used to measure SMC. Gravimetric SMC (g H2O/g dry soil, %) was determined from the loss in mass following oven drying at 105°C until a constant mass was achieved (Wang et al. Reference Wang, Wang, Wei, Shao and Li2008).
The gravimetric SMC in each soil layer was calculated as follows:
 $${\rm SMC} = { g_1 - g_2 \over g_2 - g } \times 100%$$
where SMC is the gravimetric soil moisture content in each soil layer (%), g is the weight of the empty aluminium box (g), g 1 is the weight of both the empty aluminium box and the wet soil before oven drying (g) and g 2 is the weight of both the empty aluminium box and the oven-dried soil (g).
The soil moisture storage (SMS) in the soil layers was calculated using the following equation:
 $${\rm SMC} = \sum^n_{i=1} {\rm BD} \times {\rm SMC}_i \times H_i \times 0.1$$
where SMS is reported in mm, BD is the mean soil bulk density (which was 1.3gcm–3 in this study), SMCi is the gravimetric SMC in the ith soil layer (%), and Hi is the soil depth of the ith soil layer (mm).
The relative soil moisture content (RSMC) was used to evaluate the soil moisture availability and was calculated as follows:
 $${\rm RSMC} = { {\rm SMC} \over {\rm FC} }$$
where RSMC is reported in mm, FC is the mean field capacity (%), which equals 21.7 % in our study. Based on the soil moisture availability results for loamy soils on the Loess Plateau presented by Yang & Shao (Reference Yang and Shao2000), the degree of soil moisture availability was divided as follows: infiltrated gravitational moisture (100 % water-filled pore space), very easily available soil moisture (80 % water-filled pore space), easily available soil moisture (50 % water-filled pore space), moderately available soil moisture (30 % water-filled pore space) and unavailable soil moisture (<30 % water-filled pore space).
1.4. Statistical analysis
The standard deviation (SD), coefficient of variation (CV) and range (R) values were calculated to indicate the variations in SMC in different soil profile layers. One-way analysis of variance (one-way ANOVA) was performed to evaluate the differences in the mean SMCs among the different soil depths and growth ages. Differences were analysed at the 0.05 significance level. When significance was evaluated at the P<0.05 level, multiple comparisons were made by means of the least significant difference (LSD) test. All statistical analyses were performed with Microsoft Excel (vision 2010), SPSS (version 17.0) and SigmaPlot (version 12.5). The map of the study area in the Loess Plateau was produced using GIS software (version: ESRI®ArcMapTM 10.0).
2. Results
2.1. Seasonal dynamics of soil moisture under Caragana korshinskii Kom. stands of different ages
The monthly variations in SMC under C. korshinskii stands of different ages are shown in Figure 3. Temporal variations in the SMC under the C. korshinskii stands of different ages were similar during the growing season. The SMC in CK-10a decreased to its lowest value (11.40 %) from April to May and then gradually increased to its highest value of 13.67 % by the end of the growing season. The SMC in CK-20a initially decreased dramatically to its lowest value of 10.22 % within the growing season and then increased to 13.28 % with drastic fluctuations in October. The SMC in CK-35a varied some and then increased from the beginning of the growing season to August before sharply decreasing in September and then increasing to its maximum value in October. Generally, the SMCs under the C. korshinskii stands with three different ages decreased from April to May at the beginning of the growing season and then increased and reached the highest values by the end of the annual growing season before decreasing some in September. Of the three stands of C. korshinskii, the monthly average SMC decreased in the following order: CK-10a>CK-20a>abandoned land>CK-35a. This result indicated that the SMC decreased as the age of the forest stand increased.

Figure 3 Variation of the SMC under C. korshinskii plants of different ages and in the abandoned land.
During the growing season, the SMC under three stands of C. korshinskii reached minimum and maximum values by the end of May and October, respectively, which was highly consistent with precipitation variations, especially during May, which had the lowest precipitation (approximately 25.70mm) (Fig. 2). As the one-way ANOVA analysis results indicate, the monthly average SMCs for the three stands of C. korshinskii and the abandoned land demonstrate a significant difference (P<0.01), except for June (F=7.561, P<0.05).
2.2. Vertical variations in soil moisture under stands of Caragana korshinskii Kom. of different ages
2.2.1. Vertical variations in SMC under Caragana korshinskii Kom. stands of different ages
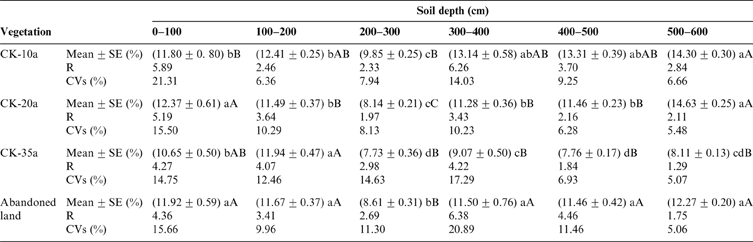
Figure 4 shows the vertical variations in the SMC under C. korshinskii shrubs of different ages at depths of 0–600cm. The vertical variation in SMC within the soil profiles was similar despite small differences in depth. The mean SMC increased from 9.34 % (CK-10a) in the surface soil layer to 14.68 % (CK-10a) at a depth of 100cm and then decreased to 9.69 % (CK-10a) at 300cm. However, below 300cm, the mean SMC fluctuated and then increased to 15.73 % (CK-10a) at 600cm. The highest SMC was 16.28 % (CK-10a) at 360cm, while the SMCs in CK-20a, CK-35a and the abandoned land were 15.44 %, 13.71 % and 14.11 % at depths of 600, 110 and 390cm, respectively. The smallest SMC values were 8.67 % (CK-10a), 7.29 % (CK-20a), 6.25 % (CK-35a) and 7.32 % (abandoned land) at depths of 270, 250, 290 and 300cm, respectively.
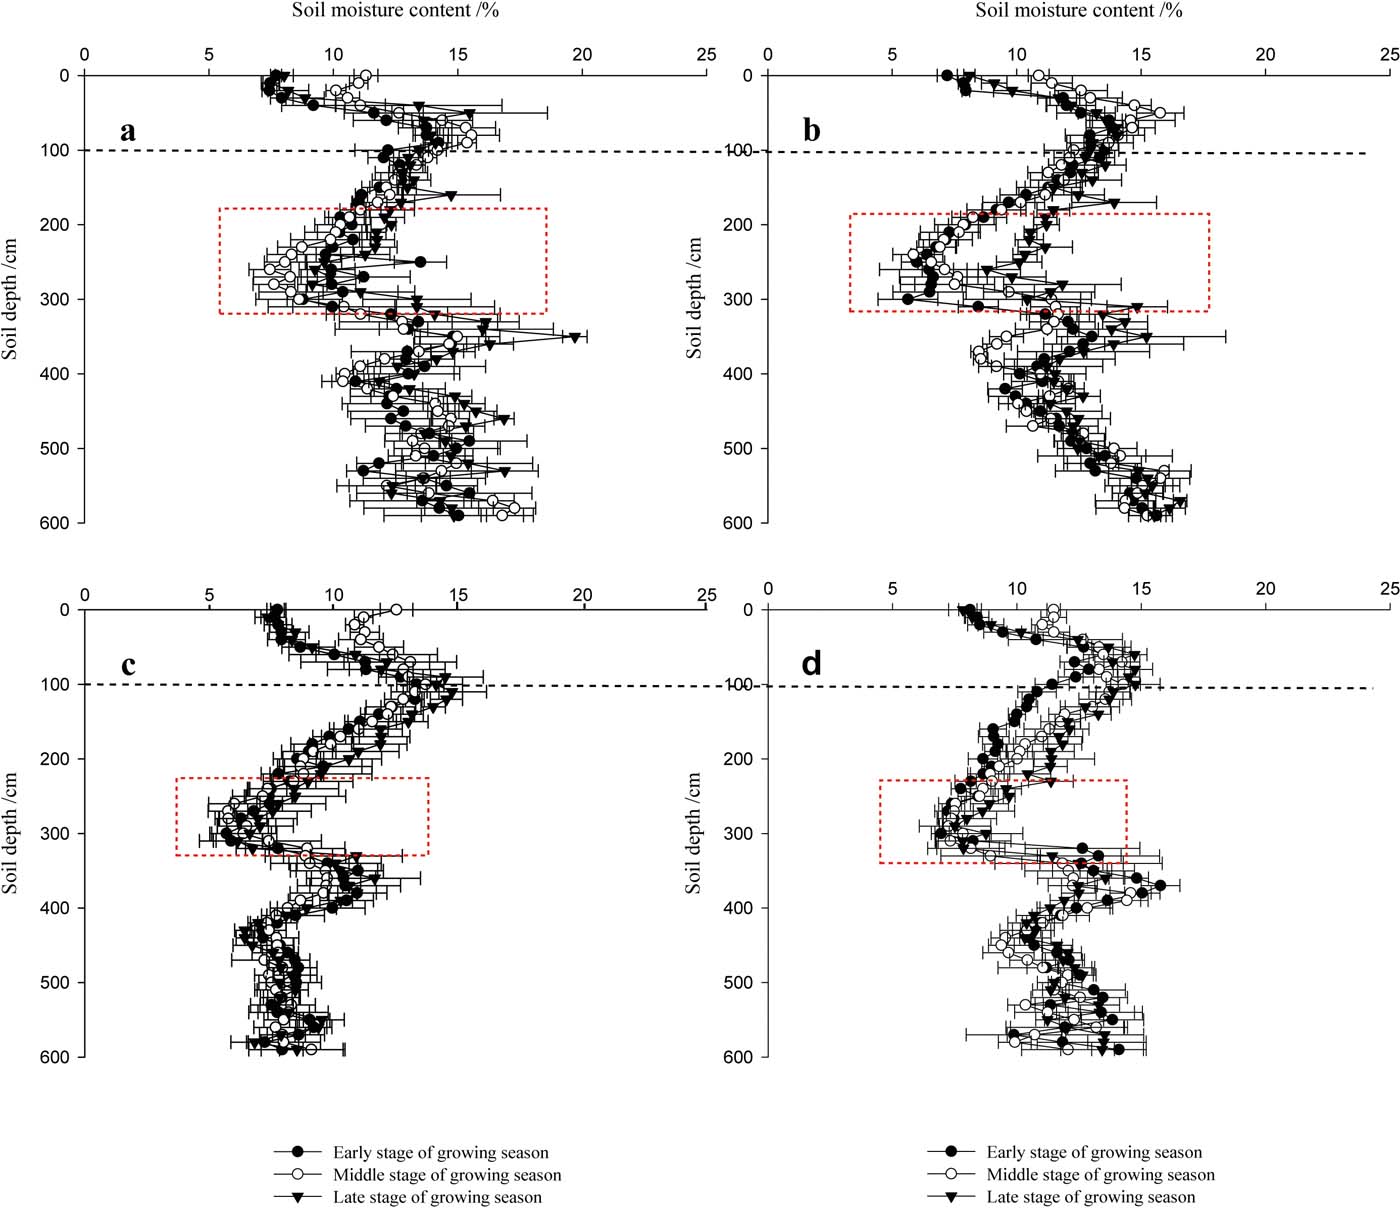
Figure 4 The vertical variation of the SMC at soil depths of 0–600cm under C. korshinskii plants of different ages and in the abandoned land. a, b, c and d represent CK-10a, CK-20a, CK-35a and the abandoned land, respectively.
Generally, at a depth of 0–100cm, the mean SMC showed great instability with a very small SMC value. In contrast, at 500–600cm, the average SMC fluctuated to a maximum value with increasing depth. Consequently, the vertical variation of SMC at depths of 0–600cm in the soil profiles could be classified into three layers: 0–100cm (small increase), 100–300cm (marked decrease), and 300–600cm (increase with fluctuations). Notably, the average SMC remained nearly constant below 420cm in CK-35a. According to the one-way ANOVA results of the profile SMC (Table 2), there were no significant differences among the three C. korshinskii stands with different ages and the abandoned land for soil depths of 0–300cm, but significant differences were found for depths of 300–600cm (P<0.01).
Table 2 The characteristics of the soil moisture in the 0–600cm soil layers under C. korshinskii plants of different ages and in the abandoned land. SE indicates the standard error. The same letters in the table indicate no significant difference between each pair, and different letters indicate significant differences. Lowercase letters indicate a significant difference at the 0.05 level, and capital letters indicate a significant difference at the 0.01 level.

2.2.2. Variations in SMC under Caragana korshinskii Kom. stands of different ages
The R and CV (%) of the SMC data were used to describe the extent of soil moisture changes. As shown in Figure 5, the R and CV values under the three C. korshinskii stands of different ages decreased with increasing soil depth. Overall, the R and CV generally had an irregular negative correlation with the mean soil moisture with depth in the soil profiles, except from 300–400cm. In the 0–100 and 300–400cm soil layers, the R and CV values were the largest. Therefore, it could be concluded that the R and CV plots exchanged actively between 0–100 and 200–300cm and remained relatively stable from 500–600cm. Additionally, as the forest age increased, the R and CV of the SMCs for the C. korshinskii stands of different ages showed irregular trends with depth. The R and CV varied drastically in the CK-10a and CK-35a shrublands, but relatively gentle in CK-20a.
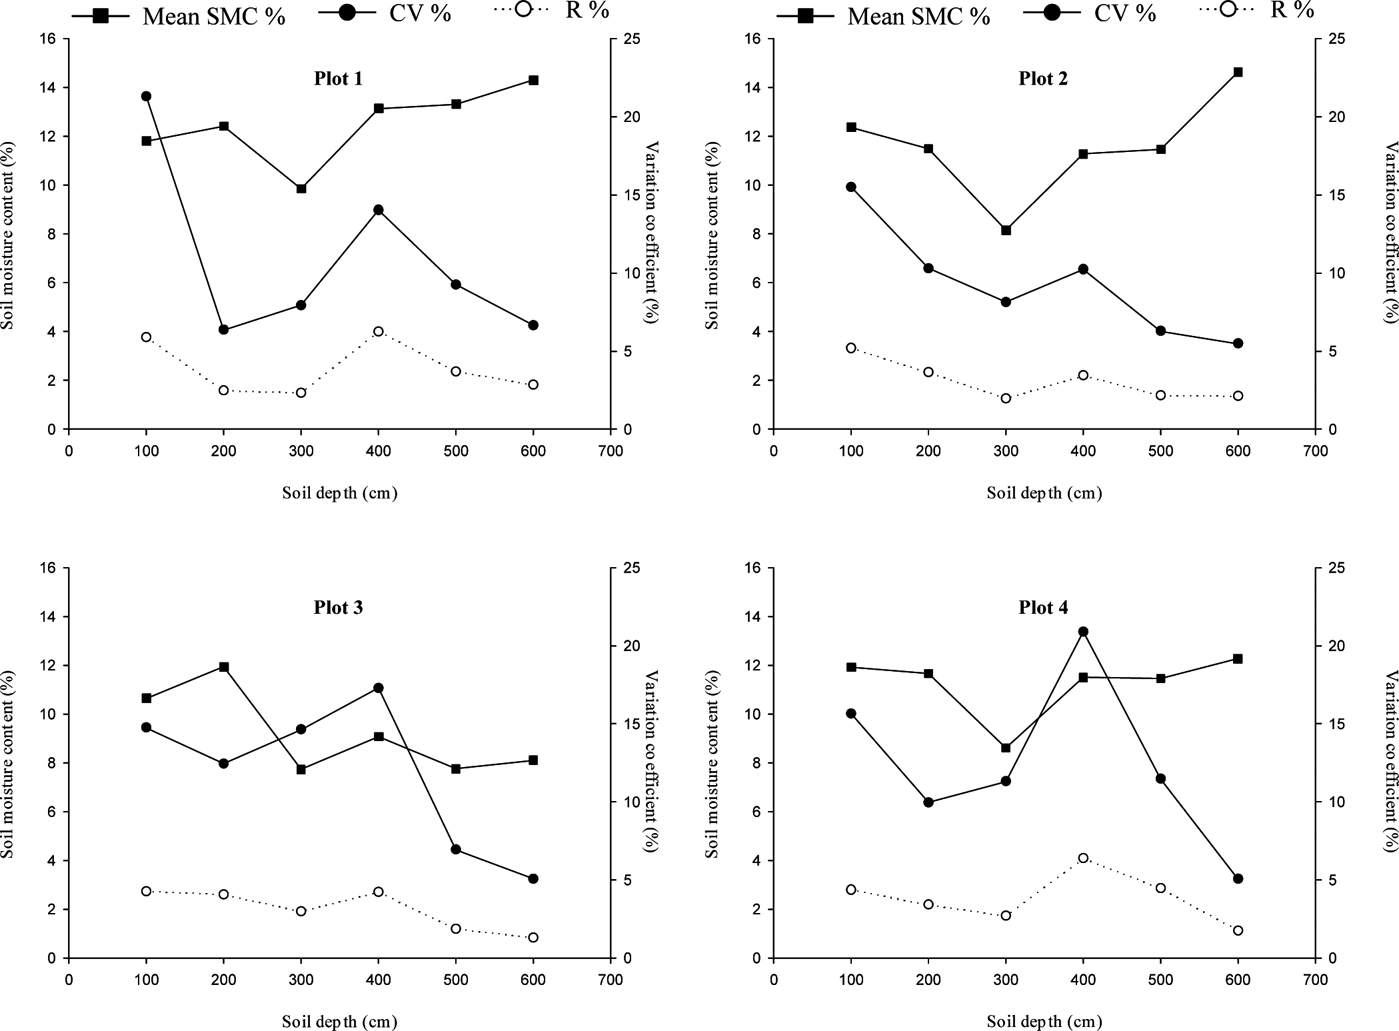
Figure 5 The soil moisture range in the soil profile and the variation coefficients under C. korshinskii plants of different ages and the abandoned land. Plots 1–4 show the results for CK-10a, CK-20a, CK-35a and the abandoned land, respectively.
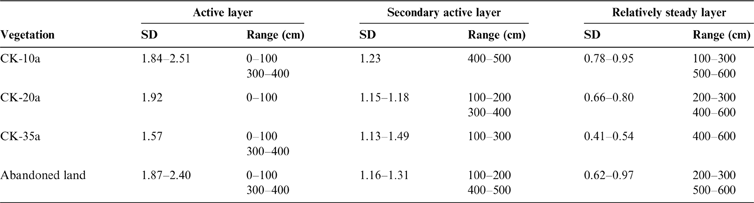
Table 3 shows the classified soil moisture layers under C. korshinskii stands of different ages based on the SD of the SMC. According to the discrimination index of SD value used by Sun et al. (Reference Sun, Huang, Chen, Liu and Wen1998), the whole soil profile can be divided into an active soil layer (SD>1.5), a secondary active soil layer (1<SD<1.5) and a relatively uniform soil layer (SD<1). Some differences with depth were observed; however, the active soil layer was generally from 0–100 and 300–400cm, and the relatively uniform soil layers were from 500–600cm. The remaining profiles in each plot were relatively steady.
Table 3 The range of the active soil moisture layer under C. korshinskii plants of different ages and in the abandoned land.

2.3. Evaluation of soil moisture availability under Caragana korshinskii Kom. stands of different ages
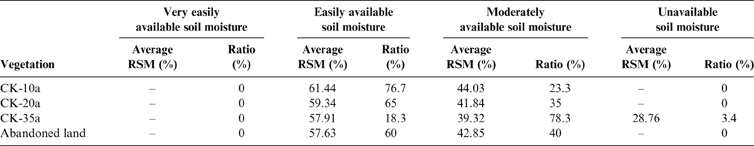
Table 4 shows the soil moisture availability classification results and the proportion of each soil moisture availability grade in the entire soil profile. None of the four plots had gravitational moisture or very easily available soil moisture within 0–600cm. Moreover, except for a small proportion of CK-35a, no unavailable soil moisture was present in the other three sampling plots, which further indicated serious soil moisture deficit conditions. In general, the average RSMC in the C. korshinskii shrub lands gradually decreased with the age of the stand. The proportion of easily available soil moisture in the entire soil profile was consistent with the average RSMC, while the proportion of moderately available soil moisture in the measured soil profile showed the opposite tendency.
Table 4 Soil moisture availability in soils under C. korshinskii plants of different ages and in the abandoned land.

3. Discussions
3.1. Temporal dynamics of soil moisture under Caragana korshinskii Kom. stands of different ages
The seasonal soil moisture dynamics were markedly affected by climatic factors, such as the amount of precipitation, the seasonal distribution of precipitation and temperature variations (Qiu et al. Reference Qiu, Fu, Wang and Chen2001; Zhu et al. Reference Zhu, Shi, Fang, Wu, Guo and Zhang2014). During the growing season, the SMC under C. korshinskii stands with different ages decreased and then increased slowly with fluctuations, which was consistent with the seasonal rainfall variations. The monthly average SMC tended to decrease as forest age increased, generally revealing the following trend: CK-10a > CK-20a>abandoned land>CK-35a. However, the SMC varied greatly over time during the growing season. In June, the average SMC was significantly different (P<0.05), and the average SMC in the remaining monitored months reached an extremely significant level (P<0.01).
Because of the seasonal variations in precipitation and temperature, soil moisture within the growing season can be classified into four stages. In the first stage (April), the temperature increases rapidly, the effective precipitation is insufficient (60.5mm) and water evaporates quickly from the soil because of intense solar radiation. As the vegetation grows, the SMC is greatly reduced. As the stand age increases, the rate of soil moisture use increases (Guo Reference Guo2009; Guo & Shao Reference Guo and Shao2010). Until May, the SMCs for the C. korshinskii stands of different ages decrease to minimum values during the growing season. In the second stage (June and August), the SMC increases slightly to a peak in mid-August as the precipitation significantly increases (295mm). In this stage, rainfall infiltration is significantly higher than forest transpiration and surface evapotranspiration. In late summer and early autumn (August and September), as C. Korshinskii grows, the demands of vegetation for water increase and evaporation intensifies; thus, the SMC in each soil layer decreases. After the late autumn (October) and as a result of the low temperature, the shrubs stop growing and both water demand and evaporation decrease. Rainfall from the end of September to early October caused slightly replenishes in the SMC, and the SMCs of each soil layer rapidly increased to the highest or second highest SMCs for the year. These results correspond with the results of Yang et al. (Reference Yang, Zhang, Wang, Zhang and Ji2010), who achieved similar results among 10a, 20a and 40a C. korshinskii shrub lands at the same measurement sites in 2006.
3.2. The spatial dynamics of soil moisture under Caragana korshinskii Kom. stands of different ages
In the semi-arid loess hilly region, thick loess deposits were dominant with groundwater at depth. Thus, precipitation is the only source for soil moisture replenishment and plays a critical role in soil moisture dynamics (Wang et al. Reference Wang, Shao and Shao2010b; Yang et al. Reference Yang, Wei, Chen, Jia and Mo2012b; Huang et al. Reference Huang, Shi, Zhu, Zhang, Ai and Yin2016). Simultaneously, the SMC is affected by various vegetation processes, including water absorption and utilisation, and transpiration, and by vegetation cover as well as plant root distribution (Bao et al. Reference Bao, Wang, Li, Zhang and Su2015; Shi et al. Reference Shi, Qin and Chen2015). As the forest stand age increased, the soil moisture consumption by the C. korshinskii shrubs increased significantly (Zhang et al. 2009; Wang et al. Reference Wang, Shao, Liu and Zhang2012b). C. korshinskii shrubs with different ages had various soil moisture sources. Young and moderately old C. korshinskii mainly utilised infiltrated precipitation, while old-growth shrubs utilised both shallow and deeper soil moisture (Su et al. Reference Su, Li, Liu, Xu and Sun2014; Bao et al. Reference Bao, Wang, Li, Zhang and Su2015). The SMCs in the deep soil layers decreased as the forest age increased.
The SMC within depths of 0–600cm generally decreased with depth and reached a minimum at 300cm. Wang et al. (Reference Wang, Shao, Liu and Zhang2012b) and Wang et al. (Reference Wang, Shao and Liu2013) reported similar results for the Loess Plateau and showed that the SMC decreased and then increased from 0–500cm. Additionally, the soil depth of 200–300cm played an important role in connecting the shallow soil with the deeper soil and in controlling soil moisture variations (Liang et al. Reference Liang, Shi, Niu, Gu and Guo2014), which could be explained by the plant root distribution and water uptake (Yang et al. Reference Yang, Chen, Wei, Yu and Zhang2014b). Shao et al. (Reference Shao, Guo, Xia and Wang2010) also reported that most of the ≤2mm roots in CK-16a were distributed at depths of 0–150cm on the Loess Plateau, which may further explain the above observation.
In addition, the soil moisture utilisation depth was highly consistent with its root distribution. For instance, the soil moisture utilisation of CK-10a and CK-20a was mainly concentrated in the 0–300cm soil layers, which indicated that their roots were mainly located within the upper 300cm of soil; meanwhile, the number of roots in CK-20a was much greater than the number of CK-10a roots (Zhang et al. 2009; Bao et al. Reference Bao, Wang, Li, Zhang and Su2015; Shi et al. Reference Shi, Qin and Chen2015). Additionally, apart from the 0–300cm soil layers, soil moisture was extracted at the CK-35a site below 300cm, which was ascribed to the root distribution characteristics of the shrub. C. korshinskii has well-developed stems and a strong root system capable of extending into deeper soil layers to uptake deep soil water to make up for insufficient soil moisture in shallow soil layers (Yang et al. Reference Yang, Zhang, Wang, Zhang and Chen2011). For the abandoned land, however, the soil moisture utilisation zone was considerably shallower owing to the presence of sparse vegetation, including scattered herbs, with shallow roots and low productivity. Therefore, the average soil moisture variation with depth was relatively small for the abandoned land.
The R, CV and vertical SD of SMC were employed to describe soil moisture profile variations. The vertical soil profile was divided into active, secondary active and relatively steady soil layers. The soil moisture in the shallow (0–100cm) and medium layers (300–400cm) fluctuated actively, and that in the 500–600cm remained relatively stable.
3.3. Soil moisture availability under Caragana korshinskii Kom. stands of different ages
Soil moisture availability was used to reflect the amount of reserve soil moisture available as well as describe how difficult it is for plants to use the soil moisture (Lv et al. Reference Lv, Wang, Dang, Zhou and He2015). In our study, as the age of the forest stand increased, the RSM of each soil moisture availability grade decreased. For example, under CK-10a, easily available soil moisture, mainly at 50–210cm and below 320cm, accounted for 76.7 % of the water in the soil profile, and the rest of the soil moisture was moderately available with a RSMC of 44.03 %. The amount of soil moisture available at CK-35a was small. Moderately available soil moisture, with a RSMC of 39.32 %, accounted for the largest proportion (78.3 %) of soil moisture within the entire soil profile. Additionally, some unavailable moisture was present at 300cm. One explanation for the observed results is that the physio-ecological characteristics of the sites may impact soil moisture when transpiration is higher (Xu & Shan Reference Xu and Shan2004). In addition, C. korshinskii shrublands are very resistant to drought (Wang et al. Reference Wang, Zhang, Wang, Liu and Wang2014). The soil moisture consumption drastically increased with increasing forest age, which resulted in low soil moisture availability in older C. korshinskii shrublands (Liang et al. Reference Liang, Shi, Niu, Gu and Guo2014; Bao et al. Reference Bao, Wang, Li, Zhang and Su2015).
3.4. Implications for deep soil moisture resources and vegetation management
The semi-arid Loess Plateau is a typical water-limited region. Soil moisture is the primary factor that limits vegetation establishment and growth, and water shortages gradually become the critical limiting factor to primary production (Ruiz et al. Reference Ruiz, Zaragoza and Cerrato2007). Large-scale afforestation on the Loess Plateau has increased the regional vegetation cover and the effectiveness of soil erosion control (Feng et al. Reference Feng, Sun, Fu, Su, Liu and Lamparski2012), but the negative impacts of this afforestation still need to be resolved. The present results show that the deep soil moisture, especially in old C. korshinskii stands (35years), was similar or even below the SMCs in the abandoned land (11.24 %), which indicated that revegetation might result in soil moisture deficits (Mendham et al. Reference Mendham, White, Battaglia, McGrath, Short, Ogden and Kinal2011; Wang et al. Reference Wang, Shao and Liu2013) or even soil desiccation. Generally, shrubs can extract more soil moisture from deep soils than grasses and crops, especially in water-consumed plantations, such as C. korshinskii plantations, which have extensive root systems. Precipitation plays an important role in the soil–plant–atmosphere continuum (SPAC). Plant–soil moisture relationships are important for ecological recovery and restoration. Although soil moisture can be slightly recharged by infiltration from rainfall, the maximum soil moisture replenishment depth is approximately 100cm and is no more than 200cm under C. korshinskii shrubs (Wang et al. Reference Wang, Shao and Shao2010b; Gao et al. Reference Gao, Wu, Zhao, Shi, Wang and Zhang2011, Reference Gao, Shao, Peng and She2015). Thus, it is reasonable that establishing large-scale pure woodlands or shrublands might not be an optimal strategy for vegetation reconstruction in water-limited environments. Methods for retaining moisture and vegetation are crucial. Revegetation of the arid Loess Plateau is complicated, and further study should concentrate on the long-term soil moisture dynamics within soil profiles under C. korshinskii shrubs of different ages and the effects of associated environmental controls (e.g., slope topography, soil properties and precipitation types).
4. Conclusions
Variations in SMCs under C. korshinskii shrubs of different ages are highly consistent with seasonal precipitation variations during the growing season. The combined effects of precipitation amount and intensity, vegetation requirements and monthly SMC varied greatly during the growing seasons, initially decreasing from April to May and then slowly increasing with some fluctuation from June to October. The SMC generally decreased as follows: CK-10a>CK-20a>abandoned land>CK-35a. Vertically, the SMC markedly decreased from 0–300cm and then fluctuated and increased from 300–600cm. It is apparent that 200–300cm was the critical depth where plant roots played significant roles in connecting the shallow and deeper soil layers. The entire profile was divided into active, secondary active and relatively steady soil layers based on the R, BD and CV values of the SMC. Soil moisture is commonly exchanged at soil depths of 0–100 and 300–400cm and remains relatively constant in deeper soil layers. The soil moisture availability gradually decreased with increasing forest age, especially for CK-35a, which had a small proportion of unavailable soil moisture. In addition, our study demonstrated that the growth of C. korshinskii is threatened under soil moisture stress. Thus, it is important to rethink large-scale pure woodland or shrubland restoration in arid environments.
5. Acknowledgements
This research was financially supported by the National Natural Science Foundation of China (No.41571503 and No.41390462) and the Science and Technology Service Network Initiative of Chinese Academy of Sciences (KFJ-STS-ZDTP-036). We sincerely thank the editors of the journal and the reviewers for their useful comments and detailed suggestions for this manuscript.