

Soil erosion is a major environmental issue in terrestrial ecosystems (Foley et al. 2005; Grunwald et al. Reference Grunwald, Dellwig, Liebezeit, Schnetger, Reuter and Brumsack2007, Reference Grunwald, Dellwig, Kohlmeier, Kowalski, Beck, Badewien, Kotzur, Liebezeit and Brumsack2010). The Loess Plateau in China is in an important transition zone from semi-humid, semi-arid to arid, with the most severe soil erosion throughout China or worldwide (Pimentel & Kounang Reference Pimentel and Kounang1998). Soil erosion in this area causes high sediment concentration in the Yellow River. To mitigate soil erosion, the Chinese government has implemented a variety of soil and water conservation (SWC) measures, including modification of the land use structure, vegetation restoration, improvement of cultivation methods and construction of terraces on slopes and check dams in gullies. Since the 1990s, vegetation restoration and extensive afforestation as a result of the ‘Grain for Green' (GFG) Project have greatly increased the vegetation cover (Feng et al. Reference Feng, Fu, Piao, Wang, Ciais, Zeng, Lü, Zeng, Li, Jiang and Wu2016; Lu et al. Reference Lu, Zhao, Shi and Cao2016; Ouyang et al. Reference Ouyang, Zheng, Xiao, Polasky, Liu, Xu, Wang, Zhang, Xiao, Rao, Jiang, Lu, Wang, Yang, Gong, Wu, Zeng, Yang and Daily2016). This has helped to convert the land cover on the Loess Plateau from arable land, especially on slopes suffering from severe soil erosion, to grassland and forest. These restored areas have better SWC characteristics (Feng et al. Reference Feng, Wang, Chen, Fu and Bai2010; Fu et al. Reference Fu, Liu, Lü, He, Zeng and Wu2011), which have helped reduce sediment and run-off input into the downstream Yellow River (Fisher et al. Reference Fisher, Turner and Morling2009; Gao et al. Reference Gao, Li, Li, Jia, Xu, Ren, Pang and Zhao2015). Management of the Loess Plateau has been a high priority of the Department of Environment Management in recent years (Wischmeier & Smith Reference Wischmeier and Smith1978; Han et al. Reference Han, Tuo, Gao and Gao2010). As an ecological functional area, the loess hilly and gully region of the central Loess Plateau is critical to China's soil conservation plan because it is a barrier that prevents sediment from being transported to the middle and lower reaches of the Yellow River (Wischmeier & Smith Reference Wischmeier and Smith1978). Therefore, it is important to analyse the dynamics of soil erosion in the Ecological Barrier Belt (EBB) on the Loess Plateau and to determine the influence of the GFG Project on the sediment yield.
Many detailed studies of soil erosion on the Loess Plateau have been reported, mainly focusing on the coarse sand areas of the He-Long reach of the central Yellow River (Mu et al. Reference Mu, Chille, Zhang, Gao, Wang and Zhang2007; Yao et al. Reference Yao, Ran and Chen2013). Soil erosion is often estimated by employing soil erosion models that can be divided into physical and empirical models according to the adopted methodology (Li & Zheng Reference Li and Zheng2012). The Water Erosion Prediction Project (Laflen et al. Reference Laflen, Lane and Foster1991, Reference Laflen, Elliot, Flanagan, Meye and Nearing1997) requires numerous parameters, resulting in relatively limited use of this model. The Revised Universal Soil Loss Equation (RUSLE) uses factors closely related to soil erosion (e.g., rainfall, vegetation cover and topography). This model has been popular due to its simplicity and ease of use. Wischmeier & Smith (Reference Wischmeier and Smith1960) were the earliest to use the Universal Soil Loss Equation (USLE). The limitations of the USLE led to a revision by the US Department of Agriculture in 1993, resulting in the RUSLE (Renard et al. Reference Renard, Foster, Weesies and Porter1991). Prasannakumar et al. (Reference Prasannakumar, Vijith, Abinod and Geetha2012) combined the use of the RUSLE model with Geographic Information System (GIS) to assess soil erosion in the Siruvani basin of India. De Asis & Omasa (Reference de Asis and Omasa2007) integrated the RUSLE model with Linear Spectral Mixture Analysis to evaluate soil erosion in La Mesa Watershed, Philippines. Xia et al. (Reference Xia, Bu, Zhang, Yang, Yang and Jiang2007) applied the RUSLE model to evaluate soil erosion in the Miyun reservoir basin. Liu et al. (Reference Liu, Zhang and Xie2002) proposed the Chinese Soil Loss Equation on the basis of the USLE/RUSLE and investigated some empirical models for slope erosion. Jiang et al. (Reference Jiang, Zheng and Wu2005) investigated distinctive gullies and proposed erosion models. The RUSLE is one of the most widely used quantitative models for analysing soil loss (de Asis & Omasa Reference de Asis and Omasa2007; Prasannakumar et al. Reference Prasannakumar, Vijith, Abinod and Geetha2012; Xu et al. Reference Xu, Xu and Meng2013).
Soil conservation is one of the most important ecosystem services (Fu et al. Reference Fu, Liu, Lü, He, Zeng and Wu2011). Ecological service flow is a necessary link connecting service supply and demand (Costanza Reference Costanza2008; Fisher et al. Reference Fisher, Turner and Morling2009; Fu et al. Reference Fu, Li, Yu, Yang, Yu, Feng and Zhuang2010). Ecosystem services can play roles in a given location or in other areas, called the on-site effect or the off-site effect, respectively. Costanza (Reference Costanza2008) divided ecosystem services into several categories: in situ, directional flow, non-directional flow and globalisation. Fisher et al. (Reference Fisher, Turner and Morling2009) categorised the distribution and transfer of ecosystem services in the landscape as service providing area (SPA), service connection area (SCA) and service beneficial area (SBA). According to possible spatial relationships between SPA and SBA, the forms of ecosystem service provision were divided into in situ, omni-directional and directional (Fisher et al. Reference Fisher, Turner and Morling2009). Syrbe & Walz (Reference Syrbe and Walz2012) designed the flood regulating service in Saxony (Germany) based on flow. The service of soil conservation in ecosystem services typically has a regional effect (Wang et al. Reference Wang, Yin and Zhang2017).
We studied soil conservation and its regional effects on the Loess Plateau. Data from remote sensing (2000–2010) and the RUSLE were used to evaluate the change of land cover in the EBB on the Loess Plateau. The purposes of this study were to (1) characterise the spatial–temporal variations in land cover after the GFG Project, (2) determine the spatial–temporal variations in soil erosion after land cover improvement and (3) assess the regional effect of Loess Plateau ecosystems on downstream sediment concentration in the Yellow River. The aims were to provide a better scientific understanding in the hope of improving the ecological sustainability of the Loess Plateau.
1. Data sources and research methods
1.1. Overview of the study region
The study area is between 105°1′–112°21′ and 34°01′–38°13′, covering an area of 11.6×10⁴km2 and representing 19.5% of the Loess Plateau area. The region includes Shanxi, Shaanxi, Gansu and the Ningxia Hui Autonomous Region, including 60 associated districts and counties in the four provinces (Fig. 1). This region lies in the gullied areas of the middle reaches of the Yellow River, where rivers and ravines are common and the terrain is highly dissected. The elevation of this area ranges from 1200m to 1600m. The study area is within a semi-arid climatic transition zone where the mean annual temperature ranges from 4.3°C to 14.3°C and the annual precipitation is 400–776mm. Heavy rainfall between June and September accounts for 60–70% of the annual total. The major soil type is loess, which is loose and easily eroded. This region is in the forest-steppe zone, and the major plants are macrophanerophytes, such as Pinus tabulaeformis f. shekanensis, P. tabuliformis Carrière and Quercus liaotungensis; bushes, such as Hippophae rhamnoides Linn and Ostryopsis davidiana Decaisne; and perennial herbs, such as Artemisia argyi H. Lév. & Vaniot and A. sacrorum. Water is in short supply and the environment is fragile. Living conditions for people are extremely harsh. This area is very sensitive to climatic change and is an important SWC zone in the middle reaches of the Yellow River. The area is also a key region for the GFG Project.

Figure 1 Study area within the Ecological Barrier Belt on the Loess Plateau.
The sediment data were collected from the monitoring stations closest to the study area in Hua and Longmen counties. The station in Hua County receives water from the Wei and Jing Rivers, and soil erosion has mostly occurred in the hilly gullied areas of the Liupan Mountains on the Loess Plateau, where the Wei and Jing Rivers flow. However, since the land is flat on the central Shaanxi Plain, considerable sediment is redeposited, and soil erosion is limited. The Longmen monitoring station receives water mainly from the Kuye, Tuwei, Yan and Fen rivers. The Jin-Shaan Gorge area and the hilly gullied areas of the Baiyu Mountains have been severely eroded and thus represent an important source of sediment, especially silt, to the Yellow River. This region was the source of 56% of the sediments along the Yellow River (MWR 2001).
1.2. Data sources and pre-treatment
For this study, the main data were the monthly and annual average precipitation derived from 50 meteorological stations in the study area and surrounding areas on the Loess Plateau (2000–2010). These data were obtained from the National Meteorological Information Center, China Meteorological Administration (http://data.cma.cn/data/). Soil-type data at a scale of 1:1 million were obtained from the soil and terrain primary database of China, provided by the Soil Sub-Center of the Institute of Soil Science (http://www.soil.csdb.cn), Chinese Academy of Sciences (CAS). These data were used to calculate the soil erodibility factor (K), which expresses soil resistance to erosion. Topographic data were derived from the Shuttle Radar Topography Mission-Digital Elevation Database at 30m resolution, provided by Scientific Data Center within the CAS Computer Network Information Center (http://landsat.datamirror.csdb.cn). These data were used to extract slope length (L) and slope steepness (S). The remote sensing image data from 2000 to 2010 were from the Moderate Resolution Imaging Spectroradiometer monthly maximum synthesis product at 250m spatial resolution. The data were corrected, including geometric rectification, radiation correction and atmospheric correction to obtain the vegetation cover-management factor (C). The land cover data, at a resolution of 30m, were from remote sensing images captured in 2000, 2005 and 2010. These data were included in the Assessment Project for Decade-change of the National Ecological Environment (2000–2010) by the Research Center for Eco-Environmental Sciences, CAS (http://wps1.gscloud.cn/index.shtml). The data were projected onto an Albers projection system using the ellipsoid of Krasovsky 1940 as the model of the Earth.
1.3. Research methods
1.3.1. RUSLE method
The RUSLE is an empirical model for predicting average annual soil loss. The equation used to calculate soil erosion amount is as follows (Wischmeier & Smith Reference Wischmeier and Smith1965; Renard et al. Reference Renard, Foster, Weesies and Porter1991):
 $$A_r = R \times K \times LS \times C \times P$$
 $$A_C = R \times K \times LS \times (1 - C \times P)$$
where Ar is the predicted soil erosion amount (tha–1yr–1); Ac is the soil conservation amount (tha–1yr–1); R is the rainfall erosivity (MJ·mmha–1h–1yr–1); K is the soil erodibility factor (thahMJ–1ha–1mm–1); L and S are dimensionless slope length and steepness parameters, respectively; C is the dimensionless vegetation cover-management factor; and P is the dimensionless soil conservation practice factor.
1.3.2. Determination of RUSLE factors
(1) Rainfall erosivity (R) is assessed using the following empirical equation based on monthly precipitation proposed by Wischmeier & Smith (Reference Wischmeier and Smith1978), which has been validated for application on the Loess Plateau (Fu et al. Reference Fu, Liu, Lü, He, Zeng and Wu2011):
 $$R = \sum^{12}_{i=1} 1.735 \times 10^{(1.5\lg (p^2_i / p) - 0.08188)}$$
where R is the rainfall erosivity (MJmmha–1h–1yr–1); p is the annual precipitation (mm); pi is monthly precipitation; and i refers to the specific month.
(2) Soil erodibility (K). Since it was difficult to establish natural plots in the study basin, the soil erodibility factor K was estimated using the calculation method included in the EPIC (Erosion-Productivity Impact Calculator) model (Williams et al. Reference Williams, Dyke and Jones1983). The K factor was calculated based on different soils and organic matter contents:
 $$\eqalign{K = \left\{0.2 + 0.3 \exp \left[ - 0.0256 {\rm SAN} \left ( 1 - {{\rm SIL} \over 100} \right)\right ]\right \} \vskip9 \cr \times \left( { {\rm SIL} \over { \rm CLA} + {\rm SIL} }\right )^{0.3} \vskip12 \cr \times \left [ 1 - { 0.25C \over C + \exp \eft (3.72 - 2.95C \right )} \right ]\vskip15 \cr \times \left [ 1- { 0.7{\rm SNI} \over {\rm SNI} + \exp ( -5.51 + 22.9 {\rm SNI} } \right ] \times 0.1313}$$
where SAN, SIL and CLA are the percentages (%) of sand, silt and clay, respectively, and SNIC is the organic carbon content of the soil (%).
(3) Slope length and steepness (LS). In this study, the RUSLE_PC.AML model, developed by Van Remortel et al. (Reference Van Remortel, Maichle and Hickey2004) to compute the LS factor, was used to determine the LS scores. The equation (Liu et al. Reference Liu, Zhang and Xie2002) for calculating the slope steepness factor is as follows:
 $$s= \cases {10.8 \sin \theta + 0.03 $\theta \lt 5^\circ$ \vskip6 \cr 16.8 \sin \theta - 0.50 $5^\circ \le \theta \lt 10^\circ$\vskip6 \cr 21.9 \sin \theta - 0.96 $\theta \ge 10^\circ$ $$
where θ is the steepness value in degrees.
(4) The cover-management factor (C) is dimensionless and ranges from 0 to 1. The C value increases with erosion severity. There are three major approaches for the determination of C: value assignment, field plot experiments and a quantitative remote sensing method based on vegetation cover. In this study, the value of factor C was taken from Cai & Ding (Reference Cai and Ding2000) and the equation is as follows:
 $$C = \cases{1 {\it f} = 0\vskip6 \cr 0.6508-0.3436 \lg\ f 0 \lt {\it f} \le \,78.3%\vskip6 \cr 0 {\it f} \gt 78.3%}$$
where f represents the vegetation cover calculated from the Normalised Difference Vegetation Index (NDVI).
(5) Conservation practice factors (P). The major conservation practice factors (P) on the Loess Plateau are check dams and terraces, but the results of these conservation measures are difficult to quantify (Fu et al. Reference Fu, Liu, Lü, He, Zeng and Wu2011) due to the resolution of the remote sensing data. Thus, the variance of P is not considered, and its value is set to 1.
1.3.3. Statistical methods
According to the ecosystem service flow concept (Li Reference Li2014), ecosystem services not only benefit the local region itself but also influence other areas in some way (Han et al. Reference Han, Tuo, Gao and Gao2010), which is called the regional effect of ecosystem services in our study. We assembled river sediment data for 2000–2010 from 17 hydrological stations in the downstream stretch of the Yellow River. We analysed the relationships between the sediment data and soil erosion on the Loess Plateau, and the partial correlation coefficient was considered to express the intensity of the regional effect of soil conservation.
2. Results
2.1. Land cover change in the Loess Plateau
2.1.1. Land-use change
From 2000 to 2010, the land types in the EBB on the Loess Plateau transformed significantly. The areas of grassland and forest increased greatly, increasing from 23.56% and 40.69% in 2000 to 26.46% and 41.16% in 2010, respectively, representing increases in area of 334,219ha and 89,698ha, respectively (Table 1). Farmland decreased from 3,993,427ha in 2000 to 3,557,534ha in 2010, representing a decrease of 3.73% (34.21% in 2000 to 30.48% in 2010). The EBB on the Loess Plateau is the key region under the GFG Project, which primarily consists of three different pathways: farmland to grassland, farmland to forest and grassland to forest. From 2000 to 2010, the area in which the GFG Project was implemented was 423,806.77ha, accounting for 3.63% of the total area. The area transitioning from farmland to grassland was 328,701.21ha, that from farmland to forest was 21,122.13ha and that from grassland to forest was 73,930.54ha, representing 2.82%, 0.18% and 0.63% of the study area, respectively.
Table 1 Land use change in the Ecological Barrier Belt on the Loess Plateau.

2.1.2. Vegetation cover change
From 2000 to 2010, vegetation cover in the EBB on the Loess Plateau increased from 55% to 69% at a rate of 1.25% per year, with an R 2 value of 0.8547. Based on the Equal Interval method in ArcGIS software, the vegetation cover was divided into low cover (0–20%), mid–low cover (20–40%), mid-cover (40–60%), mid–high cover (60–80%) and high cover (80–100%) (Fig. 2). Between 2000 and 2010, the mid–low vegetation cover area under the GFG Project decreased significantly, while the percentage of low cover and mid–low cover areas declined from 1.0% and 28.79% to 0.1% and 1.8%, respectively. While the percentage of mid-cover area remained unchanged, the mid–high and high cover areas increased from 17.74% and 19.67% to 36.60% and 28.52%, respectively. In general, the vegetation conditions in the study area improved (Fig. 2).

Figure 2 Changes of vegetation cover between 2000 and 2010.
In the EBB on the Loess Plateau (2000–2010), the area with no significant vegetation change was 6,258,513 ha, accounting for 53.67% of the total area. However, the area with obvious changes was 5,401,863 ha, accounting for 46.33%. Additionally, an area of 3,455,106ha (29.63% of total area) experienced very significant vegetation cover change. According to the direction of change, the obvious vegetation cover changes were divided into obvious increases and obvious decreases, and the very significant change was divided into very significant increases and very significant decreases. Based on the statistical analysis of the data from the EBB on the Loess Plateau, (1) the area in which vegetation obviously increased was 5,215,450 ha, accounting for 44.73%, with 3,392,581ha of this area exhibiting very significant increases, and (2) the area in which vegetation obviously decreased was 186,412.5ha, accounting for 1.60%, with 62,525ha of this area exhibiting very significant decreases (Table 2 and Fig. 3).
Table 2 Rate of changes of vegetation cover between 2000 and 2010.


Figure 3 Trends of vegetation cover change from 2000 to 2010.
2.2. Soil erosion on the Loess Plateau
2.2.1. Development of soil erosion
Between 2000 and 2010, soil erosion decreased by 69.8%, from 6579.55tkm–2yr–1 in 2000 to 1986.66tkm–2yr–1 in 2010. Unexpectedly, soil erosion increased sharply in 2003 due to precipitation (Fig. 4).

Figure 4 Change of soil erosion intensity in the Ecological Barrier Belt on the Loess Plateau from 2000 to 2010.
Rainfall and vegetation are the two main factors that influence soil erosion (Costanza Reference Costanza2008; Fu et al. Reference Fu, Li, Yang, Wu and Zhang2015). The GFG Project has been widely adopted in the Loess Plateau and has improved the vegetation cover. Between 2000 and 2010, the annual precipitation in the Loess Plateau increased from 455.41mm in 2000 to 573.1mm in 2010. Increased precipitation enhanced rainfall erosivity, but soil erosion declined due to better vegetation cover, indicating the effectiveness of vegetation restoration in water and soil conservation. However, when precipitation increased, soil erosion remained severe. In 2003, the precipitation was 704.14mm (i.e., 182mm more than the average precipitation in this area) and the amount of soil loss was 5633.82tkm–2yr–1. Based on the correlation analysis, an increase in vegetation cover was effective at reducing soil loss by 84%, while the soil erosion induced by precipitation was only 21.8%.
The Standard for Classification and Gradation of Soil Erosion SL190–2007 (Syrbe & Walz Reference Syrbe and Walz2012) divides soil erosion intensities into six categories: slight, light, moderate, strong, extremely strong and severe. The areas corresponding to each erosion category are shown in Table 3. The percentage area of slight erosion in the EBB on the Loess Plateau was 72.54%, followed by the areas of light (6.62%), moderate (8.77%), strong (5.08%) and extremely strong (4.64%) erosion. A relatively small area (2.35% of the total) was severely eroded.
The soil erosion conditions in 2010 were significantly better than those in 2000. The percentages of slight and light erosion areas increased by 43.43% and 4.65%, respectively, and the percentage areas of moderate, strong, extremely strong and severe erosion decreased by 13.08, 35.22, 57.18 and 83.65%, respectively. Among these, the percentage area of severe erosion decreased.
Table 3 Percentage of change between 2000 and 2010 in areas with different soil erosion intensity.

2.2.2. Spatial evolution of soil erosion
Between 2000 and 2010, the soil erosion distribution in the EBB on the Loess Plateau remained nearly unchanged. The areas of moderate or stronger erosion were mainly in the gullied regions of Shaanxi, eastern Gansu, southern Ningxia and Shanxi provinces within the Loess Plateau, where the human population is relatively dense. The slight and light erosion areas were primarily in regions with hills and gentle slopes, such as near the Liupanshan, Ziwuling, Huanglong and Lv-liang Mountains, which were covered with relatively high vegetation coverage.
Statistical analysis of the areas with different erosion grades generated a transition matrix showing changes in erosion intensity each year. Table 4 shows that between 2000 and 2005 the proportion of areas that transformed from severe, extremely strong, strong, moderate and light erosion to slight erosion were 32.33, 40.45, 47.01, 54.21 and 60.84%, respectively. Also, a relatively large proportion of highly eroded areas were converted to moderate erosion: the percentages of areas changing from severe, extremely strong and strong erosion to moderate erosion were 19.1, 19.12 and 17.52%, respectively. However, some areas with previously low erosion grades transformed into the next stronger erosion grades, demonstrating that additional progress was needed to control water and soil losses in the EBB on the Loess Plateau.
Table 4 Matrices showing the conversion of soil erosion intensity in the Ecological Barrier Belt on the Loess Plateau between 2000 and 2010.

Between 2005 and 2010, there were obvious changes in the moderate, light and slight soil erosion grades. In detail, 47.31 and 29.14% of the light and moderate erosion areas, respectively, converted to slight erosion; 27.54% of the strong erosion area changed to moderate erosion; 22.81% of the extremely strong erosion area converted to strong erosion; and 31.9% of the severe erosion area changed to extremely strong erosion. In general, soil erosion changed from being severe to slight, and the erosion grade gradually decreased.
2.3. Soil erosion on different vegetation gradients
Statistical analysis of soil erosion intensities in areas with different vegetation covers demonstrated that the lightly eroded area gradually expanded while the intensities of other areas decreased (Fig. 5). Severely eroded areas with low, mid–low, medium and mid–high coverage decreased from 7793ha, 200,153ha, 59,420ha and 706ha in 2000 to 319ha, 9863ha, 33,547ha and 1ha in 2010, respectively; moreover, there was no severe soil erosion in areas with a high vegetation cover. For areas with low, mid–low, medium, mid–high and high vegetation cover, the slightly eroded areas were 2152ha, 61,188ha, 240,224ha, 298,917ha and 338,442ha, respectively, in 2000, and 350ha, 5737ha, 200,974ha, 613,844ha and 530,662ha, respectively, in 2010. After a ten-year restoration period, the area of low vegetation coverage with severe erosion decreased considerably, whereas the area of high vegetation coverage with slight erosion increased considerably.

Figure 5 Soil erosion intensities in areas with different vegetation covers between 2000 and 2010. Abbreviations: HCV = high vegetation coverage; MHCV = medium-high vegetation coverage; MCV = medium vegetation coverage; MLCV = medium-low vegetation coverage; LCV low vegetation coverage.
2.4. Soil erosion in areas within the GFG Project
Statistical analysis of changes in areas with varying soil erosion intensities within the GFG Project indicated that between 2000 and 2010 soil erosion tended to decrease. In grassland restored from farmland, the areas of severe, extremely strong and strong soil erosion decreased at rates of 1213.82hayr–1, 539.00hayr–1 and 175.18hayr–1, respectively, whereas the areas of slight, light and moderate erosion expanded at rates of 50.55hayr–1, 185.27hayr–1 and 1702hayr–1, respectively. Areas of different erosion intensities in forests restored from either farmland or grassland showed trends similar to those in the grassland restored from farmland. With the exception of the increase in the slightly eroded area, areas with other erosion intensities all decreased (Table 5).
Table 5 Areas of different erosion intensities in the forests and grassland restored from farmland (ha).

2.5. Correlations between soil conservation on the Loess Plateau and sediment at hydrological stations
Although the trends in soil erosion along the Wei River and Jin-Shaan Gorge area were similar, the intensity of soil erosion in the Jin-Shaan Gorge area along the Yellow River was much greater than that in the Jing River–Wei River area. In 2000, the sediment concentrations at the Hua County and Longmen recording sites were 41.9kgm–3 and 13.9kgm–3, respectively. By 2003, the sediment concentrations at the Hua County and Longmen recording sites increased to 89.6kgm–3 and 21.4kgm–3, respectively, due to increased precipitation. Between 2000 and 2010, due to declining soil erosion, the sediment concentrations at the Hua County and Longmen sites decreased by 41.5 and 73%, respectively. During this period, the changes in sediment run-off were similar to the changes in sediment concentrations at these two sites: the sediment run-off at the Hua County and Longmen sites decreased by 70.1 and 64.47%, respectively. The soil erosion intensity in a sub-catchment was positively correlated with the sediment concentrations and run-off amounts at stations within the same sub-catchment using Pearson's product-moment coefficients between soil erosion and sediment concentrations or sediment run-off amounts at the related observation stations. Pearson's correlation coefficients between soil erosion and sediment concentration at sites in the Jing River–Wei River area and gullied areas of the Jin-Shaanxi Gorge were 0.34 and 0.60, respectively, while Pearson's coefficient between soil erosion and sediment run-off in the Jing River–Wei River areas and gullied areas in Jin-Shaanxi Gorge were 0.51 and 0.58, respectively (Fig. 6).

Figure 6 Comparison between soil erosion and sediment concentrations (left) and comparison between soil erosion and runoff amount (right) in sub-basin areas.
2.6. Regional effect of soil conservation on the Loess Plateau
Except for Huaxian, the sediment concentrations at other hydrological stations exhibited a slow decline. The sediment concentration in the upper reach of the Yellow River is markedly higher than that in the lower reach. The sediment concentration at the Huaxian hydrological station was the largest, e.g., 41.9kgm–3 in 2000 and 89.6kgm–3 in 2003. From 2000 to 2010, the sediment concentration at the Huaxian station declined by 17.4kgm–3 (i.e., 41.5%), as shown in Figures 7 and 8. Soil conservation on the Loess Plateau and sediment concentrations at the hydrological stations showed a negative correlation, and the correlation coefficients decreased with increasing distance (from upstream to downstream) (Fig. 9).

Figure 7 Sediment concentrations at some monitor stations of the Yellow River (2000–2010).

Figure 8 Person correlation of soil erosion in the Ecological Barrier Belt on the Loess Plateau and sediment concentrations at monitor stations.
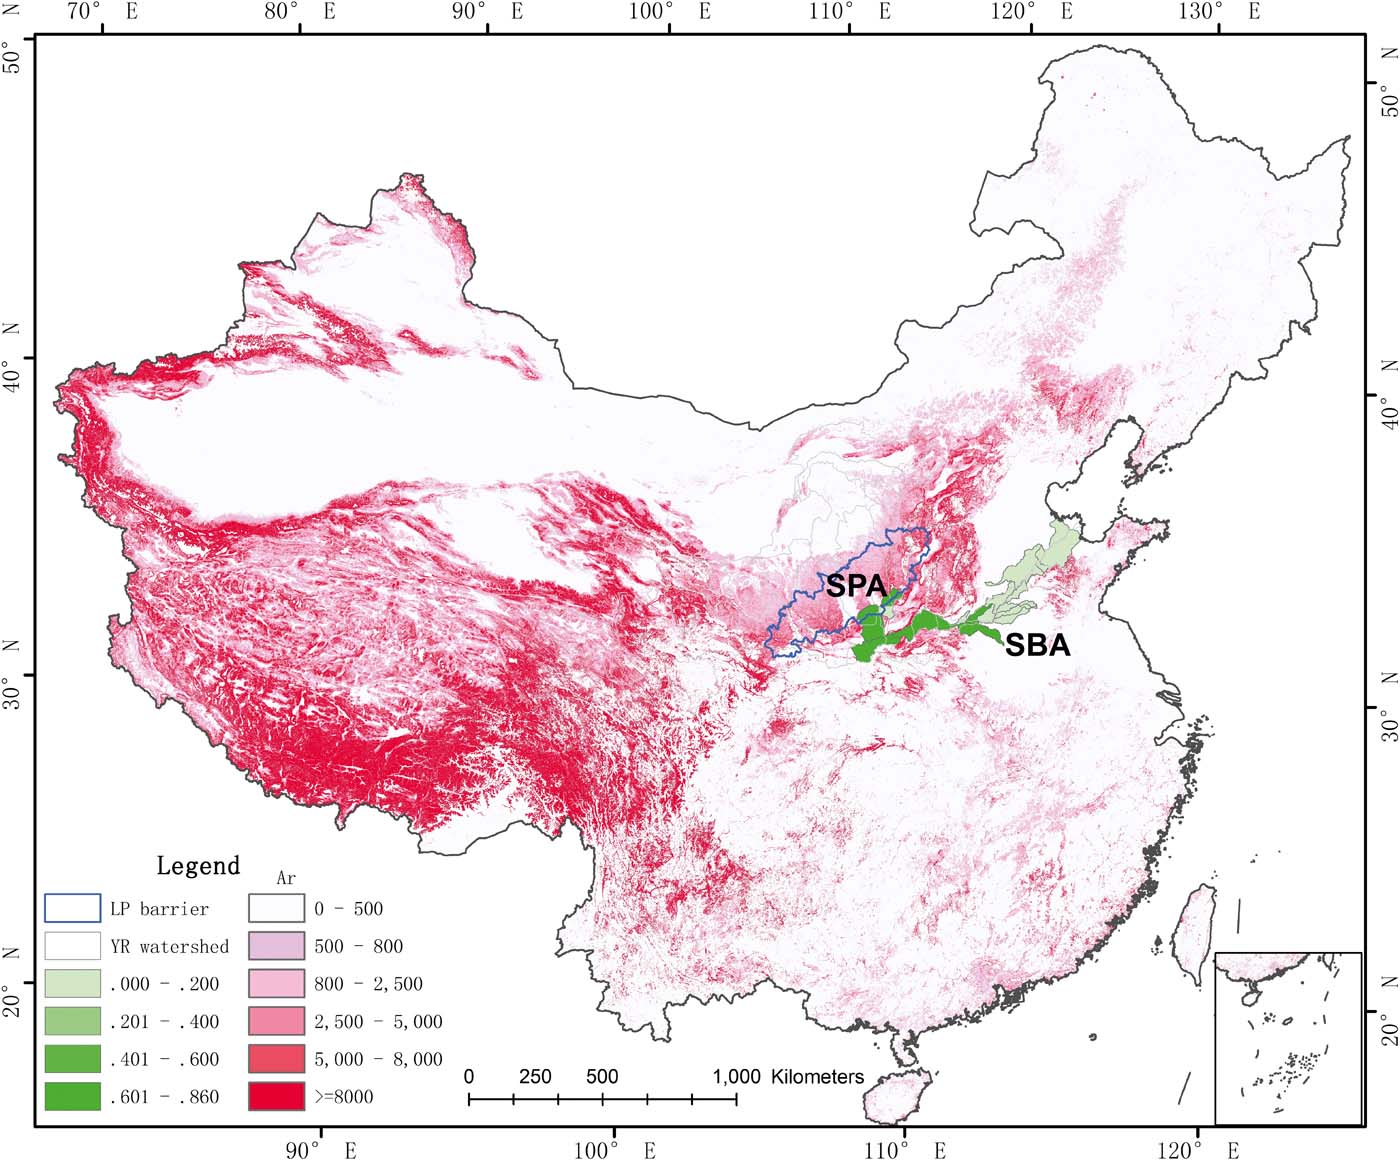
Figure 9 Scope of soil conservation service influence in the Ecological Barrier Belt on the Loess Plateau.
3. Discussion
The RUSLE model was used to investigate soil erosion in a typical soil conservation region on the Loess Plateau between 2000 and 2010. Spatial characteristics of soil erosion in the EBB on the Loess Plateau were quantitatively evaluated after the implementation of the GFG Project. The results yielded the following conclusions: (1) Precipitation showed an increasing trend, and rainfall erosivity increased, but due to improved vegetation cover, soil loss in the EBB on the Loess Plateau declined by 69.8% from 6579.55tkm–2yr–1 in 2000 to 1986.66tkm–2yr–1 in 2010. The area of low vegetation coverage with severe erosion decreased, while the area of high vegetation coverage with slight erosion increased. These results illustrate the importance of vegetation restoration in managing soil and water loss. (2) Soil conservation has improved significantly. The area of slight erosion increased by 43.43%, whereas the areas of moderate, strong, extremely strong and severe erosion decreased, with the severe erosion area decreasing the most (83.65%). In the study area, soil erosion transitioned from severe to slight, indicating a gradual lowering of the erosion intensity. (3) The study focused on the restoration of farmland to grassland, which occurred in a region covering 328,701.21ha and representing 2.82% of the total area. Soil erosion changes were evident in the grassland restored from farmland, as the areas of severe, extremely strong and strong erosion decreased at rates of 1213.82hayr–1, 539.00hayr–1 and 175.18hayr–1, respectively. In contrast, the areas of moderate, light and slight erosion all expanded. From the discharge data, the soil erosion intensity in the gullied areas in the Yellow River basin was greater than that in the Jing River–Wei River area, and the coefficients between soil erosion and sediment run-off and between soil erosion and sediment concentration in the Jin-Shaan Gorge area were both larger than those in the Jing River–Wei River area.
In the RUSLE model, the L and S factors were constant; however, the topographic factor varied slightly and was hard to determine using remote sensing data. Consequently, this factor could be a source of error in the results. Additionally, factor C is an important indicator for evaluating the resistance of vegetation to soil erosion. One method for evaluating this factor on a large scale is to use remote sensing imagery to obtain a map of the distribution of regional land cover types. Corresponding values are then assigned to factor C under different land cover types based on empirical values reported in other articles or measurement data provided by other studies. This method is practical and relatively easy to apply, and so is a preferred approach for assessing C when evaluating regional soil erosion. However, by assigning a specific C value to each land cover type, the spatial change characteristics of topographic vegetation are ignored. There is a clear correlation between vegetation indices and vegetation cover, and the vegetation cover based on the NDVI calculation is widely used. The vertical structure of the vegetation is also an important factor that influences soil erosion, a topic needing further research.
4. Acknowledgements
This research was supported by The National Key Research and Development Plan (2016YFC0501603 & 2018YFC0507300); Science and Technology Service Network Plan of Chinese Academy of Sciences (KFJ-STS-ZDTP-036); and Natural Science Foundation of Shaanxi Province (2018JM4016).


