A nature reserve is a protected area for conserving endemic species or special ecosystems, and is designed to protect relationships between endemic species and their natural habitat (Liu et al. Reference Liu, Linderman, Ouyang, An, Yang and Zhang2001). The Pangquangou National Nature Reserve (PNNR) was established in 1986 to protect the endemic and endangered brown-eared pheasant (Crossoptlon mantchuricum) and its high-quality habitat: Prince Rupprecht's larch (Larix principis-rupprechtii) forest (Zhang et al. Reference Zhang, Ru and Li2006a, Reference Zhang, Xi and Lib, Reference Zhang, Xu and Lic; Zhang & Yang Reference Zhang and Yang2008). Owing to the wide distribution of Prince Rupprecht's larch, the PNNR is well known as ‘the distribution centre of Prince Rupprecht's larch' in China. Prince Rupprecht's larch forest plays significant roles in the PNNR, such as conservation of soil and water, and carbon fixation (Zhang et al. Reference Zhang, Zhang, Suriguga Zhang and Cheng2010). In addition, the community variation within Prince Rupprecht's larch forest provides more ecosystem diversity and habitat heterogeneity for animals and, thus, increases species diversity, especially for forest interior and resident birds (Tews et al. Reference Tews, Brose, Grimm, Tielbörger, Wichmann, Schwager and Jeltsch2004). Yang & Li (Reference Yang and Li1995) reported that bird species diversity in the PNNR has increased by 30.1% since its establishment. Moreover, habitat use by animals changes with seasons (Wilson et al. Reference Wilson, Thompson and Hammond1997; Li et al. Reference Li, Yue, Lian, Zhao, Zhao and Xiao2012), and, therefore, habitat heterogeneity is commonly proposed to explain the increase in population density (Gorini et al. Reference Gorini, Linnell, May, Panzacchi, Boitani, Odden and Nilsen2012; Krüger et al. Reference Krüger, Chakarov, Nielsen, Looft, Grünkorn, Struwe–Juhl and Møller2012). In the PNNR, brown-eared pheasants prefer mixed conifer and broadleaved forests with abundant shrubs as habitat in the autumn, utilising the plentiful fruit of species such as Ribes burejense, Rosa bella and Crataegus wilsonii. However, in the winter they prefer coniferous forests with low canopy density and abundant sunlight (Liu et al. Reference Liu, Su, Sheng and Wang1991).
Studies on soil seed reserves under the canopy (Guo et al. Reference Guo, Xue, Li and Wang1998), distribution patterns (Liu et al. Reference Liu, Han, Cheng and Li2007) and simulation of population dynamics (Zhang et al. Reference Zhang, Zhang, Suriguga Zhang and Cheng2010) have been carried out within the nature reserve for both sustainable development of Prince Rupprecht's larch forest and conservation of suitable habitats for animals. However, no studies have determined the community variation associated with the major environmental variables in the area. Both stochastic and deterministic processes have been proposed to explain community structure and assembly. In some cases, modelling of stochastic processes has successfully predicted species abundance (Chave Reference Chave2004), suggesting that species dissimilarity is not needed to generate the observed patterns of diversity in nature. However, Adler et al. (Reference Adler, Ellner and Levine2010) suggest that species coexistence within communities cannot be understood without considering deterministic processes. On the one hand, deterministic processes impose ecological filters that select individual species from a regional pool because they possess specific traits suitable for a given habitat (Keddy Reference Keddy1992). On the other hand, deterministic processes also enhance the complementarity of species coexistence by niche differentiation (Maire et al. Reference Maire, Gross, Börger, Proulx, Wirth, Pontes, Soussana and Louault2012). As plant abundances determine how species respond to environmental gradients and also how they affect local resources, it has been proposed that a species' position within an ordination space can represent its niche (Sabo & Whittaker Reference Sabo and Whittaker1979). Therefore, gradient analysis can be used to explore community variation and test the relationships between communities and the environment (Zhang et al. Reference Zhang, Xu and Li2013). In this study, we analysed community variation within Prince Rupprecht's larch forest and the relationships with environmental variables by gradient analysis. The specific objectives were to (1) determine the community variation in Prince Rupprecht's larch forest of the PNNR and (2) assess the relative importance of the measured environmental variables on community variation.
1. Study area and methods
1.1. Study area
The PNNR [37°45′–37°55′ N, 111°22′–111°33′ E] is in the middle of the Lüliang Mountains in west Shanxi Province, and at the eastern margin of the Loess Plateau (Fig. 1). The climate of this area is temperate and semi-humid with continental characteristics, and is controlled by seasonal winds. The annual mean temperature is 3–4°C and the annual mean precipitation is 830.8mm, 70% of which falls from July to September. The growing season lasts about 105 days. Soil types range from mountain brown soils, mountain alfisols to mountain cinnamon soil along with the decrease in elevation. The PNNR has a total area of >10,000ha and its elevation varies from 1600 to 2670m. Based on the national vegetation system, the zonal vegetation in the PNNR is a warm temperate deciduous broad-leaved forest. The vegetation zones change from deciduous broadleaved forest, needle–broad-leaved mixed forest, cold–temperate coniferous forest to sub-alpine scrub-meadow along with increasing elevation. The dominant zone is the cold-temperate coniferous forest, which consists mainly of Prince Rupprecht's larch (Zhang & Yang Reference Zhang and Yang2008).
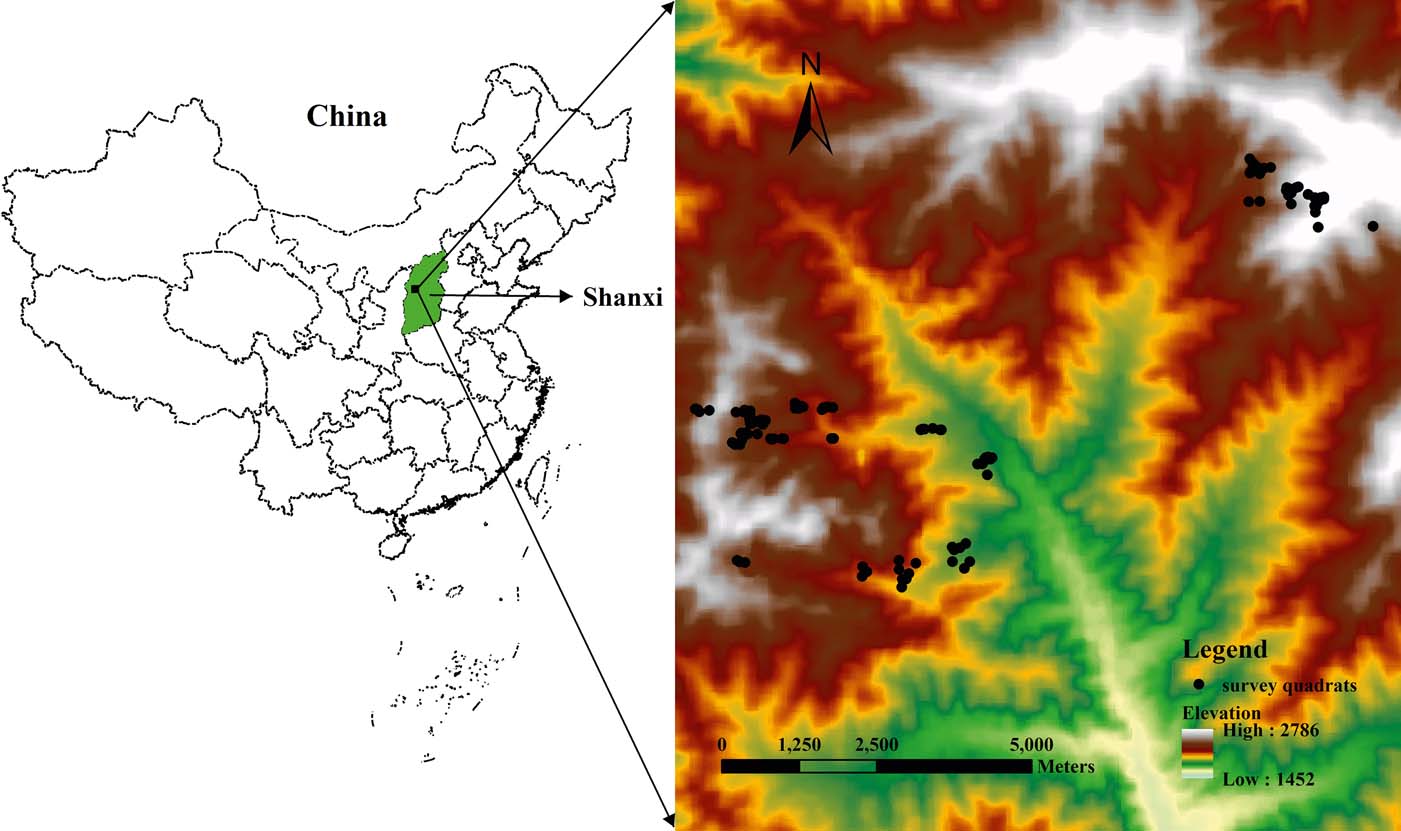
Figure 1 Location of the study area. Points show distribution of 120 survey quadrats in Pangquangou National Nature Reserve based on a digital elevation model provided by International Scientific & Technical Data Mirror Site, Computer Network Information Center, Chinese Academy of Sciences (http://www.gscloud.cn).
1.2. Data collection
One hundred and twenty quadrats (each 10×10m, Fig. 1) were selected in different areas in July and August 2010. In each quadrat, species-related data were recorded from two 5×5m sub-quadrats for shrubs and from four 1×1m sub-quadrats for herbs. For individual trees, we measured height (by a height meter), diameter at breast height (DBH, by a caliper) and number. For shrubs, we estimated herbage cover (estimated by the naked eye), height (by a ruler) and abundance. Altogether 169 plant species were recorded in 120 quadrats. Sixty-four species were excluded to eliminate the influences of rare species, and, then, 105 frequently occurring species were chosen for the subsequent analysis.
We also recorded elevation (by GPS), slope and aspect (by compass), slope position (by eye), litter thickness (by a ruler) and soil depth using an iron probe in each quadrat. Slope aspect (clockwise from south), which is a circular variable, was expressed as cos (aspect) (Suriguga et al. Reference Suriguga Zhang, Zhang, Cheng, Zhang, Tian and Liu2011); a greater value indicates a sunnier and drier condition. All hillslopes were divided into three positions from top to bottom, and the upper, middle and bottom positions were recorded as 1, 2 and 3 respectively.
The importance value (IV) of each species was used in multivariate analysis of communities and calculated as follows (Zhang et al. Reference Zhang, Ru and Li2006a, Reference Zhang, Xi and Lib, Reference Zhang, Xu and Lic):
 $$IV_{tree} = {relative\ density + relative \ dominance + relative \ height \over 3}$$
 $$IV_{shrubs\ and\ herbs} = {relative\ coverage + relative \ height \over 2}$$
Relative density is the ratio of the density of a tree species to the density of the total tree species, relative dominance means the ratio of the basal area of a species to the sum of the basal area of all trees, relative height refers to the ratio of average height of a species to the sum of the average height of all species in the same layer, and relative coverage means the coverage ratio of a species to all species in the same layer. The species-related data were the IVs of 105 species in the 120 quadrats. The environmental data were the six variables, elevation, slope, aspect, position, litter thickness and soil depth.
1.3. Analytical methods
A multivariate regression tree (MRT) was constructed to identify community variation related with the environmental variables (elevation, slope, aspect, position, litter thickness and soil depth). The MRT is based on the same principles as Classification and Regression Trees (CART) but extended to more than one response variable (De'ath Reference De'ath2002). It can be used to explore, describe and predict relationships between multispecies data and environmental characteristics. We used MRT to determine clusters of sites by repeatedly splitting the data with each split defined by an environmental variable. The splits were chosen to minimise the dissimilarity of quadrats within clusters, and, hence, each cluster represents a community, whereas its environmental values define its associated habitat. The software package ‘mvpart' package v1.6–2 of software R was used for the MRT analyses (R Core Development Team 2012).
To determine whether a linear or a unimodal model was best, detrended correspondence analysis (DCA) (Hill & Gauch Reference Hill and Gauch1980) was applied in advance to calculate the length of the first axis, which measures the total heterogeneity in the vegetation data. The first axis in Hill's scaling was 2.386, which indicated that the redundancy analysis (RDA) should perform reasonably well (Šmilauer & Lepš Reference Šmilauer and Lepš2014). Given that multicollinearity among explanatory variables can hamper the identification of the most important variables, we performed the RDA with forward stepwise selection with the six explanatory variables (P<0.05) to select the significant predictors that accounted for most of the variation in community patterns. Then, the significant variables were further analysed by a partitioning approach to determine the relative influences on community variation (Borcard et al. Reference Borcard, Legendre and Drapeau1992). The variation was decomposed using (partial) regression analyses with RDA (Liu Reference Liu1997). All of the RDAs were tested for significance with a Monte Carlo Permutation (MCP) test 1000 times. The DCA, RDA and partial RDA were all performed in CANOCO 5.0 (Šmilauer & Lepš Reference Šmilauer and Lepš2014; Braak & Šmilauer Reference Braak and Šmilauer2015).
2. Results
2.1. Community variation
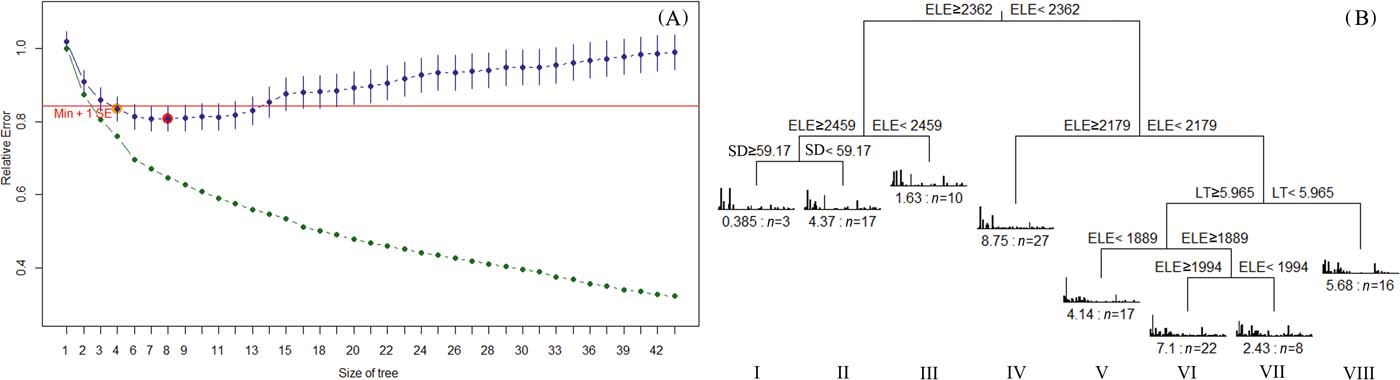
In the MRT analysis, the size of the tree was selected by cross-validation, with an eight-leaf tree clearly identified as having the minimum estimated predictive error (Fig. 2A). The clusters represent eight forest types with the splits based only on elevation, litter thickness and soil depth (Fig. 2B). The tree explained 24.1% of the species variance. Briefly, the main characteristics of the eight forest types and their major composition species are displayed in Table 1. The eight forest types represented four vegetation succession stages: Larix principis-rupprechtii+Populus maximowiczii mixed forest (VII), Larix principis-rupprechtii+Betula platyphylla mixed forest (VIII), Larix principis-rupprechtii pure forests (I, II, IV, V and VI) and Larix principis-rupprechtii+Picea wilsonii mixed forest (III). This was related to the length of succession time and the change in dominant species, representing a striking dissimilarity in the dominant species in the tree layer. Pure forests could be divided into different community types and they were mainly different in dominant species in the shrub layer.

Figure 2 Multivariate regression tree (MRT) relating environmental variables to multispecies data. (A) Selection of MRT; (B) MRT of eight leaves predicted using elevation (ELE), litter thickness (LT) and soil depth (SD). The relative error (green points) decreases with tree size, whereas the cross-validated relative error (blue points) decreases to a minimum for a tree size of eight (big red point), and then increases. The red line indicates one standard error above the minimum cross-validated relative error and suggests a tree size of eight leaves.
Table 1 The description of the main characteristics of eight communities of Prince Rupprecht's larch forest in PNNR, China.

2.2. Relationships between community variation and environmental variables
The 120 quadrats and six environmental variables were analysed by RDA ordination (Fig. 3). The MCP indicated that the eigenvalues for all canonical axes were significant (P<0.001). The eigenvalues of the first four RDA axes were 0.134, 0.045, 0.010 and 0.008 respectively; the species–environment correlations coefficients were 0.915, 0.560, 0.465 and 0.535 respectively; the amount of variation captured by all the explanatory variables was 20.6%, and the cumulative percentage variance of the species–environment relation was 95.8%. These results indicated that the RDA performed well in describing the relationships among species, communities and environmental gradients.
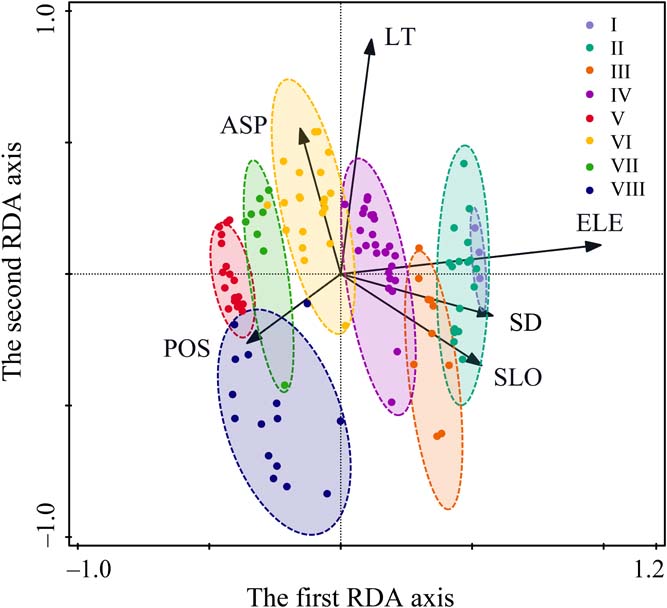
Figure 3 RDA ordination biplot of 120 quadrats and six environmental variables of Prince Rupprecht's larch forest in PNNR. The arrows refer to environmental variables, and the ellipses refer to the eight communities. Abbreviations: ASP = aspect; ELE = elevation; LT = litter thickness; POS = position; SD = soil depth; SLO = slope.
The first RDA axis was significantly related to all environmental variables except litter thickness (Fig. 3; Table 2). This axis was positively correlated with elevation and topographical position and negatively correlated with soil depth, slope and aspect. The second RDA axis was significantly correlated with aspect, litter thickness and position. The third RDA axis was correlated with soil depth, slope and position, and the fourth axis was correlated only slope and position.
Table 2 Correlations between environmental variables and the first four RDA axis.
*P<0.05; **P<0.01; ***P<0.001.
The distribution of plant communities on the ordination map is related to the environmental gradient (Fig. 3). Each community had its own distribution and specific species composition. The variation in communities on the ordination diagram showed a clear shift of communities along the first axis as elevation increased from left to right. Community V is at lower elevations (1800–1900m) in the PNNR, while Community I occurs at the timberline (2550–2600m). Besides the obvious altitudinal pattern, it was also found that the distribution was also related to other environmental factors, such as Community VI in sunny slopes with thick litter, Community VIII in lower slopes and Community II in steep slopes with thick soil.
Since some environmental variables may be significantly correlated with each other, forward selection was used to build a simpler model with fewer explanatory variables. The results are shown in Table 3. Regarding the marginal (independent) effects, elevation was the major factor for species composition, followed by slope, soil depth, aspect, position and litter thickness (Table 3). In summary, the independent effects of all environmental variables significantly affected community variation. However, after elevation was selected, the conditional (additional) effects of the other variables were reduced dramatically. Only slope aspect and litter thickness qualified for the final model when the probability threshold level for factor entry was set at 0.05, suggesting this set of environmental variables built a simpler model which still sufficiently explains the species composition patterns. Finally, elevation, aspect and litter thickness were included in the model. The last two variables had relatively small marginal effects, but were independent of elevation, because they added explanatory power to elevation. The amount of variation captured by all the significant explanatory variables decreased to 18.4%.
Table 3 Marginal and conditional effects of explanatory variables on vegetation patterns from forward selection.

2.3. Ecological variation partitioning of significant environmental variables
The overall variation in community pattern was decomposed into eight components: pure effect of elevation (ELE), pure effect of aspect (ASP), pure effect of litter thickness (LT), joint effect of elevation and aspect (ELE∩ASP), joint effect of elevation and litter thickness (ELE∩LT), joint effect of aspect and litter thickness (ASP∩LT), joint effect of the three variables (ELE∩ASP∩LT) and unexplained variation.
The variation partitioning results indicated that all three variables had significant pure effects on the response variable (Table 4). Overall, community variation was best explained by elevation (13.1%), but less by aspect (3.9%) or litter thickness (3.7%). The results also show large fractions of shared variation, such as variation that cannot be attributed to any particular group. Among these joint effects, the largest came from ASP∩LT. The negative value of the shared variation component due to ELE ∩ ASP∩LT (–0.3%) indicated that the corresponding explanatory variables had opposite effects: one process hindered the contribution of the other in the joint regression model (Klimek et al. Reference Klimek, Richter gen. Kemmermann, Hofmann and Isselstein2007).
Table 4 Variance partitioning among the pure and joint effects of elevation (ELE), aspect (ASP) and litter thickness (LT) explaining variation in communities.

R 2=the amount of variation explained; P=P-value of MCP (1000 times). The joint effects were obtained by subtraction and could not be tested for significance.
3. Discussion and conclusions
Community variation is influenced by environmental variables with space and time heterogeneity, such as climate, topography, soil and human disturbance (Willis et al. Reference Willis, Halina, Lehman, Reich, Keen, Mccarthy and Cavender-Bares2010). In the PNNR, the variation within Prince Rupprecht's larch forest is closely related to all the tested environmental variables. The changes in plant communities in the RDA ordination space clearly illustrated the relationships between plant communities and environmental variables. Each community had a distribution area with a specific combination of environmental variables.
It is well established that strong correlations among environmental factors obscure the identification of causal mechanisms for community variation from field experiments (Zhang et al. Reference Zhang, Ru and Li2006a, Reference Zhang, Xi and Lib, Reference Zhang, Xu and Lic, Reference Zhang, Xu and Li2013). Community variation models can be fit to field data but suffer from ambiguity in parameter identification, and acceptable model structures emphasise different ecological processes. Therefore, their number should be reduced using forward selection of environmental variables in order to build a simpler model. According to the results of the conditional effects, elevation, aspect and litter thickness were selected sequentially. The fitness could not be significantly improved by the further addition of variables. Elevation was more important than the other environmental variables, because change of elevation leads to changes in humidity, temperature, soil type and other variables affecting community variation (Zhang et al. Reference Zhang, Xu and Li2013). Changes in aspect may lead to changes in the duration of sunshine, humidity and temperature, all of which affect community development (Virtanen et al. Reference Virtanen, Luoto, Rämä, Mikkola, Hjort, Grytnes and Birks2010). Although litter thickness can be considered as a response variable in terms of its response to the species composition of a stand and the age of a stand, litter also supplies nutrients, moisture and a sub-climate to the area (explanatory variable) (Blagoveshchenskii et al. Reference Blagoveshchenskii, Bogatyrev, Solomatova and Samsonova2006). Therefore, it can be also considered as an environmental factor affecting vegetation structure and organisation (Suriguga et al. Reference Suriguga Zhang, Zhang, Cheng, Zhang, Tian and Liu2011), consistent with this present study (Fig. 3, Table 3). Moreover, litter thickness was significantly and positively correlated with elevation (Table 4), possibly because litter decomposes more slowly as the mean temperature drops (Zhang Reference Zhang2005).
The decomposition of the explained variation in Prince Rupprecht's larch forest of the PNNR into pure and joint components indicates the relative importance of elevation, aspect and litter thickness. The variation partitioning results suggest that elevation is a crucial determinant for Prince Rupprecht's larch forest of the PNNR. Overall, we found a strong effect of elevation on vegetation patterns. These findings support the view that elevation has a strong influence on vegetation pattern in most mountains in the world (Doležal & Šrůtek Reference Doležal and Šrůtek2002; Zhang et al. Reference Zhang, Ru and Li2006a, Reference Zhang, Xi and Lib, Reference Zhang, Xu and Lic; Brinkmann et al. Reference Brinkmann, Patzelt, Dickhoefer, Schlecht and Buerkert2009), and is also a key factor affecting species diversity in mountains (Muhumuza & Byarugaba Reference Muhumuza and Byarugaba2009; McVicar & Körner Reference McVicar and Körner2013). However, after partitioning the effects of elevation, there was still a significant amount of variation in the species data that could be attributed to the pure effects of aspect and litter thickness. In general, the variation partitioning results revealed a relatively moderate amount of explained variation in the vegetation pattern, suggesting that the spatial pattern of communities was structured mainly by these environmental factors. In addition, dispersal limitation is also expected to contribute to determining species composition (Chytrý et al. Reference Chytrý, Lososová, Horsák, Uher, Danihelka, Fajmon, Hájek, Juřičková and Kintrová2012), especially for large organisms. It assumes that the individuals are functionally equivalent and predicts that community similarity decreases with increasing geographic distance independent of any environmental variables (Hubbell Reference Hubbell2001). The spatial patterns of community variation should also closely associate with geographic distance. Thus, the effect of environmental factors on community variation might be overestimated without regard to dispersal limitation in this study. However, the RDA was effective in revealing the deterministic processes. Furthermore, the unexplained variation may be caused by unmeasured environmental variables, such as soil chemical properties, which are important determinants of vegetation pattern in mountains (Navarro et al. Reference Navarro, Molina and Vega2011).
In conclusion our results indicate that Prince Rupprecht's larch forest of the PNNR clustered into eight groups using MRT, representing eight community types. The forward stepwise selection of the RDA presented here ranked both the marginal and conditional effects of six measured environmental factors on community variation. Furthermore, the results revealed that elevation, aspect and litter thickness contributed most to the variation in plant communities. The partitioning approach separated the pure effects and the shared effects of these three environmental factors and highlighted that elevation is the key factor in determining community variation in Prince Rupprecht's larch forest of the PNNR.
4. Acknowledgements
This study was supported by grants from the National Natural Science Foundation of China (Grant No. 41601027 and 31170494) and Natural Science Foundation of Shanxi Province, China (Grant No. 2013021030-3). Many thanks to Miroslav Srutek (Academy of Sciences of the Czech Republic) for valuable comments. The authors also thank Bin Zhang, Shiguang Tian, Mingfei Zhao and Lihong Fan for field assistance.
5. Contributions by the authors
Qindi Zhang and Jintun Zhang conceived and designed the experiments; Qindi Zhang performed the experiments and wrote the paper. Zongshan Li, Lei Yang and Xing Wu reviewed and edited the manuscript. All authors read and approved the manuscript.