


Freshwater resources represent only 3 % of the world's water and are mainly in frozen form, in which groundwater represent for only 30 % (Cassardo & Jones Reference Cassardo and Jones2011). Although groundwater has become an important source of freshwater for the domestic, industrial and agricultural sectors around the world, especially in arid and semi-arid regions, it has become a primary source of freshwater supply (Bouzourra et al. Reference Bouzourra, Bouhlila and Elango2015; Aouidane Reference Aouidane2017). In the southern Mediterranean regions, groundwater is the predominant source of agricultural and industrial use (Siebert et al. Reference Siebert, Burke, Faures, Frenken, Hoogeveen, Döll and Portmann2010). In Algeria, 67 % of irrigated land is irrigated by groundwater(Zektser & Loaiciga Reference Zektser and Loaiciga1993). Indeed, groundwater quality plays a crucial role in plant growth, human health and environmental. Yet, some natural processes can degrade these qualities, and these processes are increasing by human activities due to resource overexploitation. (Rina et al. Reference Rina, Singh, Datta, Singh and Mukherjee2013; Masoud et al. Reference Masoud, El-horiny, Atwia and Gemail2018). Therefore, it is important for the sustainable management of these resources to identify the geochemical processes that control groundwater.
The salinisation is one of the most prevalent pollution problems of water resources, especially in arid and semi-arid regions. Indeed, salinisation of groundwater is a global concern not only for the sustainable exploration of water resources but also for the protection of natural ecosystems (Pisinaras et al. Reference Pisinaras, Tsihrintzis, Petalas and Ouzounis2010; Li et al. Reference Li, Wang and Xie2016). Over the last few decades, salinisation of groundwater has become the subject of considerable research (Gibbs Reference Gibbs1970; Hsissoua et al. Reference Hsissoua, Chauvea, Maniaa, Manginb, Bakalowicz and Gaiz1996; Yermani et al. Reference Yermani, Zouari, Michelot, Mamou and Moumni2003; Pazand & Hezarkhani 2012; Grillot & Schoeller Reference Grillot and Schoeller2015; Aouidane & Belhamra Reference Aouidane and Belhamra2017). This problem can be attributed to natural and/or anthropogenic factors, such as the interaction of water rocks (Frape et al. Reference Frape, Fritz and McNutt1984; García & Blesa 2001; Ghesquière et al. Reference Ghesquière, Walter, Chesnaux and Rouleau2015), the saline intrusion of saline coastal water or Sabkha saline water (Capaccioni et al. Reference Capaccioni, Didero, Paletta and Didero2005; Wang & Jiao Reference Wang and Jiao2012) and fossil sea water (Tijani Reference Tijani2004; Akouvi et al. Reference Akouvi, Dray, Violette, de Marsily and Zuppi2008; Farid et al. Reference Farid, Trabelsi, Zouari and Beji2013). Furthermore, anthropogenic intervention has accelerated natural degradation processes through saline water intrusion due to overexploitation of groundwater, inadequate sewage disposal and residues from intensive agricultural and industrial activities (Bouderbala Reference Bouderbala2015; Zewdu et al. Reference Zewdu, Suryabhagavan and Balakrishnan2017).
Many approaches can be used to identify the geochemical processes of groundwater, including the use of binary ratios of minor and major tracers (Scanlon et al. Reference Scanlon, Keese, Flint, Flint, Gaye, Edmunds and Simmers2006; Gil-márquez et al. Reference Gil-márquez, Antonio and Andreo2017), isotopic tracers (Ghabayen et al. Reference Ghabayen, Mckee and Kemblowski2006; Hassen et al. Reference Hassen, Hamzaoui-Azaza and Bouhlila2016) and statistical analysis (Kharroubi et al. Reference Kharroubi, Tlahigue, Agoubi, Azri and Bouri2012; Viswanath et al. Reference Viswanath, Dileep and Ammad2015; Masoud et al. Reference Masoud, El-horiny, Atwia and Gemail2018).
Within this context, our study focuses on a semi-arid region – that of the Remila endorheic basin in northeastern Algeria, characterised by low rainfall, with a temporal and sporadic distribution. The region is considered an agricultural area with a population of more than 47,000 people, of which 800 ha are irrigated. However, the water supply comes mainly from groundwater through more than 500 boreholes. Therefore, as part of improving the quality management of the water supplies in this region, it is important to understand the main processes that control the mineralisation of this water.
The main aim of this study is to identify factors that control groundwater salinity. An integrated hydrogeological, hydro-chemical and statistical approach was used: (1) for the assessment of groundwater chemistry to highlight dominant groundwater mineralisation processes; (2) to use statistical analyses to identify distinct water groups and to assess the correlation between different elements and factors of water hydrochemistry; and (3) to identify recharge areas and major sources of contamination. A better understanding of the sources of salinisation and contamination of Remila aquifer system (Khenchela) will then serve as an important scientific basis for the study areas of water resource planning and management.
1. Materials and methods
1.1. Study area
The study area forms part of the Garaat Et Tarf endorheic basin in northeastern Algeria. It lies approximately on latitudes [35°25′N–35°40′N] and longitudes [06°30′E–07°05′E], with a uniform topography covering an area of 250 km2 where the altitude is between 800 and 1000 m. Geographically, the study area is bounded by Djbel Fdjoudj massif in the N, the saline depressions of Sabkha Gareat Et Tarf in the E and the northern slopes of Aurès Mountains in the S and W (Fig. 1) (C.P.H. 1977). The semi-arid climate of the region is characterised by annual rainfall of less than 400 mm with an average annual temperature of 17 °C, with minimum temperatures in January (6 °C) and maximum temperatures in August (30 °C), while the annual potential evapotranspiration is 1050 mm (K.M.S. 2014). Indeed, in the study area the surface water is scarce and periodic, so the water supply depends heavily on groundwater to meet the needs of a rural population of 47,000 inhabitants and in addition to the irrigation of an area of 800 ha.

Figure 1 Map showing location and spatial salinity distribution (TD) (high-water and low-water) of groundwater Remila (Khenchela).
1.1.1. Geological setting
The study region is characterised from a geological point of view by endorheic basins, where runoff converges into the inner lowlands and forms the Sabkha (salt depression) with a length of 50–60 km and a mean width of 20 km. As a whole, it represents a Mio–Pliocene floodplain with Quaternary deposits transported by streams and then deposited in a sequence of floodplains due to the flow regimes of the streams (Laffitte Reference Laffitte1939; C.G.G. 1969). Middle Cretaceous (Aptian) or Upper Cretaceous (Cenomanian, Turonian and Senonian) formations are the cretaceous formations surrounding the study area, covering the northern and southern part of the region. While in the NW parts, the Miocene is presented by a deposit of limestone–sandstone and limestone (Burdigalian), which are discordantly arranged on the Cretaceous and Pontian red marl. The eastern parts of the plain are surrounded by an endorheic salt depression (Sabkha Great ET Tart) (Vila Reference Vila1977). Thus, the lithostratigraphy of Remila plain is described by recent Quaternary soils.
1.1.2. Hydrogeological setting
In the study area, the hydrographic system distribution is related to the evolution of the structural phenomena. The hydrographic network is typified by a significant intensity with a temporary flow during the wet seasons. The most important stream is Boulefreis, which drains the whole region from NE to SW, but also there is the stream of Baghai that drains the eastern part, meeting Maarouf and Gueiss streams in the centre. All these streams flow into a closed low surface (Sabkha of Garaat Etarf) (D.H.W.K. 1984).
Remila aquifer exists in a sandy–marly limestone substratum of the Moi–Plio–Quaternary. Aquifer recharge is maintained through the drainage of runoff water from the northern slope of Aures. The MPQ aquifer is represented by two water tables, located in the alluvial filling of the plain (C.G.G. 1969).
1.2. Sample collection
During two campaigns, 70 groundwater samples were taken to identify the dominant hydro-geochemical processes in Remila aquifer system. The first campaign was collected in the low-water period in December–October 2013, after a dry season, whereas the second was collected in the high-water period from May to June 2014, after a wet season. We used methods recommended by Rodier et al. (Reference Rodier, Legube, Merlet and Coll2009) in the sampling and analysis to minimise handling errors. Sampling and measurements were carried out on functional boreholes. In fact, the borehole water was pumped two or three times before sampling, with regular monitoring of the electrical conductivity (EC) at the same time until the values were stable.
The samples from the water were untreated and raw. Water was collected from a pre-rinsed 1-L polyethylene bottle and filtered through a membrane filter of 0.45 um. The bottles were filled to minimise exposure to air, and transported in coolers (4 °C). The coordinates of the sampling have been determined using a global geographic positioning system (GPS GARMIN Olathe KS, US) (Fig. 1).
1.3. Sample analysis
Water physicochemical parameters such as EC, total dissolved solids (TDS), pH and temperature were measured in situ using a Consort C535 multi-parameter. Also, the dosage of the other parameters was conducted at Constantine University, Algeria, in the hydro-chemical laboratory (Table 1).
Table 1 Methods used for major ion and isotope analysis in the waters of Remila.

All the statistical analysis of the data was carried out using STATISTICA 7.1 (StatSoft1) software. Principal component analysis (PCA), correlation table and hierarchical clustering analysis (HCA) were applied in our case.
2. Results and discussion
2.1. General hydro-chemical features
2.1.1 Distribution of groundwater salinity
The results of the groundwater physicochemical analysis are given in Table 2. Our water salinity values (TDS) during dry season ranged from 568 to 1586 mg l−1, with an average of 906.3 mg l−1, which indicates low to moderate mineralisation of water, whereas the TDS values in the wet season ranged from 1250 to 3270 mg l−1, with an average of 1822.16 mg l−1, indicating that our water had raised from moderate to high mineralisation. However, after the wet season, we observed a significant increase in saline load; this suggests that rainwater that feeds groundwater significantly affects our water's mineralisation. The pH values of the majority of the points were close to neutrality; they were between 6.5 and 7, with an average of 6.9 during the wet period, yet the values oscillate between 6.5 and 7.21, with an average of 6.91 during the dry period – this indicates a slight seasonal variation.
Table 2 Descriptive statistics of Remila water parameters (mg l−1). Abbreviations: Std. Dev = standard deviation; Coef. Var = coefficient of variation.

The results of 35 points have led to generating a spatial distribution map of salinity (TDS) (Fig. 1). Water mineralisation variations are observed from upstream to downstream (S to N). This spatial variation can be divided into two types of water: low salinity water of the southern and western parts of the plain, and moderately salty water of the northern part near the Sabkha. This can be explained by Sabkha's significant saltwater effect.
2.1.2. Hydro-chemical facies
Identifying the hydro-chemical types of water is a useful tool for assessing water chemistry and processes such as mixing, cation exchange and dissolution. The Piper diagram is considered to be the common method for performing multiple analyses on the same graph and grouping the various water into well-defined facies (Piper Reference Piper1944). The results of the geochemical analysis of 70 samples are projected on the Piper diagram using DIAGRAMS 5.1 (Fig. 2). According to the results of the two companions, we can note the dominance of three water chemical facies: SO4–Cl–Ca salt water in the northeastern part of the region near Sabkha, SO4–Cl–Ca–Mg moderately salty water, which represents most of the points, and finally the good quality type HCO3–Ca–Mg by meeting them in the southeastern part of the zone.
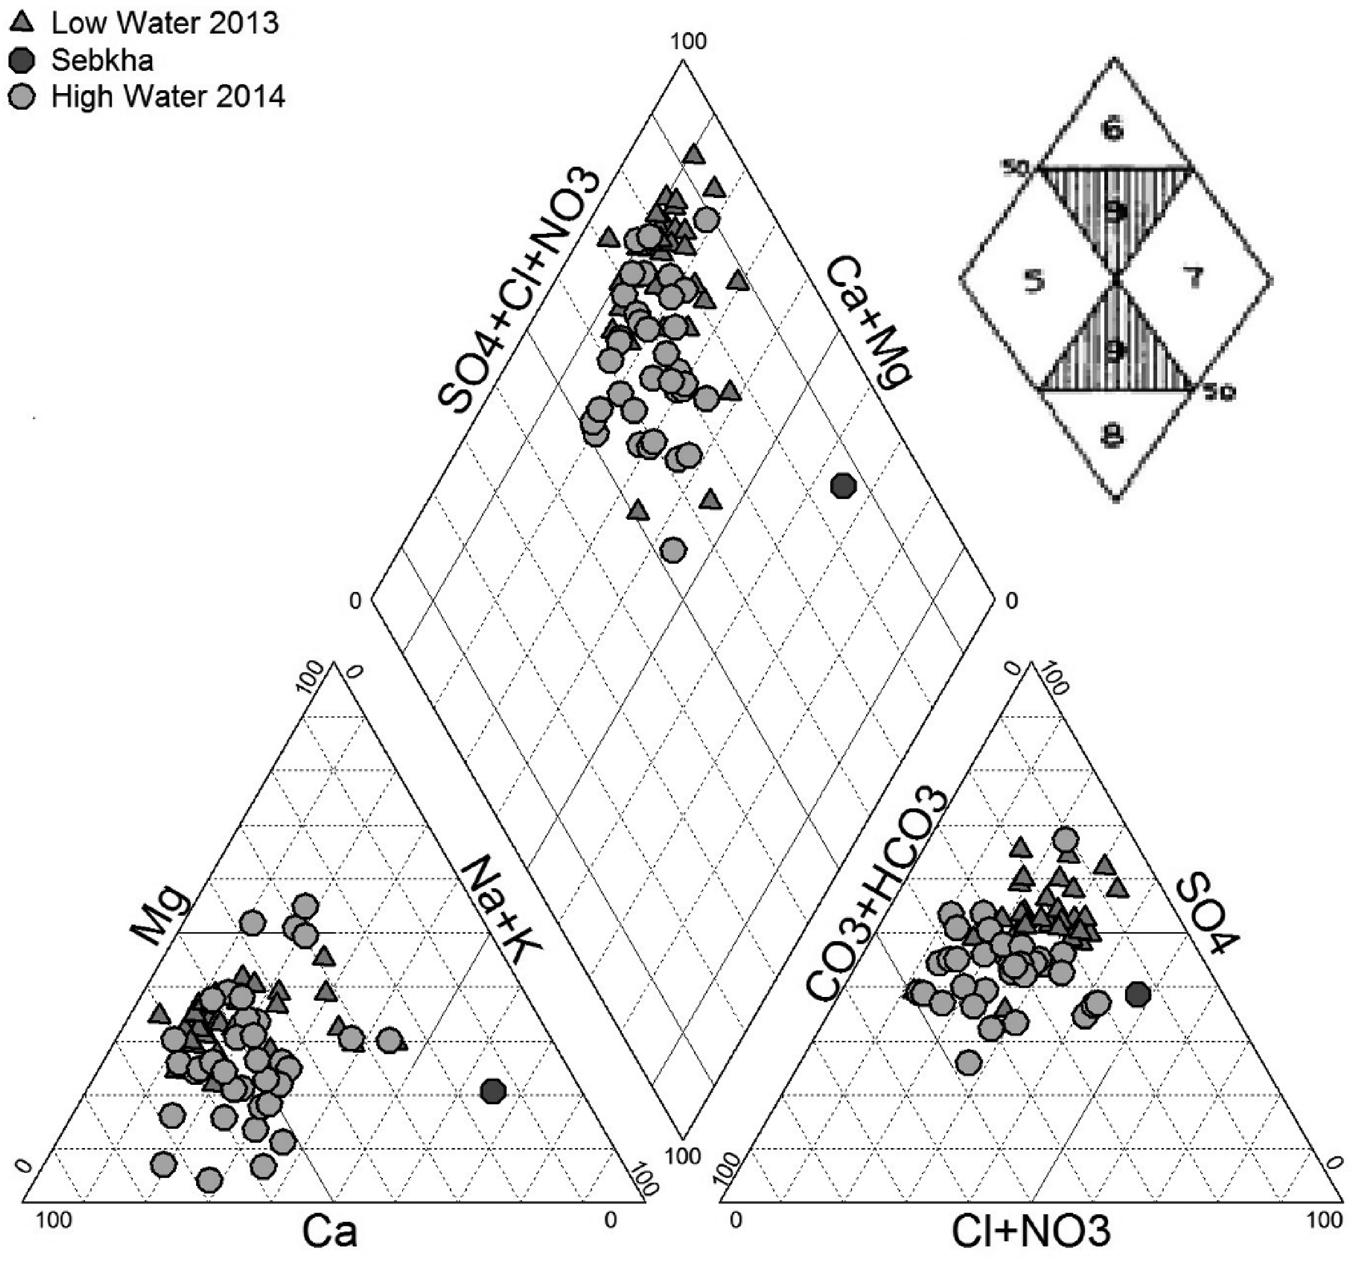
Figure 2 Piper diagram of groundwater (low-water and high-water) of the Remila.
In the anionic triangle, especially after the wet period, most of the water points have shown a tendency to SO42− dominance, while there was a tendency to Ca2+ dominance in the cationic triangle. This indicates that different processes affect the aquifer system: dissolution and/or precipitation, ion exchange and saltwater intrusion of Sabkha water.
2.2. Statistical analysis
Descriptive statistical evaluation of data is a critical step in any statistical analysis (Table 2) (Yang et al. Reference Yang, Zhang, Yin and Liu2011; Hosseini et al. Reference Hosseini, Kappas, Bodaghabadi, Chahouki and Khojasteh2014). The most important factor that can describe the variability of the water parameter values is the variance coefficient (VC). A low VC (<10 %) for pH was calculated indicating a low spatial variability in the study area. While for the TDS, HCO3−, Ca2+ and ferrous (Fe2+), a moderate coefficient of variance (20–50 %) was observed, indicating a moderate spatial variability for these parameters, and was mainly influenced by natural factors. However, very high VC values above 50 % were observed for magnesium (Mg2+), sodium (Na+), potassium (K+), sulphate (SO42−), Chlorine (Cl−) and nitrate (NO3−), indicating a very high spatial variability that the parameters have been affected by natural and anthropogenic factors.
Skewness reflects the symmetrical distribution of the data; if the values are lower than zero, all the data are below the mean, but if the values are equal to zero then the data have a normal distribution (Brovelli et al. Reference Brovelli, Carranza-Diaz, Rossi and Barry2011). The calculated skewness values of Ca2+, Na+ and HCO3− were close to zero, indicating that the data follow a normal distribution. However, other parameters had values >1, and did not require a data transformation. In statistics, several researcher's studies (Kerry & Oliver Reference Kerry and Oliver2007; Oliver Reference Oliver2010; Oliver & Webster Reference Oliver and Webster2014) have shown that if the skewness values are beyond the standard ± 1 limit, they do not necessarily mean a data transformation for a more precise analysis, especially when the data value is high.
2.2.1. Pearson's correlation matrix
Using the correlation matrix of various parameters, numerous significant correlations were established (Table 3). A strong correlation (r > 0.7) was found between the chemical tracers SO42−, Cl−, Mg2+, Na+, Ca2+, strontium (Sr2+) and TDS, indicating an evaporite origin (from halite (NaCl), anhydrite (CaSO4), gypsum (CaSO4 2H2O), epsomite (MgSO4) or celestite (SrSO4)) of these elements in the water. However, this was not the case for HCO3−, which has a low correlation with the salinity indicator TDS, explained by its low concentration in the water solution that ranges between 54.9 and 280.6 mg l−1. In addition, the correlation coefficients between chloride (r = 0.81) and sodium (r = 0.81), with the (TDS), showed the same origin for these two elements. On the other side, there was a slight difference between sulphate (r = 0.95), magnesium (r = 0.87) and calcium (r = 0.66) correlation coefficients with TDS. This can be explained by the non-conservative transport of calcium and magnesium ions (thus, the participation of these cations in cation exchange with clay minerals that are most abundant in the area and/or in precipitation/dissolution reactions) (Van Breukelen et al. Reference Van Breukelen, Appelo and Olsthoorn1998).
Table 3 Correlation matrix of different water parameters in the Remila plain (Khenchela) (mg l−1).

Observing the relationship between anions and cations, significant correlations were found between Cl− and Na+ (r = 0.55), Cl− and Ca2+ (r = 0.74), Cl− and Mg2+ (r = 0.68), Cl− and K+ (r = 0.65), SO42− and Mg2+ (r = 0.93), SO42− and Ca2+ (r = 0.61). This tends to prove that most chloride came from the dissolution of sylvite (KCl) and NaCl, but a very small proportion of this anion could come from the dissolution of other minerals. The low correlation between chloride and sodium indicates the involvement of sodium ions in cation exchange with the clay substratum of the aquifer. Additionally, there was a relatively significant correlation between Cl− with Ca2+ (0.74) and Mg2+ (0.68). This was due to the water salinity caused by many processes that characterise highly mineralised water, including cation exchange, gypsum and halite dissolutions, and this lead to the increase of calcium, magnesium and chloride concentrations, respectively.
We carried out a main PCA and HCA using the software STATISTICA 8 (Statsoft 2010) in an attempt to clarify the relationship between the chemical elements (variables) and grouping water points (individuals) with the same chemistry.
2.2.2. PCA
In order to characterise geochemistry and water types, more and more research relies on statistical analyses; the PCA approach is one of the most suggested approaches (Ayadi et al. Reference Ayadi, Mokadem, Besser, Redhaounia, Khelifi, Harabi, Nasri and Hamed2018). In the Remila aquifer samples, the variable factors F1–F2 (Fig. 3a) show that this plane expresses 53.95 % of the expressed variance. The factor F1 (36.74 %) is negatively determined by the majority of the elements: TDS, SO42−, Cl−, Mg2+, K+, Na+ and Ca2+; therefore, it has a mineralisation axis of evaporates and salinity. The F2 explains 17.21 % of the total variance, which is positively determined by the pH and HCO3−, indicating that the dissolution of carbonates does not contribute to the salinisation of waters.

Figure 3 Statistical analysis: (a) principal component analysis; (b) the ascending hierarchical clustering of Remila waters (Khenchela).
The projection results, variables and individuals in the factorial plan (F1, F2), shown in Figure 3a, allow us to note three different water groups. The first type I saline water represents 17 %, has a TDS that exceeds 1000 mg l−1 and is characterised by a high concentration of SO42−; type II is moderately saline water with high concentrations of HCO3− and represents 17 %; and type III is moderately saline water with mixed facies, representing the majority of waters with 66 %.
2.2.3. HCA
Ascending hierarchical clustering (AHC) is a powerful multivariate statistical method used to analyse water chemistry data for geochemical model formulation (Yidana et al. Reference Yidana, Ophori and Banoeng-Yakubo2008; Ahoussi et al. Reference Ahoussi, Soro, Kouassi, Soro, Blaise and Pacôme2010).
The results from the analysis of the hierarchical ascending data classification can be observed in the dendrogram (Fig. 3b), in which three principal groupings of the variables are highlighted. The first group includes the variables: TDS, SO42−, Mg2+, K+, Na+, Cl−, Ca2+ and Sr2+. This grouping represents the elements that play a major role in the mineralisation of the water, especially for sulphate, which is closely linked to TDS. The second group consists of HCO3−, Fe2+ and pH, which contributes only weakly to water mineralisation. The third group, represented by manganese (Mn2+) and lithium (Li+), is more variable and has a marginal effect on the water mineralisation.
The results provided by the PCA of the individual samples and AHC are in perfect agreement, since they demonstrated that water mineralisation is dominated by sulphate; in addition, the typology of the water samples can be represented by three facies.
2.3. Groundwater mineralisation processes
A statistical relation between two or more variables is indicated by correlations. The results show that SO42−, Mg2+, Cl−, Ca2+, Na+, HCO3−, Sr2+, K+ ions and TDS are significantly correlated, indicating the contribution of these elements to groundwater salinity and suggesting that evaporitic rocks dissolution may be a common source of mineralisation. Such results require geochemical calculations of speciation solubility in order to identify the dominant processes, which influence Remila plain groundwater hydro-geochemistry.
2.3.1. Water-rock interaction
Gibbs diagrams are widely used to evaluate the functional source of dissolved ions that control water chemistry such as precipitation dominance, rock weathering and evaporation dominance (Gibbs Reference Gibbs1970; Dhanwinder-singh Reference Kuldip-Singh, Hundal and Dhanwinder2011; Varol & Davraz Reference Varol and Davraz2014; Masoud et al. Reference Masoud, El-horiny, Atwia and Gemail2018). The chemical data are plotted in a semi-logarithmic dispersion of TDS values versus anions (Cl−/(Cl− + HCO3−)) and cations (Na+/(Ca2+ + Na+)); all concentrations of ionic values are expressed in meq/l (Fig. 4).

Figure 4 Gibbs Diagrams of Remila groundwater.
As shown by the data projected in the Gibbs diagrams, the majorities of the groundwater samples of the two seasons are located in the predominantly rocky zone, but also have a tendency towards the zone of evaporation and precipitation. Therefore, the mineralisation of our water is controlled by the dissolution of evaporitic rocks and is affected by Sabkha saline water, which is subjected to intense evaporation followed by salt precipitation, which will affect the quality of our waters, particularly in the northeastern part of the area.
Most of the results show an excessive concentration of cations versus anions, indicating that another source of these cations should be possible, such as ion exchange. Nevertheless, Schoeller (Reference Schoeller1965) proposed a chloro-alkaline index (CAI) that can be used to determine the degree of ion exchange reactions between the aquifer substratum and groundwater. It is a commonly used tool for the recognition of dominant processes of ion exchange in groundwater (Abu-alnaeem et al. Reference Abu-alnaeem, Yusoff, Ng, Alias and Raksmey2018; Ayadi et al. Reference Ayadi, Mokadem, Besser, Redhaounia, Khelifi, Harabi, Nasri and Hamed2018). The CAI is calculated using the equation (Cl− – (Na+ + K+)) / Cl−; the values are in meq/l. If the CAI values tend to decrease (negative), this indicates a dominance of the basic processes of ion exchange, where Ca2+ and Mg2+ are adsorbed on the substratum and K+ and Na+ are released in water. Whereas, if the CAI index values tend to increase (positive), this implies a dominance of the processes of reverse ion exchange, where K+ and Na+ are adsorbed on the substratum and Ca2+ and Mg2+ are released in water. However, if the CAI values are close to zero and show a balance, this implies the absence of an exchange process.
The calculated CAI in the study area shows positive values for most groundwater samples (68 %); this indicates the dominance of the reverse exchange process in which Ca2+, Mg2+ of the aquifer substratum is released and Na+, K+ are adsorbed. Although just 26 % of the samples have values close to zero, which imply equilibrium and indicates an absence of ion exchange, they have been found in the southeastern part of the region. Nevertheless, only 2 % of the samples show negative values, which indicates the dominance of the processes of direct ion exchange, thus releasing Na+, K+ from the aquifer substratum and fixing Ca2+, Mg2+ from the water, they have been found in the northeastern part of the region.
The saturation index (SI) is a commonly used tool to identify water–rock interactions, as well as the hydro-chemical processes that control groundwater chemistry (Parkhurst & Appelo Reference Parkhurst and Appelo1999; Rina et al. Reference Rina, Singh, Datta, Singh and Mukherjee2013; Ayadi et al. Reference Ayadi, Mokadem, Besser, Redhaounia, Khelifi, Harabi, Nasri and Hamed2018). The SI describes the level of saturation of the water towards the various minerals: when SI = 0, the minerals in the solution are in equilibrium; when SI < 0, the solution is under-saturated, which promotes the dissolution of minerals, while SI > 0 indicates the saturation of the solution that contributes to the precipitation of the minerals (Appelo Reference Appelo1994). The mineral SI was calculated using the PHREEQC geochemical modelling program (Parkhurst & Appelo Reference Parkhurst and Appelo1999), and using the following equation:
 $$SI = \log \left({\displaystyle{{IAP} \over {K_t}}} \right)$$
where IAP = ion activity product and Kt = equilibrium solubility constant.
The results show that the area's groundwater is under-saturated with respect to gypsum, anhydrite and dolomite (SI < 0), which indicates that these minerals should be dissolved in our water. Although the groundwater is slightly under-saturated with calcite and aragonite, this means that they are in a state of equilibrium, but these minerals can still influence the chemical composition of the water (Fig. 5).

Figure 5 Saturation index (SI) variability diagrams in groundwater at Remila (Khenchela).
2.3.2. Dissolution/precipitation of carbonate and evaporite minerals
In order to gain insight into the geochemical mechanisms and processes that contribute to water mineralisation, ionic ratios are commonly used.
In the dissolution of carbonate and gypsum, hydro-chemical results show that the predominant salt elements are SO42−, Mg2+, Ca2+ and HCO3−; this appears to be the cause of dissolved evaporites. Consequently, dissolving carbonate and gypsum minerals is a crucial process in water mineralisation (Eqs 2–5) (Edmunds et al. Reference Edmunds, Bath and Miles1982):
 $${\rm CaC}{\rm O}_3 + H_2{\rm C}{\rm O}_3\to {\rm C}{\rm a}^{{\rm 2\ + \ }} + {\rm 2HC}{\rm O}_3^- $$
 $${\rm CaMg}( {{\rm C}{\rm O}_3} ) _2 + 2{\rm H}_2{\rm C}{\rm O}_3\to {\rm C}{\rm a}^{{\rm 2\ + \ }} + {\rm M}{\rm g}^{{\rm 2\ + \ }} + {\rm 4HC}{\rm O}_3^- $$
 $${\rm CaMg}( {{\rm C}{\rm O}_3} ) _2 + 2{\rm H}_2{\rm C}{\rm O}_3\to {\rm CaC}{\rm O}_3 + {\rm M}{\rm g}^{{\rm 2\ + \ }} + {\rm 2HC}{\rm O}_3^- $$
 $${\rm CaS}{\rm O}_4{\rm \times 2}{\rm H}_2O\leftrightarrow {\rm C}{\rm a}^{{\rm 2\ + \ }} + {\rm S}{\rm O}_4^{ 2\hbox{-} } + 2{\rm H}_2O$$
Generally, carbonate dissolution is identified by the Ca2+/HCO3− ratio in meq/l. If the dissolution of calcite affects the water, the values in this ratio are close to the dissolution line (1:1), but if the ratio values are close to 0.5 this indicates that the dissolution of dolomite is the source of those ions. When the values exceed 1, this indicates another source of those ions (Abu-alnaeem et al. Reference Abu-alnaeem, Yusoff, Ng, Alias and Raksmey2018). Based on the projection results of the water points (Fig. 6a), we notice that most of the points are above the dissolution line (1:1), suggesting an excess of Ca2+ versus HCO3−. This confirms that other processes such as gypsum dissolution and ion exchange affect the concentration of Ca2+ ions in water. While there are only two water points below the dissolution line (1:1), which indicates a deficit of Ca2+ by supplying HCO3−, this can be explained by calcite and/or dolomite precipitation and ion exchange favoured by the saline intrusion of the Sabkha water. The dissolution of calcite and dolomite in groundwater can be assessed by using another ratio: Ca2+/Mg2+. If the ratio values are close to or equal to 1, the water has been affected by the dissolution of the dolomite; on the other hand, if the ratio values are between 1 and 2, the water has been affected by the dissolution of the calcite; and finally, when the ratio values exceed 2, the water has been affected by the dissolution of the silicate minerals (Lakshmanan et al. Reference Lakshmanan, Kannan and Senthil Kumar2003). According to the calculated results, the majority of the samples (64 %) have ratios between 1 and 2, while 23 % of the samples have ratios close to or equal to 1, which suggests that the source of Ca2+ ions in most water comes from the dissolution of calcite and dolomites, whereas some ions are affected by the process of ion exchange.

Figure 6 Scatter plots of (a) Ca2+ versus HCO3−; (b) Ca2+ versus Mg2+; (c) Ca2+ versus SO42−; (d) Sr2+/Ca2+ ratio of low waters; (e) Na+ versus Cl–; (f) Sr2+/Ca2+ ratio of high waters of the Remila groundwater samples.
Within the dissolution of gypsum, the ratio Ca2+/SO42− (meq/l) is widely used to assess the dissolution of gypsum in water. The projection of the results in the Ca2+ versus SO42− binary diagram (Fig. 6c) shows that most groundwater samples are near to the gypsum dissolution line (1:1), which indicates that gypsum is an important source of Ca2+ in the area's water. Although other samples are above the dissolution line, this suggests a deficit of Ca2+, which can be explained by inverse ion exchange involvement, by the Ca2+ adsorption and Na + release, while this has been favoured by the saline intrusion (Sabkha) in the northeastern part of the area. However, according to Appelo (Reference Appelo1994), the saline intrusion induces dolomitisation, and this will cause Ca2+ ion fixation and the release of Mg2+ ions. On the other hand, some water points show an excess of Ca2+ relative to SO42−, with a surplus of Ca2+ followed by a deficit of Na+, which confirms the involvement of these two ions in ion exchange. The Sr2+/Ca2+ ratio of molar concentrations also helps us to determine the source of sulphate in groundwater (Hsissoua et al. Reference Hsissoua, Chauvea, Maniaa, Manginb, Bakalowicz and Gaiz1996; Edmunds et al. Reference Edmunds, Guendouz, Mamou, Moulla, Shand and Zouari2003). The calculated ratio results (Fig. 6d, f) showed that all water points had values greater than 5‰, indicating the effect of gypsiferous formations on the presence of strontium. This result is completely consistent with the types of facies found in the study area where sulphates are most predominant.
In the dissolution of halite, the results of the sampled water suggest a high Na+ and Cl− content, and halite dissolution is often the source of these ions. A binary diagram of Na+ versus Cl− was used to identify the source of these ions (Fig. 6e). The distribution of water points in the diagram shows the presence of three groups of water: the first group is the point close to the halite dissolution line (1:1), which means that the water is influenced by the dissolution of the halite; often it is the water in the southeastern part of the region close to the recharge area. The second group was represented by most of the water points below the line (1:1), indicating a deficit in Na+ compared to Cl−, revealing that the water is influenced by processes other than halite dissolution, such as reverse ion exchange with Na+ adsorption and the release of Mg2+ and/or Ca2+ from the substratum. The third group includes the water points above the halite dissolution line (1:1), which are characterised by an excess of Na+ compared to Cl−; they are located in the northeastern part of the study area, where these waters are overloaded with Na+ under the influence of saline intrusion (Sabkha water), and this could be favoured by the intensive exploitation of the aquifer, which lowered the piezometric level of the aquifer followed by the advancement of the Sabkha saline water.
Within the cationic exchange, wide fluctuations in the concentration of major ions occur by various processes; ion exchange often causes changes or reversals of groundwater cationic concentrations. However, studying the relationship between Ca2+ + Mg2+ and HCO3− + SO42− will allow us to identify the processes that influence groundwater mineralisation. The binary diagram of Ca2+ + Mg2+ versus HCO3− + SO42− (Fig. 7a) shows a projection of the water points around the line (1:1). Generally, the water points, which are close to or on the line (1:1), are under the influence of the dissolution of calcite, dolomite, anhydrite and gypsum (Hamzaoui-Azaza et al. Reference Hamzaoui-Azaza, Tlili-Zrelli, Bouhlila and Gueddari2013; Hassen et al. Reference Hassen, Hamzaoui-Azaza and Bouhlila2016). While water points that are above the line (1: 1) indicate an excess of Ca2+ + Mg2+, they are generally influenced by ion exchange (Tlili-Zrelli et al. Reference Tlili-Zrelli, Hamzaoui-Azaza, Gueddari and Bouhlila2013). In fact, the water points below the line (1:1) indicate a deficit of Ca2+ + Mg2+; this decrease in concentration is attributed to reverse ion exchange (Rina et al. Reference Rina, Singh, Datta, Singh and Mukherjee2013). The results of the water point projections in the diagram (Fig. 7a) show that most water points are above the line (1:1) due to excess Ca2+ + Mg2+ and this indicates that reverse ion exchange is a very abundant geochemical process in the aquifer. The water points located in the northeastern part near Sabkha (salt water) are projected below the line (1:1), suggesting a deficit in Ca2+ + Mg2+, which indicates that the water in this part of the study area is under the influence of ion exchange and saline intrusion.

Figure 7 Scatter plots of (a) Ca2+ + Mg2+ versus HCO3− + SO42−; (b) (Ca2+ + Mg2+) – (HCO3− + SO42−) versus (Na+ + K+) – Cl− in (meq/l) of the Remila groundwater simples.
For further confirmation that the ion exchange process affects the hydrochemistry of Remila groundwater, another diagram is generated – this diagram has been widely used in various studies (García & Blesa 2001; Bekkoussa et al. Reference Bekkoussa, Jourde, Batiot-Guilhe, Meddi, Khaldi and Azzaz2013; Kraiem et al. Reference Kraiem, Zouari, Bencheikh and Agoun2015). The diagram (Ca2+ + Mg2+)–(HCO3− + SO42−) versus (Na+ + K+)-Cl− in (meq/l) (Fig. 7b) shows that the ion exchange process may be a feature of the study area, since most water points follow a straight line (R 2 = 0.72) with a slope of 1.08, suggesting that the cations Ca2+, Mg2+, Na+ and K+ are integrated into the cation exchange reactions. The sample distributions show that the majority of the saline groundwater in the western part of the area has migrated in the same direction, with a rise in Ca2+ and Mg2+ concentrations and a decrease in Na+ and K+ concentrations, indicating that water mineralisation is affected by rock dissolution accompanied by an ion exchange. Although water points located in the NE parts of the area are characterised by a high concentration of sulphate, they show a slight decrease in Ca2+ and Mg2+, whereas significant increases in Na+ and K+ are observed. Such findings can be explained by the effect of reverse ion exchange in which Na+ is released from the substratum and the Ca2+ are adsorbed, which is favoured by the saline intrusion of Sabkha saline water (Appelo Reference Appelo1994). These results confirm that two main processes control our water hydrochemistry: dissolution of evaporitic rocks and ion exchange.
3. Conclusion
The unmanaged extraction of groundwater, low and sporadic annual rainfall and the land endorheic have created an inversion of the hydraulic gradient and, thus, an increase in the salinity of the groundwater and a change in the hydro-chemical facies of the groundwater of Remila plain. In order to identify the main salinisation processes and the origin of the degradation of the quality of the aquifer system in the study area, an integrated statistical hydro-geochemical approach has been applied. The results show a significant salinity variation (TDS) of 568 to 1586 mg l−1 with an average of 906.3 mg l−1 after the dry season, and 1250 to 3270 mg l−1 with an average of 1822.16 mg l−1 after the wet season, indicating that precipitation during the rainy season was also a major source of dissolved species in the groundwater. Spatial variation suggests that three facies dominate the aquifer: SO4–Cl–Ca saline water in the NE, HCO3–Ca–Mg water in the SE is of decent quality and SO4–Cl–Ca–Mg moderately saline water represents most of the water, which mainly results from water–rock interactions, such as evaporite and carbonate mineral dissolution and cation exchange reactions.
Statistical analysis reveals a normal distribution of the data, and the Variance Coefficient (CV) points out that the measured parameters are mainly influenced by environmental factors, especially during the rainy season, whereas the overall direct anthropogenic effects in the study area were minor. The relationship between the physicochemical parameters using the Pearson correlation showed that there seemed to be common sources for the variables, which is evaporite dissolution. Through a multivariate statistical analysis using PCA and HCA, three groups of water were identified: (1) saline water with SO42− dominance (17 %), where TDS> 1000 mg l−1; (2) moderately saline water with HCO3− dominance (17 %); and (3) moderately saline water with mixed facies (66 %).
The coupled use of major and minor ion chemistry has made it possible to identify the geochemical processes that take place in Remila aquifer. Interesting processes have been identified, including the dissolution and/or precipitation of evaporitic rocks (calcite, gypsum, halite and dolomite), often accompanied by cation exchange or reverse cation exchange. In addition, another process (saline water intrusion) has been identified in the northeastern part near the Sabkha, which is generated by the intensive exploitation of the aquifer by farmers. This process may pose a long-term water quality problem due to the reverse exchange in groundwater (sodium-enriched water with its problems). Unless current levy rates do not decrease, this process could represent a long-term problem for the region's groundwater quality due to reverse exchange (with sodium enrichment of the water and its impact on environmental degradation).
The results of this study indicate that the integrated statistical and hydro-geochemical approach can be a very effective tool to identify the processes that control groundwater and the different sources of salinisation in water. Therefore, the results of this study can be used as a conceptual platform for future research. In addition, the improvement of the hydro-geochemical knowledge of Remila plain aquifer system may lead to the implementation of a series of measures that aim towards making progress on groundwater management. They can be summarised as follows: the reduction of groundwater withdrawals (particularly for irrigation) by the use of treated wastewater or/and dam construction in the S of the region; the relocation of pumping wells (particularly in the northeastern part of the area) to other aquifer sectors less vulnerable to salinisation; and the development of a monitoring network. This study shows that to achieve sustainable exploitation of groundwater, without deteriorating its quality, it is necessary to have prior hydro-geochemical knowledge of the aquifer that is to be exploited. Unconfined aquifers such as the Quaternary, found in semi-arid areas with short renewal periods, are very vulnerable to exploitation. During periods of drought, the pumping of groundwater can generate rapid drawdowns at piezometer levels – a situation that favours the intrusion of salt water from Sabkha.


