


For over half a century, scholars have been studying Quaternary sediments and associated environmental information, making significant achievements (Allen et al. Reference Allen, Brandt, Brauer, Hubberten, Huntley, Keller, Kraml, Mackensen, Mingram, Negendank, Nowaczyk, Oberhänsli, Watts, Wulf and Zolitschka1999; Lu et al. Reference Lu, Fang, Lu, Han, Yang, Li and An2004; Gorbarenko et al. Reference Gorbarenko, Goldberg, Kashgarian, Velivetskaya, Zakharkov, Pechnikov, Bosin, Psheneva and Ivanova2007; Rao et al. Reference Rao, Chen, Cheng, Liu, Wang, Lai and Bloemendal2013; Chen et al. Reference Chen, Huo, Qian and Li2020a, Reference Chen, Qian, Hou, Zhang and Zhangb). In particular, the loess–palaeosol sequence on the Loess Plateau in China is considered one of the three major global cornerstones for research on Quaternary climate change because of its sensitivity to paleoclimatic environment changes and the detailed records available about the strata (Chen et al. Reference Chen, Li, Han and Yang2008; Peng et al. Reference Peng, Hao, Frank and Guo2014; An et al. Reference An, Wu, Li, Sun, Lu, Zhou, Cai, Duan, Li, Mao, Cheng, Shi, Tan, Yan, Ao, Chang and Feng2015; Liu et al. Reference Liu, Jin, Hu, Jiang, Ge and Andrew2015; Wang et al. Reference Wang, Huang, Yang, Lu, Dong, Li and Guan2019a, Reference Wang, Yang, Wang, Lu, Guan, Li, Deng and Johnb). Over time, research on the Loess Plateau has made significant contributions to revealing the climatic evolution of East Asia and the world (Kukla & An Reference Kukla and An1989; Liu & Ding Reference Liu and Ding1998; Balsam et al. Reference Balsam, Ji and Chen2004; Torrent et al. Reference Torrent, Liu, Bloemendal and Barron2007). However, only a few studies have observed changes in the hydraulic properties of the sedimentary sequence in the Loess Plateau that resulted from Quaternary climate change (Chen et al. Reference Chen, Wu and Qian2016, Reference Chen, Qian and Wu2017; Chen & Qian Reference Chen and Qian2017). Many scholars have focused only on the source, migration, water-chemical properties, and occurrence of groundwater in the loess. Previous studies have found that atmospheric precipitation is the only source of supply; groundwater in the loess occurs in various forms, including capillary, pore, and fracture water, and the chemical properties of groundwater have considerable influence on the regional environment (Qian & Li Reference Qian and Li2011; Huang et al. Reference Huang, Pang and Edmunds2013; Li et al. Reference Li, Qian, Wu, Zhang and Zhang2013a, Reference Li, Wu and Qianb; Liu et al. Reference Liu, Jin, Hu, Jiang, Ge and Andrew2015; Wang et al. Reference Wang, Huang, Yang, Lu, Dong, Li and Guan2019a, Reference Wang, Yang, Wang, Lu, Guan, Li, Deng and Johnb). However, differences in percolation between the loess–palaeosol sequences have rarely been examined with high accuracy. Consequently, it is necessary to accurately measure the relationships among levels of aquifer development in the Loess Plateau, the causes of such differences, and the effects of Quaternary climate change.
The Shaanxi Guanzhong Basin is a major granary in the north-western part of China; it has a well-deposited loess–palaeosol sedimentary sequence and rich groundwater resources (Wang et al. Reference Wang, Wang, Liu and Zheng2007; Pan et al. Reference Pan, Wang, Zhang and Rui2015; Zhao et al. Reference Zhao, Ma, Luo, Yue, Shao and Dong2017; Wu et al. Reference Wu, Li, Qian and Chen2019). Identifying the relationships between the differences in the hydraulic properties of the loess–palaeosol sequences and the environment is significant in order to conserve and restore the ecosystem in the Loess Plateau while sustainably building its industrial and agricultural development more effectively.
The S5 formation on the Loess Plateau is the most obvious stratum in the Quaternary loess strata in China because of its extremely thick deposition, characteristic colour, and strong soil microstructure. The fifth palaeosol, S5, was formed under subtropical humid-warm conditions and is the most noticeable regional marker bed for the Loess Plateau and is equivalent to the 13th–15th marine isotope stages, as shown in the deep-sea-deposited oxygen isotope curve (Ruddiman et al. Reference Ruddiman, Raymo, Martinson, Clement and Backman1989; Thomas et al. Reference Stevens, Thomas, Armitage, Lunn and Lu2007; Wu & Qian Reference Wu and Qian2016). Compared with the average temperature since 1950, temperatures in the Quarternary were 4–6°C higher, with 200–300 mm more annual precipitation (Kukla et al. Reference Kukla, Heller, Liu, Xu, Liu and An1998). The overlying fifth Malan loess, L5, is believed to have been deposited under an extremely dry-cold climate (Liu & Ding Reference Liu and Ding1998; Song et al. Reference Song, Chen, Qian, Li, Li, Li, Chang and An2014; Wu et al. Reference Wu, Li and Qian2018). The differences between the two sedimentary environments lead to variations in physical properties, which may, in turn, cause similarities and variations in the chemical-physical properties of the strata.
On the basis of these observations, the relationships between the magnetic susceptibility and grain-size composition (indices that reflect climate change) of the fifth layer of the loess–palaeosol sequences and the differences in the water-chemical properties in the strata of the Xiushidu (XSD) Quaternary profile at the southern edge of Jinghe River in Guanzhong Basin, China, were examined through field survey, sampling, and laboratory experimentation. The purpose of these experiments in loess–palaeosol was to: (1) compare the permeability characteristics and the related causes under different hydraulic gradients; (2) determine differences in permeability under different paleoclimatic environments and reveal their causes; and (3) define recharge conditions and identify factors in different aquifers that impact those conditions.
1. Geographical and geochronological background
The XSD loess–palaeosol at the southern edge of the Jinghe River is located in Guanzhong Basin [108°29′40″E, 34°26′37″N] (Fig. 1), 26.2 km N from Xi'an. The study area features a warm temperate continental monsoon climate and four distinct seasons with both rain and high temperatures during the same period. The annual average temperature since 1950 is 13 °C, the lowest temperature in winter was −20.8 °C, and the highest temperature in summer reached 41.4 °C. The annual average rainfall since 1950 is approximately 548 mm, the mean annual sunshine duration is 2195.2 h, with the longest duration in August of 241.6 h. Field sampling for this study was conducted from late August to early October in 2017.
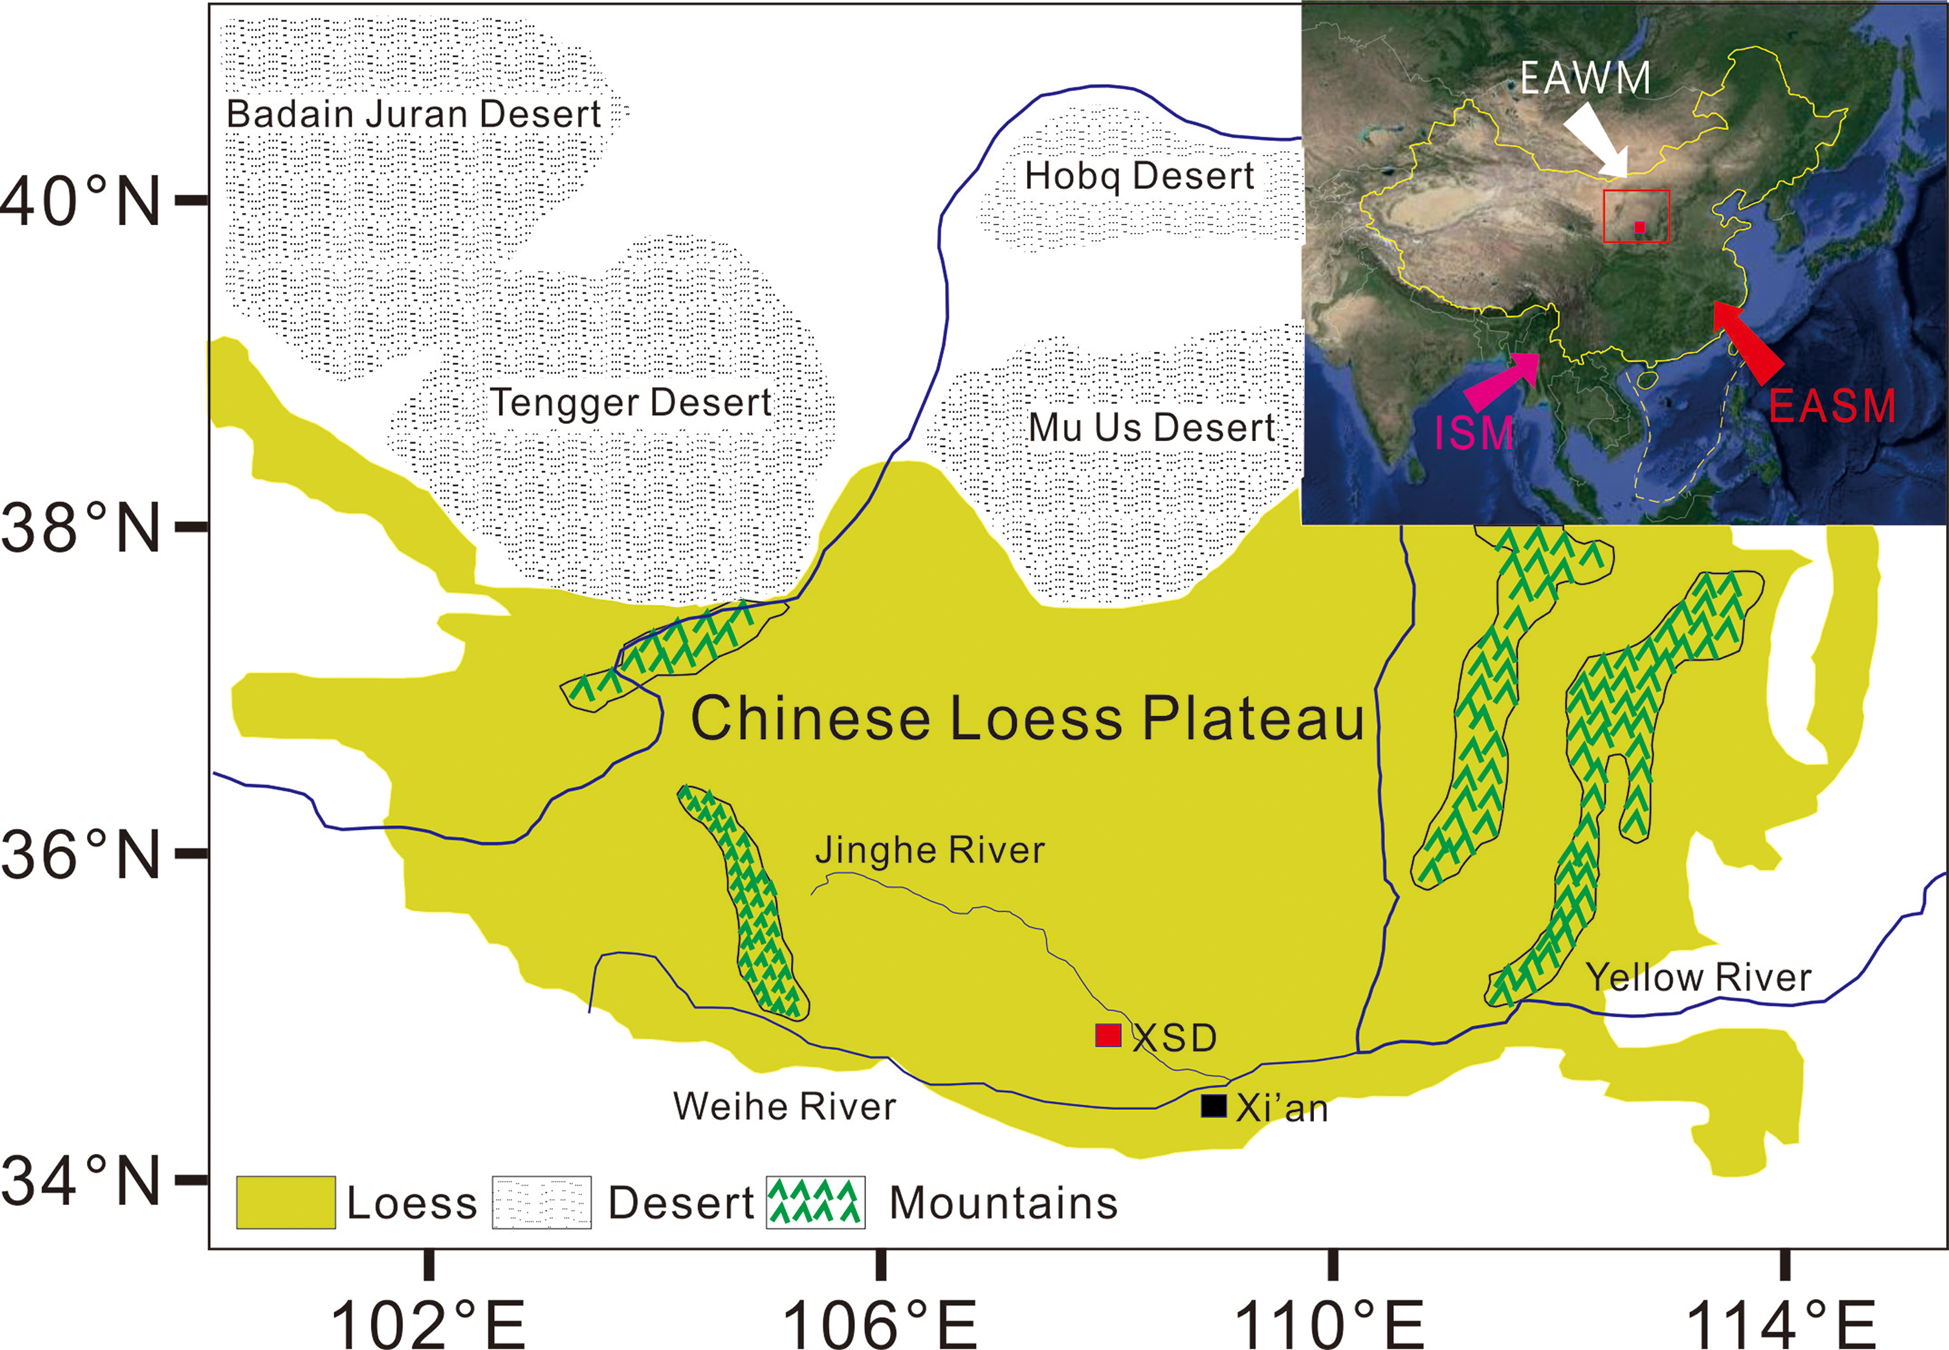
Figure 1 The location of the Loess Plateau and studied sections. Abbreviations: EAWM = East Asian winter monsoon; EASM = East Asian summer monsoon; ISM = Indian Ocean summer monsoon.
The XSD Quaternary loess–palaeosol sequences are well-deposited, with a sedimentary thickness of approximately 57 m. According to field observations, the fifth Malan loess (L5) and the palaeosol (S5) are well-preserved, with a depositary depth of about 11 m and no observed remarkable sedimentary discontinuities (Fig. 2). From top to bottom, the colour in L5 changed as follows: dark yellowish brown (YR-20-10YR4/4), yellowish brown (YR-20-10YR5/4), light yellowish brown (YR-20-10YR6/4), yellowish brown (YR-20-10YR5/4), and dark yellowish brown (YR-20-10YR4/4). L5 has loose soil, with a dry density of 1.72–1.77 g m−3 and a moisture content of 4–16 %. It also has a baum pot and snail shells with a few grey-brown spots and a small number of calcareous nodules at the top. The physical and chemical properties of the underlying palaeosol (S5) formed in the same climate cycle are different in all aspects from those of L5, with a dry density and moisture content that are slightly higher than those of L5. The thickness of S5, as the most noticeable marker bed in the loess, reaches 4 m, and its colour changed as follows (from top to bottom): yellowish brown (YR-20-10YR5/4), brown (YR-17-7.5YR4/4), yellowish brown (YR-20-10YR5/4), and brown (YR-17-7.5YR4/4). This colour change shows the strength of the pedogenesis. As seen in Figure 3, S5 can be divided into three layers. The figure also shows the typical yellow-brown soil found in northern subtropical forests. From top to bottom, the first layer is the clarification layer (Bts), which has many baum pots and a grain size of 5–13 mm, is densely distributed, and contains many iron–manganese cutans, indicating that this layer was formed under high temperatures and precipitation, and was subjected to strong clarification. The second layer is the weathering-leaching layer (Cs), which has a denser distribution of baum pot. Because this distribution is star-like, it is often referred to as ‘reticular baum pot,’ and has a grain size of 1–2 cm. Compared to L5, its soil is harder (given its dense structure) and deposited like a prism block. The third layer is the calcium carbonate (CaCO3) nodule sedimentary layer (Ck). Compared to Cs, the content of baum pot significantly increases, which further indicates that Bts was deposited under a humid climate and was subject to a strong leaching effect.
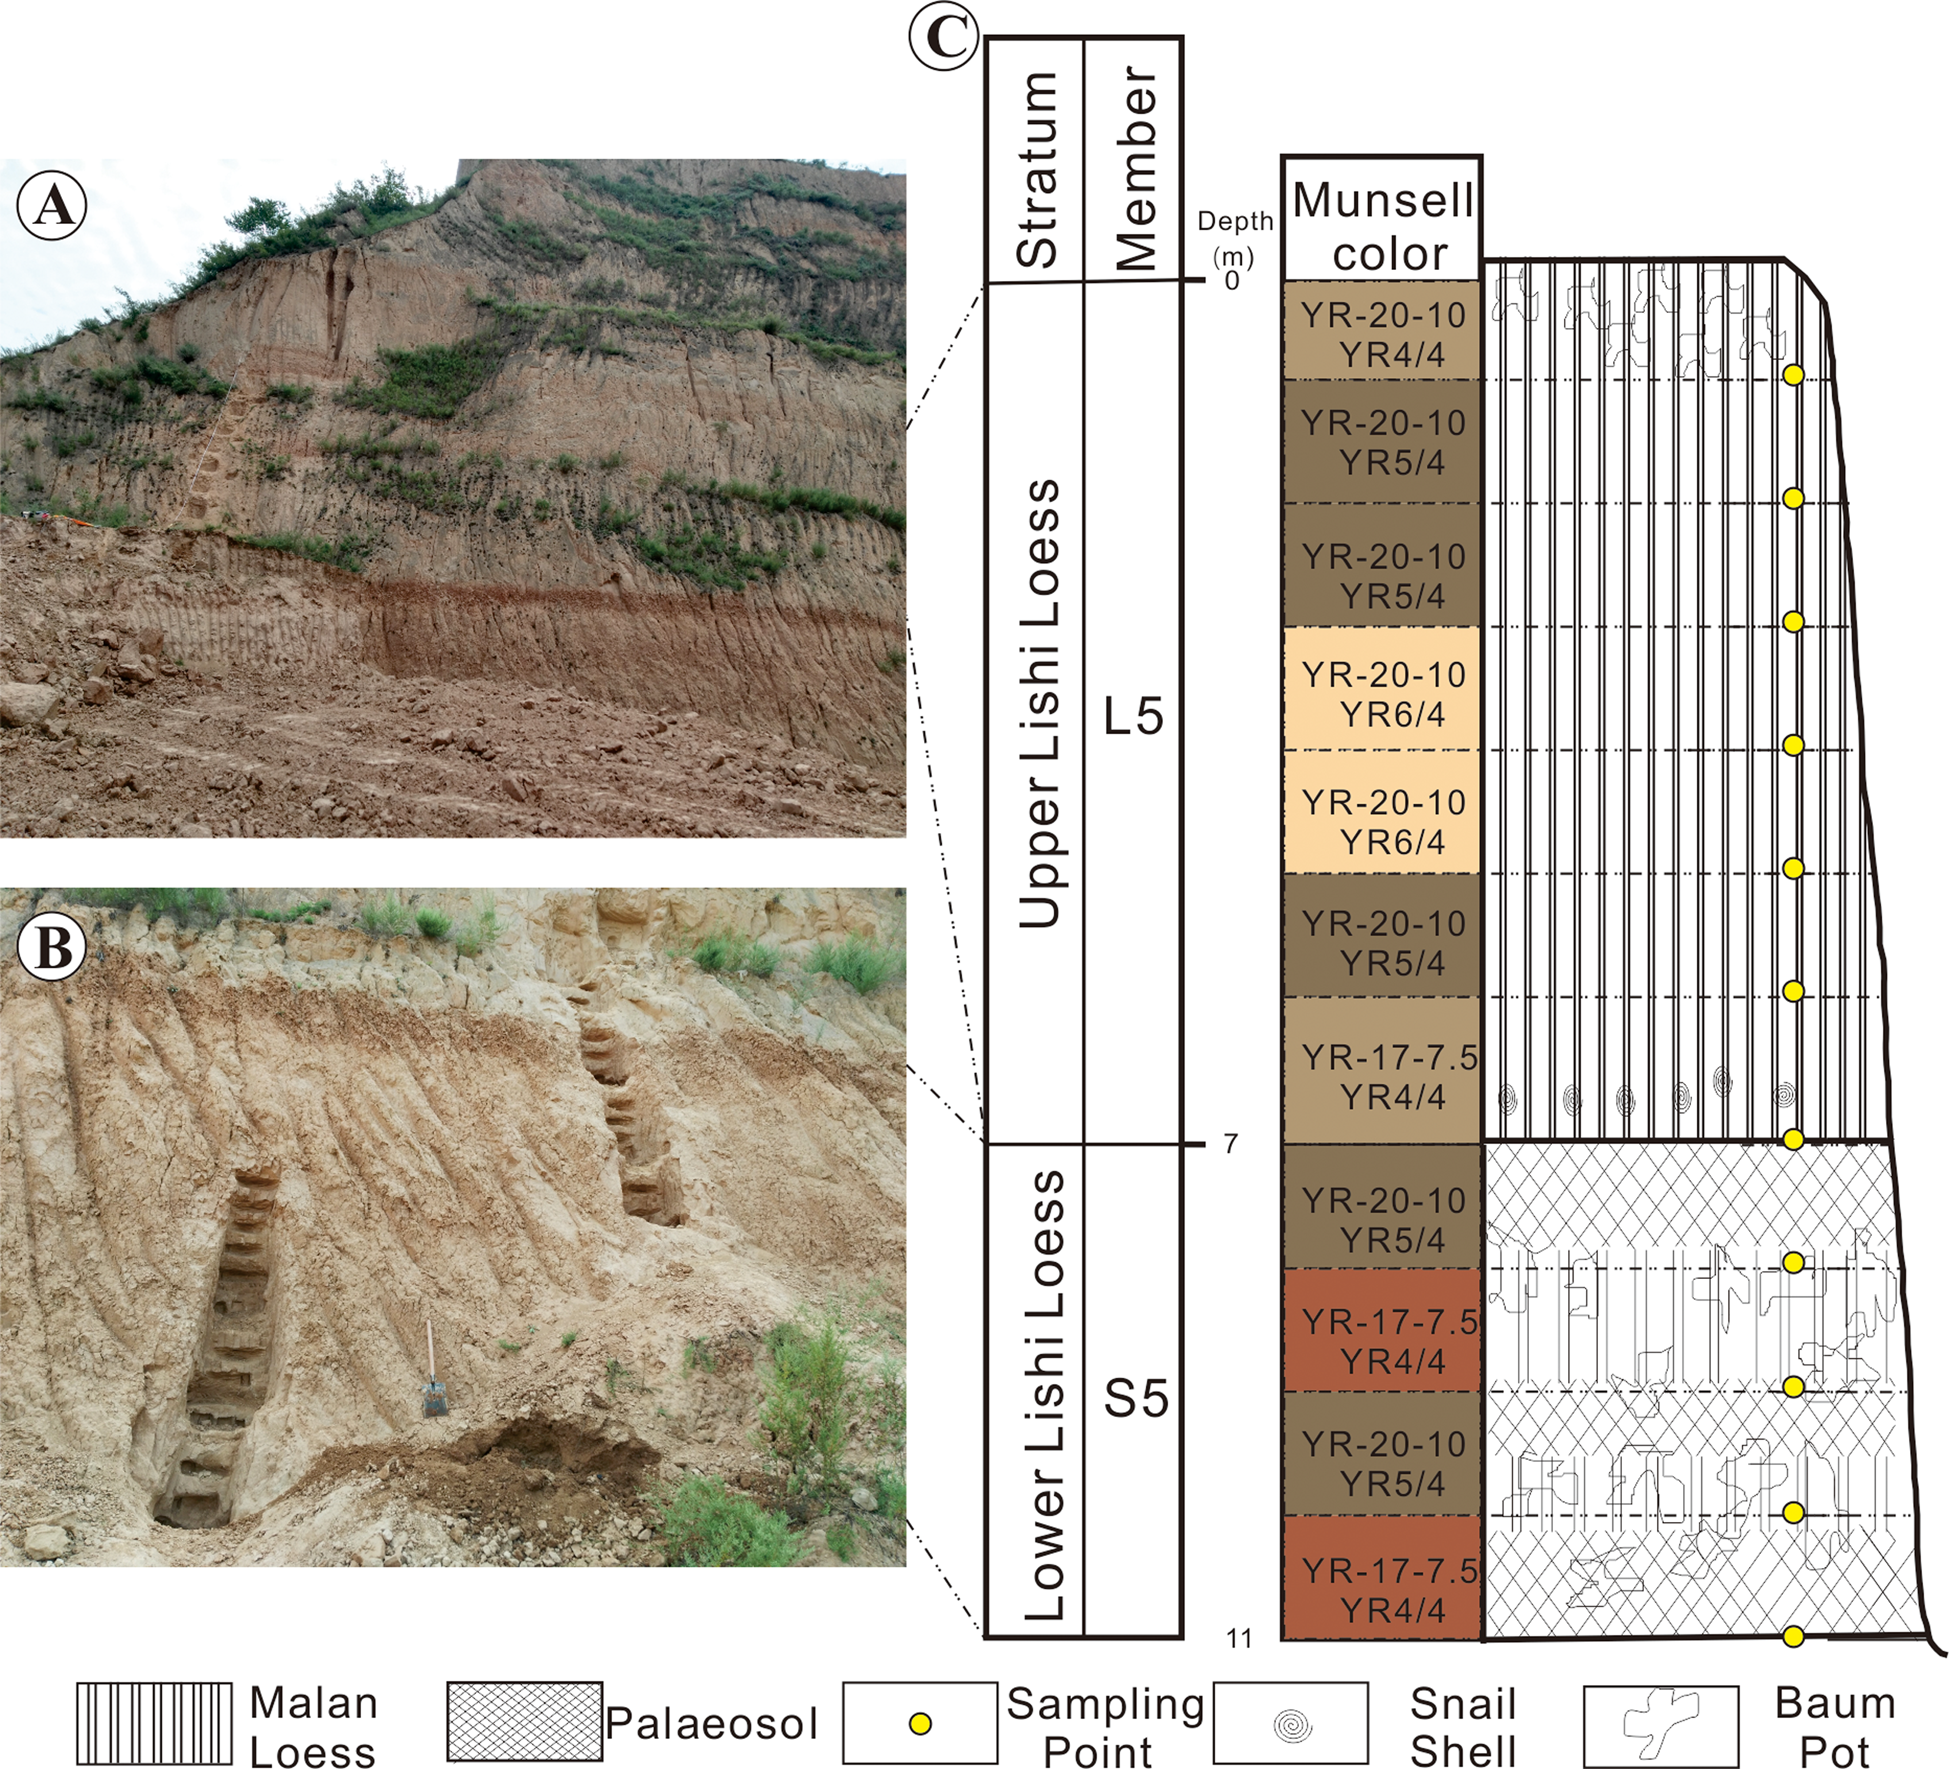
Figure 2 Field photos of the XSD profile: (A) L5, and (B) S5. (C) Framework of the XSD section.

Figure 3 Subdivision of a section of the S5 palaeosol at the XSD. Abbreviations: Bts = argillic horizon; Cs = leached loess with thin red argillans; Ck = illuvial layer of CaCO3.
2. Sampling and analytical methods
2.1. Sampling
Three trench sampling areas were provided in different layers of the XSD profile through the field survey located in the Loess Plateau slope: L5 (7 m), S5−1 (1 m), and S5−2,3 (3 m). To ensure that the samples taken from the field were closer to their state during the sedimentary period to the extent possible, the weathered topsoil from 1–2 m inside the slope was removed before the trenches were dug downward from the top of the respective layers. Loose soil samples weighing 1.5 kg each were acquired from each trench at 10 cm intervals and analysed for magnetic susceptibility, grain size, moisture content, and specific gravity. At each sampling point, three vertical and three horizontal samples were collected by cutting rings with heights and diameters of 40 and 61.8 mm, respectively, for a total of 66 samples. The dry density of each sample was recorded on site and numbered according to the strata sequence.
2.2. Dry density determination
Prior to sampling, each cutting ring was weighed as m0, accurate to 0.01 g. After the preparation of the field permeation sample, the soil-loaded cutting ring was reweighed as m1, accurate to 0.01 g. The dimensions of the cutting ring were 61.8 mm (inner diameter) and 40 mm (height), resulting in an inside volume, V, of 120 cm3 and a dry density soil sample of:
 $$\rho _d = \displaystyle{{m_1-m_0} \over V}$$
2.3. Indoor penetration test
The permeation samples were brought to the laboratory where their saturated soil hydraulic conductivity coefficients were measured. A water supply tank, piezometric tube, and permeameter related to rubber hoses. The tank was filled with water after all connections were found to have no water or gas leakages. Then, Vaseline was applied on the inner walls of the TST-55 Permeameter, and field samples were placed into the designated permeameter in numbered order. The permeameter was tightened according to specifications to ensure they did not overflow. A stepwise lifting method was employed to ensure that the samples were fully saturated. A constant head permeability test was carried out until the samples were fully saturated. The hydraulic gradient (I) for the constant head permeability test was: 0.1, 0.2, 0.3, 0.4, 0.5, 0.6, 0.7, 0.8, 0.9, 1, 1.5, 2, 2.5, 3, 3.5, 4, 4.5, 5, 6, 7, 8, 9, and 10, for a total of 23 hydraulic gradients. After the head reached the corresponding water level, the piezometric tube head was observed for stability, which should be no less than 30 min from the starting time. The water was held with a graduated cylinder, and when the amount of water seeping out was 2/3 greater than the graduated cylinder level, the graduated cylinder was removed, the corresponding time was recorded, the mass of water was weighed with an electronic scale, and the water temperature of the tank was measured. Afterward, five groups of constant head permeability tests were performed, and the corresponding height needed to reach the required hydraulic gradient was raised until either 23 hydraulic gradients were recorded or the soil samples were damaged. The amount of water that seeped out during each hydraulic gradient was read only after the piezometer tube was stabilised to ensure that the test was conducted under constant head.
 $$k_{20} = k_T\displaystyle{{\eta _T} \over {\eta _{20}}}$$
Permeability, k 20 (cm s−1), was calculated for samples at a standard temperature, where: η T is the coefficient of water dynamic viscosity (kPa⋅s) at T °C; and η 20 is the coefficient of water dynamic viscosity (kPa⋅s) at 20 °C.
2.4. Determining the specific gravity of the soil sample
The specific gravity of the soil samples was determined using the pycnometer test method with reference to the Standard for Soil Test Method (GB/T50123-1999). Loose soil was obtained from field permeation sampling points, brought back to the laboratory, placed in an oven, and dried to a constant weight at a constant temperature of 105–110 °C. Given that a 50 ml pycnometer was used, approximately 10 g of the dried samples were weighed and transferred into the pycnometer. The total mass of the samples and the pycnometer were accurately weighed to 0.001 g, then approximately half of the pycnometer was filled with kerosene. The pycnometer was then shaken and evacuated using the vacuum extraction method for no less than one hour. After the vacuum extraction was completed, the pycnometer was filled with the suspension. Given that the pycnometer had a narrow neck, it was filled with kerosene and corked. The excess kerosene overflowed from the capillary. The pycnometer was kept still until the supernatant became clear; then, kerosene was removed from the outer walls and the total mass of the pycnometer, water, and samples were weighed, accurate to 0.001 g. The specific weight of the soil grains (Gs) can be calculated as:
 $$G_s = \displaystyle{{m_d} \over {m_{bw} + m_d-m_{bws}}}\cdot G_{{\rm kerosene}}$$
where m bw is the total mass of the pycnometer and kerosene (g) and m bws is the total mass of the pycnometer, kerosene, and samples (g).
2.5. Porosity calculation
The porosity of permeation samples (F) was calculated according to the measured specific weight and dry weight of soil samples:
 $$F = 1-\displaystyle{{\rho _d} \over {G_s}}$$
2.6. Magnetic susceptibility measurement
As opposed to the two previous samples, the loose soil samples tested for magnetisability and particle size were dense. A total of 55 samples were taken at an average interval of 20 cm from top to bottom. The collected loose soil samples were dried under natural indoor conditions. After air drying at a constant temperature for 48 h, approximately 10 g of the samples were ground into powder and placed into plastic bags. The samples were preheated at low frequency for 30 min (χ lf) (0.47 kHz). Then, the exact quantity was weighed, and a Magnetic Susceptibility Model-942 magnetic susceptibility meter (made in China) was used to take measurements. Before measurement, the instrument was placed away from the magnetic field.
2.7. Grain-size analysis
For the particle size analysis test, a Mastersizer 2000 laser particle size analyser (Malvern, UK) was used, which has a range of 0.02–2000 μm and a repeat test error of less than 1 %. Samples were treated with hydrochloric acid and hydrogen peroxide before testing to remove carbonate, organic matter, and iron oxide. Dispersant was added to the treated samples, which were then subjected to ultrasonic shaking for five minutes.
3. Results
3.1. Basic physical properties of loess
The measurement results for the basic physical properties of the XSD profile are shown in Figure 4. During the evolution from L5 to S5, the dry density gradually increased with stratum depth. Similar to variations in dry density, the specific weight of grains tended to increase but had greater variability. By contrast, the porosity values of the permeation samples gradually decreased with stratum depth. Porosity was calculated with the results of dry density and specific weight of the soil grains. For L5, the mean porosity value was 31.58 %, with a range of 28.56–35.01 %. In general, the porosity of L5 was approximately 5 % higher than that of S5, indicating that the L5 aquifer should, theoretically, be more well-deposited than that of S5.

Figure 4 The moisture content, dry density, specific gravity, and porosity from L5–S5 of a loess section in the XSD.
3.2. Penetration test results
According to the results of the indoor constant head permeation test, the permeability for L5−1, L5−2, and L5−3 (depths of 1, 2, and 3 m from the original surface of the fifth Malan loess) decreased horizontally and vertically as I increased. When I < 4, the permeability was greater. After I > 4, the permeability stabilised.
In contrast to the above, when I ≤ 2, the permeability for L5−4 (depth of 4 m from the original surface of the fifth Malan loess) gradually decreased as I increased. When I ranged from 2–4, permeability stabilised, but after 4, it increased (Fig. 5; L5−4).

Figure 5 The permeability coefficient varied with the hydraulic gradient from L5−1 to L5−7 in the XSD.
The permeability for L5−5 (depth of 5 m from the original surface of the fifth Malan loess) was different from all the above points. Both horizontal and vertical permeability were stable as I varied, although it generally increased (Fig. 5; L5−5).
The horizonal and vertical permeability for L5−6 and L5−7 (depths of 6 and 7 m from the original surface of the fifth Malan loess) had high variability and followed no noticeable trend as I increased (Fig. 5; L5−6, L5−7).
The horizonal and vertical permeability of S5−1 and S5−2 (depths of 8 and 9 m from the original surface of the fifth Malan loess) were like that of the overlying loess, and were highly volatile as I increased. However, in general, they were significantly smaller than that of the overlying loess (Fig. 6; S5−1, S5−2).

Figure 6 The permeability coefficient varied with the hydraulic gradient from S5−1 to S5−4 in the XSD.
The vertical and horizontal permeability for S5−3 in the middle of the fifth palaeosol (depth of 1 m from the original surface of the fifth Malan loess) and S5−4 in the lower part of the fifth palaeosol (depth of 11 m from the original surface of the fifth Malan loess) had the same relationship with I as the upper part of L5.The permeability gradually decreased as I increased. The difference was that the permeability at the test points in the lower middle part of S5 was significantly less than that in the Malan loess. When I = 4, S5−3 was readily stable, but it was not until I = 6 that S5−4 became stable (Fig. 6; S5−3, S5−4).
These results were analysed statistically to examine the stability of the permeability across the loess–palaeosol sequence, which changed with the hydraulic gradient during the permeability test and the average permeability (Fig. 7). This finding suggested that the vertical and horizontal equivalent permeability for the entire fifth loess–palaeosol sequence were 0.0067 and 0.075 m d−1, respectively. Nearly all layers with permeability less than this average value were in S5. Only the average vertical permeability in L5−7 was abnormal according to the analysis of the coefficient values of permeability, which changed as the hydraulic gradient increased. In this analysis, when the coefficient of variation was less than 17, this relationship was relatively stable (Wang et al. Reference Wang, Sun Q, Zhang, Qiang and Liu2018). Over 70 % of the test points in L5 had large variability coefficients of permeability, and maximum values appeared in the transition zone between L5 and S5, while only part of the middle of L5 (vertical direction) and S5 (horizonal direction) had smaller variability.

Figure 7 Permeability coefficient variability analysis.
In summary, the permeability under the initial hydraulic gradient was regarded as the initial permeability. The representative data for the initial permeability (A), the pre-stabilising permeability (B), and the post-stabilising permeability (C) are listed in Table 1.
Table 1 Permeability coefficients of L5–S5 in a Loess section of the XSD.

Table 1 illustrates that A, B, and C first increased then decreased as the profile depth increased in both the vertical and horizontal directions of the fifth loess–palaeosol sequence. Maximum values appeared in L5−4 at three points. Below L5−6, the stratum permeability plummeted. A responded to the depth of stratum, and decreased from 0.33 to 0.001 m d−1 in the vertical direction, while in the horizontal direction, A decreased from 0.19033 to 0.0010.33 m d−1.
3.3. Measurement of susceptibility and particle size results
As seen in Figure 8, L5 and S5 were significantly different in magnetic susceptibility. The magnetic susceptibility of L5 changed more moderately than that of S5. An abrupt change point appeared at the bottom of L5 and went deep into S5 along the stratum. The magnetic susceptibility gradually increased, and periodic minimum values appeared at S5−2. The mass susceptibility of L5 ranged from 4.55 to 11.23 SI, whereas that of S5 ranged from 8.35 to 21.76 SI. The magnetic susceptibility measurements showed that the effect of weathering and soiling on L5 was weaker than that on S5, which provides a basis for identifying the relationships between the water-chemical properties of L5 and S5, differences in physical properties, and climate change.

Figure 8 Susceptibility and grain-size curve from L5–S5 of a loess section of the XSD.
For grain size, as shown in Figure 9, as the stratum went deeper, the grain-size distribution of L5 and S5 showed significance differences. In L5, the average content of clay, fine-silty sand, coarse silt, and microsand were 23.87 %, 19.08 %, 55.46 %, and 1.58 %, respectively, while their ranges were 14.91–35.31 %, 15.19–24.49 %, 40.05–65.96 %, and 0.18–3.93 %, respectively. In S5, the average contents of clay, fine-silty sand, coarse silt, and microsand were 31.97 %, 22.50 %, 44.99 %, and 0.52 %, respectively, while their ranges were 21.80–40.43 %, 18.57–28.17 %, 35.36–57.32 %, and 0.19–1.71 %, respectively.

Figure 9 Grain-size distribution and cumulative grain-size distribution curves for L5 and S5 of a loess section of the XSD. (A) Probability cumulative grain-size distribution curves and (B) probability grain-size distribution curves.
When L5 and S5 were compared, the content of clay and fine-silty sand in L5 was 12 % lower than that in S5, whereas the content of coarse silt and microsand in L5 was 12 % higher than that in S5. Some research used the ratio of percentage content of grains that are smaller than 2 μm and greater than 10 μm as an alternative index for measuring changes in climate (Lu et al. Reference Lu, Fang, Lu, Han, Yang, Li and An2004; Fu et al. Reference Fu, Bian, Xi and Zhao2018). The magnetic susceptibility curves were compared to identify their correlation, which, in turn, further demonstrated the influence of climate change on grain-size composition. While not the only factor, climate may have caused different physical and hydraulic properties in L5 and S5.
4. Discussion
4.1. Differences in permeability between the loess and palaeosol
From the results of the indoor penetration test, the relationship between the permeability of L5 and S5 and the hydraulic gradient showed contrasting characteristics as stratum depth changed. These characteristics can be divided by different strata. As the hydraulic gradient increased, the permeability either: (1) tended to decrease and become stable; (2) decreased until it reached a stable value, then tended to increase; (3) tended to increase in a stable manner; or (4) had no obvious relationship or showed inconsistent characteristics in the horizontal and vertical permeability.
Condition 1 appeared in the upper part of L5 (L5−1, L5−2, L5−3, L5−6) and in the lower part of S5 (S5−3, S5−4) (Fig. 10a). This result can be explained by the fact that as the hydraulic gradient increased, fine grains that had been homogeneously distributed in the sample migrated in the direction of seepage, which, in turn, made the void ratio of the sample increasingly heterogeneous. According to the average permeability of the vertical heterogeneous interface flow, the permeability for the whole sample was determined by the single-layer minimum permeability plane. Thus, during this permeability test, the permeability gradually decreased as the hydraulic gradient increased within a certain range. Further, the upper part of L5 and the lower part of S5 were at the end of the glacial period or at the outset of the interglacial period and were, therefore, subject to local deposition and climate, particularly at the initial point during which the East Asian summer monsoon (EASM) surged (Zeede et al. Reference Zeede, Hambach, Veres, Fitzsimmons, Obreht, Bösken and Lehmkuhl2017). During this period, the desert in the Loess Plateau retreated to the NW and the dust grain size became smaller. In this case, fine grains were gradually deposited in the upper part of L5 and the lower part of S5 (Guo et al. Reference Guo, Biscaye, Wei, Chen, Peng and Liu2000; Dalai et al. Reference Dalai, Krishnaswami and Sarin2002; Zhao et al. Reference Zhao, Cao, Shao, Liu, Yue and Du2012a). Moreover, the direction of seepage was the same as that of deposition. Thus, during this permeability test and under a higher hydraulic gradient, the permeability in the upper part of L5 and in the lower part of S5 gradually became stable.

Figure 10 (A) Simulation diagrams of the loess samples during the long-term penetration test; (B) comparison of samples (a) before and (b) after infiltration; (C) comparison of (a) palaeosol and (b) loess.
Condition 2 appeared in L5−4. When the hydraulic gradient was I ≤ 4, L5−4 showed characteristics consistent with Condition 1. However, the permeability tended to increase as the hydraulic gradient increased. Magnetic susceptibility and grain-size analysis indicated that this layer was deposited under a dry-cold climate and was located near the centre of the entire L5 layer (Reyaz et al. Reference Reyaz, Rakesh, Shakil and Nazia2015). This finding implied that L5−4 was nearly surrounded by the East Asian winter monsoon (EAWM) effect during the sedimentary period. Consequently, the weathering and pedogenesis was too weak to form a macroporous support structure. When sample images were compared before and after permeation, along with the subsequent activity of insects in the soil layer, some soluble substances were filled in. Therefore, when the hydraulic gradient was higher (I > 4), the fill substances were flushed off, and permeability increased with the hydraulic gradient (Fig. 10b).
Condition 3 appeared in L5−5, with variability similar to that observed in Condition 2 under a higher hydraulic gradient. The table clearly shows that the initial permeability in L5−5 was very close to that in L5−4 when it was stabilising, and L5−5 was deposited before L5−4. Judging from the magnetic susceptibility data, during the transition period from L5−5 to L5−4, the intensity of the EAWM gradually weakened, thus reducing the content of large grains that controlled the pore size. Therefore, under the same hydraulic gradient, L5−5 stabilised before L5−4, and L5−5 may be treated as a special condition of L5−4 in which it is under a larger hydraulic gradient. Soil formation involves weathering of the parent material and transformations and translocations of what is within the material, which results in changes of particle size. While the intensity of the winter monsoon has an impact on soil formation, it is not the only factor.
Condition 4 appeared in the lower part of L5 and in the upper part of S5. In terms of the position of deposition, these sampling points were in the transition zone from the palaeosol to the loess and had similar sedimentary characteristics. The intensity of the EASM gradually weakened, whereas that of the EAWM began to strengthen (Wang Reference Wang2005; Zhang et al. Reference Zhang, Jin and Li2013). As suggested in Figure 7, the intensity of the EASM not only weakened but also tended to fluctuate, which resulted in a heterogeneous material structure in the depositary layer. Further, the soil leaching effect caused a sharp contrast in permeability between the bottom and lower part of L5 and the sedimentary layer above it.
The permeation process in the samples was not solely influenced by the climate (Jiang et al. Reference Jiang, Guo, Cai, Thompson, Xu and Zhong2016; Yang et al. Reference Yang, Qiao, Uchimura, Wang, Lei and Huang2017). According to the analysis of variability, the stable permeability of S5 was not only poorer, it was also relatively stable as the hydraulic gradient increased, especially in the vertical direction. However, L5 showed the opposite characteristics, with the condition appearing at the bottom of L5, in which the permeability was unstable as the hydraulic gradient changed. To further examine the causes of these differences, samples were obtained from the permeameter after the completion of the permeability test (Fig. 10c), and visible wormholes and fissures had appeared after the completion of the permeability test on L5. This finding indicated that the biological effects of the soil are also an important factor influencing its permeability. Given that biological effects are not cyclical like the Quaternary climate, the relationship between the palaeosol and the loess in terms of permeability and hydraulic gradient becomes increasingly unstable.
In summary, the permeability of the fifth loess–palaeosol sequence was correlated to the climate. Climatic changes were accompanied with different materials, structures, and grain-size compositions, which, in turn, caused contrasting permeability characteristics under different hydraulic gradients. In addition, there was an uncertain biological effect from the soil immediately followed by unstable permeability, which changed with the hydraulic gradient during the permeation process. In this sense, the permeability differences in the loess–palaeosol sequence can be used as a reference index for changes in the climate and the biological environment.
4.2. Influence of material structure characteristics of the stratum on permeability
Previous studies on loess–palaeosol sequences have suggested that the grain-size composition can be used as an alternative index for indicating changes in climate and the intensity of weathering and pedogenesis (Guo et al. Reference Guo, Biscaye, Wei, Chen, Peng and Liu2000; Singh et al. Reference Singh, Mondal, Kumar, Singh, Tewary and Amalendu2008; Liu et al. Reference Liu2015). As described earlier, finer-grain components migrated along the direction of seepage during the permeation process, which resulted in changes in the coefficient of permeation. In addition, the grain-size composition also had a great influence on the stability of the permeability of the loess–palaeosol sequence.
As shown in Table 1 and Figure 9, during the evolution process from L5 to S5, the ratio of grains that were smaller than 2 μm and greater than 10 μm were regarded as the result of index analysis, which tended to increase. The content of clay and fine-silty sand gradually decreased, as did the stable permeability in each layer of the study profile. This observation can be attributed to the fact that as fine-grain content increases, it often results in smaller pore sizes in the sedimentary layer, lower porosity, higher dry density (Fig. 4), and weaker connectivity of pores, which, in turn, cause the stable permeability to decrease. Compared to S5, there were coarser grains in L5, ensuring that L5 had higher porosity, larger pore size, and better connectivity between effective pores, which, in turn, caused the stable permeability to increase.
Similarly, given that the moisture in the loess–palaeosol sequence mainly existed in the form of film water, the content of clay and fine-silty sand was higher in S5 (Fig. 4) and the stratum had a stronger absorption (Xu & Zhao Reference Xu and Zhao2002; Fu et al. Reference Fu, Bian, Xi and Zhao2018; Chen et al. Reference Chen, Huo, Qian and Li2020a, Reference Chen, Qian, Hou, Zhang and Zhangb), which reduced the stable permeability during the permeation process. Compared to S5, the content of clay and fine-silty sand in L5 was lower, but the content of coarse silt and microsand was higher, the soil absorption was weaker, and the moisture content was lower, which, in turn, caused the stable permeability to be greater than that of S5.
This analysis showed that the grain-size composition of the soil largely determines the physical and hydraulic properties of the loess–palaeosol sequence, which, in turn, influences permeability.
4.3. Differences in aquifers of the loess–palaeosol sequence as a result of climate change
According to field observations, almost no CaCO3 nodules were found in L5 and the magnetic susceptibility curve was relatively flat, which indicated that L5 was deposited under a climate with less precipitation and pedogenesis. In S5, there were more CaCO3 nodules and the magnetic susceptibility curve often formed prominent peaks, indicating that S5 was deposited under a climate with abundant precipitation and a stronger leaching effect (Wang Reference Wang2005; Zhao et al. Reference Zhao, Ma, Luo, Yue, Shao and Dong2017).
Chemical weathering is often done via water; thus, it is almost impossible to observe under a dry environment (Zhao et al. Reference Zhao, Long, Wang and Zhang2012b). Therefore, S5 deposited during the humid-warm interglacial period showed a stronger leaching effect, contained more enriched ferromagnetic minerals, and had a higher magnetic susceptibility (Huang et al. Reference Huang, Pang, Su, Li and Ge2009). However, the weathering effect in the loess was weaker under the dry-cold climate, causing lower magnetic susceptibility (Zhao et al. Reference Zhao, Ma, Cao, Wei and Shao2015). According to the comparison between the porosity curve and the magnetic susceptibility curve, L5 had a lower magnetic susceptibility value and a higher porosity, whereas S5 had a higher magnetic susceptibility value and a lower porosity. Differences in porosity between L5 and S5 may have been primarily caused by the dominant climate at the time of deposition. The surface the difference between these things types of loess, cementing the grains around the pores that were built when windblown dust fell down and fixed them in a very loose structure. In this way, overhead large pores can be easily formed in the loess. After being compressed by the overlying stratum, the palaeosol grains with more clay were filled with clay, leaving some small pores between them (Fang et al. Reference Fang, Hong, Zhao, Furnes, Lu, Han, Liu, Jia, Wang, Yin and Algeo2017).
The pores in loess soil were mainly formed during their formation. The intensity of pedogenesis is directly correlated to the climate. During the sedimentary period of the loess under a relatively dry-cold climate, the clarification was weaker, and there were no cements between deposited grains, resulting in the development of an aquifer between the grains. During the formation of the palaeosol, the climate was relatively humid-warm, as the EASM in the SE direction was enhanced and the desert in the Loess Plateau retreated to the NW, making the dust grains increasingly fine. The combined effects of high temperature, high precipitation, and fine grains resulted in strengthened clarification in the palaeosol, mutually cemented grains, and reduced porosity, which, in turn, enhanced its water-resistant properties. The experimental results showed that although the porosity of S5 was lower than that of L5, it was still high. In this sense, the water-resistant properties of the palaeosol were only relative to that of loess, and may still become permeable under certain conditions.
In summary, the differences in aquifer properties between the loess–palaeosol sequence result from the cyclic impacts between EASM and EAWM.
5. Conclusions
(1) In the loess–palaeosol sequence of the XSD profile, as the hydraulic gradient increased, different experimental points showed inconsistent characteristics due to environmental differences during the deposition period. However, the strata, subject to similar monsoon effects, shared certain similarities.
(2) Subject to the dominant effect of the alternating cycles of the EASM and EAWM, the differences in grain-size composition between the loess–palaeosol sequence under the sedimentary environment was the primary cause for the different values of stable permeability in different stratum. Moreover, the stable permeability of the loess, which is mainly composed of coarse grains, was significantly higher than that of the palaeosol, which is mainly composed of fine grains.
(3) The aquifer in the loess was more deposited than that in the palaeosol as it is closely associated with the alternating cycles of dry-cold and humid-warm climates during the Quaternary period. The loess formed during the dry-cold glacial period showed a weak soling effect. The deposited grains, which were relatively coarse, formed large pores with stronger permeability and larger aquifer, which was conducive to recharge.


