

As the connection between the biotic and abiotic environment, vegetation plays an important role in the functions of terrestrial ecosystems (Peng et al. Reference Peng, Liu, Liu, Wu and Han2012; Jiang et al. Reference Jiang, Yuan, Wang, Cao, Zhang and Shen2015). Vegetation change can influence multiple ecosystem functions, including carbon cycling, hydrology and surface energy exchange (Xiao Reference Xiao2014). Vegetation cover is sensitive to environmental change, which makes it an appropriate indicator for determining ecological status (Xin et al. Reference Xin, Xu and Zheng2008; Dubovyk et al. Reference Dubovyk, Landmann, Erasmus, Tewes and Schellberg2015; Han et al. Reference Han, Park and Yeom2015). In arid and semi-arid regions, ecological restoration has been conducted to increase vegetation cover, which is an effective way to increase rainfall interception, regulate climate and control soil erosion. The effect of climate should also be considered. Vegetation change is complex and dynamic, both spatially and temporally (Dai et al. Reference Dai, Zhang, Wang, Wang, Guo, Wang and Li2011). However, previous studies paid more attention to the spatial pattern rather than the temporal process of vegetation change, and tended to examine the spatial distribution of vegetation change at a given time (Zhou et al. Reference Zhou, Gang, Zhou, Chen, Li, Ju and Odeh2014; Potter Reference Potter2015; Zhang et al. Reference Zhang, Wang and Ge2015). Few researchers considered temporal trends in vegetation change, which led to an incomplete understanding of vegetation change and the interaction between vegetation change and influencing factors.
With the application of remote sensing, which has advantages in terms of broad spatial coverage, high spatial or temporal resolution, it becomes possible to monitor vegetation change at large spatial scales over long time periods (Weiss et al. Reference Weiss, Gutzler, Coonrod and Dahm2004; Lu et al. Reference Lu, Kuenzer, Wang, Guo and Li2015; Tewes et al. Reference Tewes, Thonfeld, Schmidt, Oomen, Zhu, Dubovyk, Menz and Schellberg2015). The Normalized Difference Vegetation Index (NDVI) has been shown to be closely associated with the growth status of vegetation and is widely used in vegetation monitoring and analyses (Bao et al. Reference Bao, Bao, Sanjjava, Qin, Zhou and Xu2015; Li et al. Reference Li, Yang, Liu, Liu and Shi2015; Vandandorj et al. Reference Vandandorj, Gantsetseg and Boldgiv2015; Otto et al. Reference Otto, Hoepfner, Curio, Maussion and Scherer2016). However, NDVI values are affected by the uncertainty generated by the spectral characteristics of soil components (van Leeuwen et al. Reference van Leeuwen, Orr, Marsh and Herrmann2006). To tackle this problem, the fractional vegetation cover (FVC) has been introduced and is widely applied as an index to represent the status and function of surface vegetation (Rundquist Reference Rundquist2002; Zhou et al. Reference Zhou, Shangguan and Zhao2006; Wu et al. Reference Wu, Wu, Zhao, Zhou, Tang, Zhao and Jia2014).
The Loess Plateau is a vital component of China's ecological strategic plan, ‘Two Barriers and Three Belts' (Fig. 1), which covers 37% of China's land area and has a great influence on the national ecological security of China. The Loess Plateau is also an agricultural area of high ecological vulnerability. After long-term human settlement and cultivation, the Loess Plateau has become one of the most severely eroded regions in the world due to its loose soil, cultivated steep hill slopes, high rainfall intensity and poor vegetation coverage (Li et al. Reference Li, Liu, Zhang and Zheng2009; Fu et al. Reference Fu, Liu, Lü, He, Zeng and Wu2011; Feng et al. Reference Feng, Sun, Fu, Su, Liu and Lamparski2012). In 1999, the Chinese government launched an ambitious ecological restoration program entitled the ‘Grain to Green Program' (GTGP), designed to mitigate ecological degradation by restoring croplands on steep hill slopes to forests, shrubs or grassland. The Loess Plateau was selected as a pilot and demonstration region for GTGP implementation. After more than one decade, many results have indicated the improvement in vegetation cover and ecosystem services in the GTGP implementation area (Lü et al. Reference Lü, Fu, Feng, Zeng, Liu, Chang, Sun and Wu2012; Xin et al. Reference Xin, Ran and Lu2012; Jiang et al. Reference Jiang, Yuan, Wang, Cao, Zhang and Shen2015). However, there were also concerns regarding the survival rate of planted trees, the status of planted trees and the actual influence of afforestation on soil and water (Chen et al. Reference Chen, Shao and Li2008; Wang et al. Reference Wang, Shao and Shao2010b, Reference Wang, Shao, Zhu and Liu2011). Therefore, there is a need to assess the spatial and temporal variation in vegetation cover since the large-scale implementation of the GTGP.
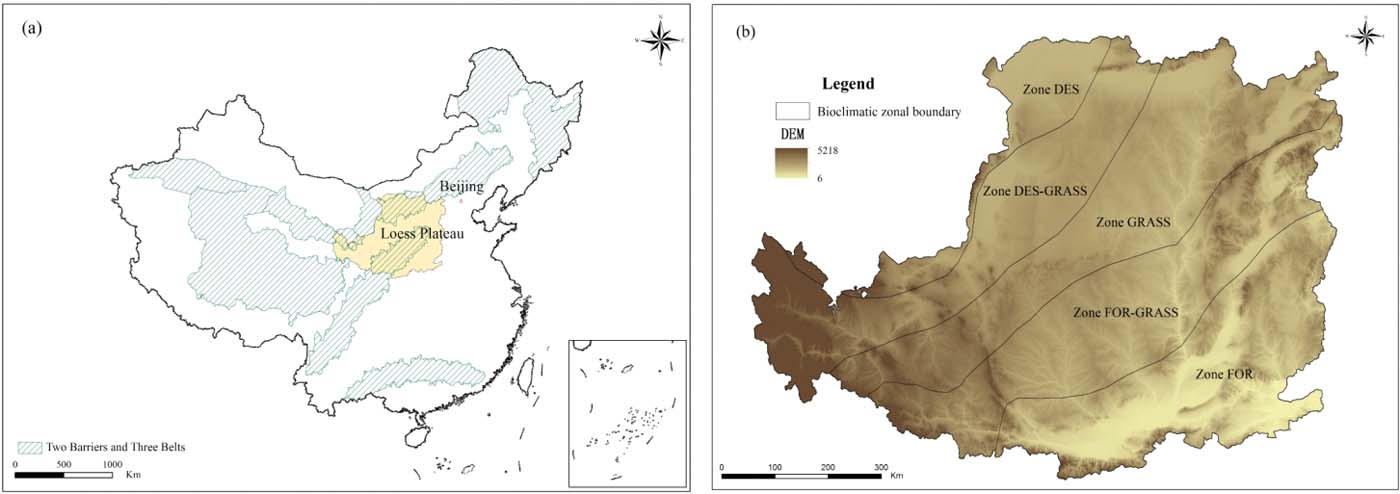
Figure 1 (a) Location of the Loess Plateau in China. (b) Distribution of each bioclimatic zone. Map created using ESRI ARCGIS 10.0.
The objectives of this study are to: (1) identify the spatial distribution patterns of vegetation cover across the Loess Plateau; (2) assess the temporal trends and processes of vegetation cover variation along with restoration age during 2000–2014; and (3) examine the roles of ecological restoration and climate in vegetation change. The results of this study could deepen the understanding of the spatiotemporal effects of current ecological restoration policies on vegetation, inform the maintenance of ecological restoration performance and provide references for future ecological restoration in ecologically vulnerable regions with a dry climate.
1. Methods and materials
1.1. Study area
The Loess Plateau is located in the middle reaches of the Yellow River basin in northern China [100°54′–114°33′E, 33°43′–41°16′N], with an area of approximately 62.6×10⁴ km2 (Fig. 1). The dominant climate is arid and semi-arid. The annual precipitation ranges from 200mm to 800mm, and more than 60% occurs between June and September in the form of intensive rainstorms. The annual average temperature ranges from 6 to 14°C. There are 339 counties in the region, with a population of 108 million (or an average population density of 168personskm–2). The population density combined with a vulnerable natural environment leads to a series of ecological problems, especially soil erosion. The average erosion rate in this region is 5000–10000tkm–2, with the highest being 20,000–30,000tkm–2 (Cai Reference Cai2001). The main source of soil erosion is the area with slopes of 8–35°, which covers more than 45% of the Loess Plateau (Fu et al. Reference Fu, Liu, Lü, He, Zeng and Wu2011).
To minimise ecological degradation and restore disturbed ecosystems, a series of ecological restoration programs have been implemented in the Loess Plateau since the 1980s, such as small-watershed-scale rehabilitation measures with hill slope revegetation and terrace building, as well as check-dam building in the gullies. In 1999 the Chinese government initiated a national ecological restoration program called the GTGP, which was designed to convert the cultivated land on steep hill slopes to perennial vegetation, and the Loess Plateau was selected as a priority region. Furthermore, ecological restoration and conservation programs implemented in recent years, including the Three-North Shelter Forest program, the Natural Forest Protection program, the National Important Ecological Function Area program and the National Key Ecological Function Area program, also regard the Loess Plateau as a key area. The implementation of these large-scale programs has accelerated vegetation restoration and enhanced ecosystem management in the region.
1.2. Data source
The NDVI data were derived from Moderate Resolution Imaging Spectroradiometer (MODIS) images in 2000–2014, with a 250-m spatial resolution and 16-day time interval, which were used to produce FVC data. The land use data of 2000 and 2010 at a 30-m spatial resolution were used to identify pixels of ‘pure' vegetation and ‘pure soil.' The annual meteorological data came from the China Meteorological Data Sharing Service System (http://www.escience.gov.cn/metdata/page/index.html). We choose 50 meteorological stations with complete records from all the meteorological stations across the Loess Plateau. The afforestation data in 2000–2008, which pertained to the increased areas of woodland and grassland driven by the GTGP, was obtained from a study by Lü et al. (Reference Lü, Fu, Feng, Zeng, Liu, Chang, Sun and Wu2012). In this study we divided the Loess Plateau into five bioclimatic zones (Fig. 1b), including FOR (semi-humid forests), FOR-GRASS (semi-humid to semi-arid forest-grassland), GRASS (semi-arid typical grassland), DES-GRASS (arid and semi-arid desert-grassland) and DES (arid deserts), according to the annual precipitation (Feng et al. Reference Feng, Fu, Lü, Zeng and Wu2013).
1.3. Data processing
In this study we used FVC as a comprehensive indicator to analyse vegetation change trends during 2000–2014. The FVC was calculated using the dimidiate pixel model – a simplified linear spectral unmixing method, based on the NDVI data (Ivits et al. Reference Ivits, Cherlet, Sommer and Mehl2013; Imukova et al. Reference Imukova, Ingwersen and Streck2015). This model assumes that a pixel is composed of vegetation and soil, and that vegetation cover can be represented as:
 $$\rm FVC = (NDVI - NDVI_{soil}) / (NDVI_{veg} - NDVI_{soil})$$
where NDVI is the Savitzky–Golay filtered result of MODIS–NDVI. NDVIsoil and NDVIveg are the NDVI values for bare soil and vegetation, respectively. The selection of bare soil and vegetation pixels depended on the land use map of 2010 and field samples. The monthly FVC was calculated by averaging the corresponding FVC in each month. The annual average FVC was calculated using the monthly FVC, which was the average of the corresponding FVC in each month.
Simple linear regression was used to detect any vegetation change trend (Deng et al. Reference Deng, Yang, Zeng, Zhu and Xu2013; Zhang et al. Reference Zhang, Gao, Liu, Wang, Ding and Yang2013). To analyse the trends, we used simple linear regression on the annual average FVC for each pixel. The time scale of the analysis included the periods 2000–2005, 2000–2010 and 2000–2014. The method we used is as follows:
 $$y = a \times t + b + \varepsilon$$
where y is the dependent variable of the annual average FVC, t is the year (t ranges from 2000 to 2014), a is the change rate of the linear trend, b is the intercept of the above equation and ε is the random error. If a>0, the vegetation in the pixel had been subject to restoration. In contrast, the vegetation in a pixel had been subject to degradation if a<0 (P<0.05).
We chose indices of climate and vegetation cover to identify the relationship between them. The climate indices included precipitation, days of precipitation over 10mm, average temperature, maximum temperature and minimum temperature. Then we created a circular buffer with a 20-km radius (i.e., buffer covering approximately 1256.6km2) for each selected meteorological station, and took the average FVC in the circular buffer as the corresponding FVC for the meteorological station. After this step, Pearson's correlation analyses and simple linear regression were conducted between FVC and climate indices.
To examine the effects of restoration on vegetation, we conducted spatial analysis between afforestation and vegetation change using ESRI ARCGIS 10.0.
2. Results
2.1. Spatial pattern of vegetation
We examined the spatial distribution of vegetation in the Loess Plateau based on the average value of FVC over 2000–2014 (Fig. 2). In the Loess Plateau, the proportions of little vegetation cover (FVC<30%), moderate vegetation cover (30%≤FVC≤60%) and high vegetation cover (FVC>60%) were 60.1, 35.7 and 4.2%, respectively. The noteworthy characteristic of the distribution of vegetation cover is the increase from NW to SE. The DES, DES-GRASS and GRASS zones are dominated by little vegetation cover, with average FVCs of 12.0, 16.2 and 18.6%, respectively. The FOR-GRASS zone was the transition region between little vegetation cover and moderate vegetation cover. The little-cover vegetation occurred in the northern zone, FOR-GRASS, while the moderate-cover vegetation was in the middle and southern part of this zone. The amount of high-cover vegetation was relatively small and was mainly distributed in the S and NE of the FOR zone.

Figure 2 Spatial distribution of average fractional vegetation cover (FVC) in 2000–2014 in the Loess Plateau. Map created using ESRI ARCGIS 10.0.
2.2. Temporal trends of vegetation cover change
We examined the vegetation cover change in the Loess Plateau during 2000–2005, 2000–2010 and 2000–2014 (Fig. 3) to identify the dynamics and heterogeneity of vegetation cover change along with restoration age. The analysis indicated that: (1) 95.7% of the vegetation had no significant change during 2000–2005. Vegetation with significant restoration (P<0.05) covered 2.1% of the Loess Plateau and vegetation with significant degradation (P<0.05) covered 2.2%, which resulted in a slight net degradation in the whole region. (2) The proportion of non-significant change vegetation decreased to 76.2% during 2000–2010. Vegetation restoration covered 21% of the whole region, while vegetation degradation remained relatively stable (2.8%). (3) A total of 45.8% of the vegetation showed no significant change during 2000–2014. Vegetation restoration covered more than half of the Loess Plateau (52%), far larger than vegetation degradation (2.2%). The vegetation restoration was mainly in the FOR-GRASS (34.3%) and GRASS (33.7%) zones, and relatively less distributed in zones FOR (19.7%), DES-GRASS(10.4%) and DES (1.9%).

Figure 3 The spatial pattern of vegetation variation trend in (a) 2000–2005, (b) 2000–2010 and (c) 2000–2014. Map created using ESRI ARCGIS 10.0.
We determined the centroid for the area covered by restored vegetation in each period. Change in the location of this indicated any differences in the vegetation restoration rate. The centroid moved towards the area with a higher restoration rate. As shown in Fig. 4, the centroid of the restoration area moved north-eastwards, which indicated that the restoration rate remained greater in the northern part of the Loess Plateau than in the S. Compared with 2000–2005, the centroid moved approximately 7.2km during 2000–2010, and then 1.7km during 2000–2014. The change in the position of the centroid indicated that the difference in the restoration rate occurred between the N and the S, and that it tended to decline with restoration age.

Figure 4 Movement trajectory of centroid of restoration area in each time period. Map created using ESRI ARCGIS 10.0.
2.3. Effects of influencing factors
We analysed the relationships between climate and vegetation (Table 1), and correlation coefficients were calculated between FVC and precipitation (0.668), days of precipitation over 10mm (0.428), average temperature (0.468), maximum temperature (0.510) and minimum temperature (0.411). Precipitation and temperature had significant influences on vegetation at the regional scale, and had effects for each bioclimatic zone. Precipitation was correlated with vegetation in all bioclimatic zones. With precipitation as the independent variable and FVC as the dependent one, we regressed precipitation and FVC for each bioclimatic zone and the rates of regression were 0.013, 0.03, 0.031 and 0.046 in the FOR, FOR-GRASS, GRASS and DES-GRASS(DES) zones, respectively. This indicates that the influence of precipitation tended to increase from S to N. In contrast to precipitation, the correlation between vegetation and temperature parameters revealed an opposite trend, changing from positive in the S to negative in the N. The correlation coefficients in each bioclimatic zone were 0.506 in Zone FOR, 0.019 in Zone FOR-GRASS (not statistically significant), −0.337 in Zone GRASS and −0.701 in Zone DES-GRASS (DES), using average temperatures.
Table 1 The correlation coefficients between fractional vegetation cover (FVC) and climate variables.

*P-value<0.05. **P-value<0.01.
To examine the effect of the GTGP on vegetation change, we obtained data on the area of afforestation driven by the GTGP in the Loess Plateau (Fig. 5), and then conducted a spatial analysis of afforestation and vegetation change in each period. In 2000–2010, 55% of vegetation was significantly restored in the afforested areas; 34% of vegetation also had a restoration trend, but not statistically significant. There was much potential for vegetation recovery in these areas, and by extending the restoration period to 2000–2014, vegetation change became significant in 78% of the area.

Figure 5 The area of afforestation in the Loess Plateau in 2000–2008. Map created using ESRI ARCGIS 10.0.
3. Discussion
3.1. The importance of temporal scale in restoring heterogeneous vegetation
The FVC is regarded as a better index than the NDVI for considering the interference caused by the areas without vegetation cover (Jiang & Huete Reference Jiang and Huete2010). With the FVC, we observed an overall increase in vegetation cover in the Loess Plateau during 2000–2014. The vegetation showed a slight net degradation trend at the national level, with significant vegetation restoration covering only 4.3% of the land mass during 2000–2010 (Lü et al. Reference Lü, Zhang, Feng, Zeng, Fu, Yao, Li and Wu2015). By contrast, the vegetation in the Loess Plateau experienced an obvious net restoration trend, with the percentage of significant vegetation restoration reaching 21%. The vegetation cover increased in the Loess Plateau at a greater rate after 2010. This demonstrates that the Loess Plateau has been playing an important role in ecological restoration in China. In addition, the amount and distribution of restored vegetation differ in each bioclimatic zone. There may be thresholds for vegetation improvement for different bioclimatic zones, a topic that needs to be further studied.
From the vegetation change trends for the three periods (2000–2005, 2000–2010 and 2000–2014) we observed temporal trends in vegetation restoration along with restoration age. Vegetation restoration first began in the middle of the Loess Plateau following the implementation of the GTGP. Vegetation restoration extended northward along the Yellow River and south-westward to the edge of this region. The rate of extending restored vegetation was higher in the N than the S, and this indicates that the northern part of the Loess Plateau where there is less rainfall and lower temperatures may have more extensive and rapid restoration. The trends in different periods suggest that vegetation restoration in the Loess Plateau experienced the continuous acceleration of spatial expansion, and this process showed obvious spatial heterogeneity. Considering the restrictions of the environmental conditions and social development, the proper planning and assessment of future restoration programs are necessary for sustaining the restoration achievements.
3.2. Impact of restoration on vegetation cover
For a long time, the Loess Plateau has been an important agricultural region in China. In 2000, the cropland area was 209,270km2. Topography constrains the agricultural area, with 31,588km2 of cropland on moderate (15–25°) and steep (≥25°) hill slopes, which has led to severe water and soil loss. However, sloping cropland also provides opportunities for ecological restoration.
The GTGP has driven vegetation change in the Loess Plateau. The GTGP aimed to transform sloping cropland to forest, grassland or shrubland through planning and provision of subsidies (22,500¥ha–1 for tree planting and 15,000¥ha–1 for grass). Since the launch of the GTGP, more than half of the study area has undergone some vegetation restoration. The GTGP has resulted in vegetation improvement. In the northern part of the Loess Plateau, ecological restoration has counteracted the negative influence of climatic warming on vegetation, and facilitated the rapid expansion of vegetation cover. The GTGP has had a greater influence than climate in the Loess Plateau. Further improvement in the vegetation of the Loess Plateau will result from government investment.
3.3. Impact of climate on vegetation cover
The vegetation in the Loess Plateau is sensitive to fluctuations in climate, with temperature and precipitation being the most important. Precipitation is closely correlated with vegetation (Martiny et al. Reference Martiny, Camberlin, Richard and Philippon2006; Wang et al. Reference Wang, Kou, Xiong, Mou, Wu and Ge2010a). Due to the water shortage in the study area, precipitation acts as a restrictive factor that has great effects on vegetation growth and the distribution of different vegetation types. In this study we observed close relationships between precipitation and vegetation cover, as expressed in the north-westward decreasing trends. The influences of precipitation strengthen northward, as shown by the linear regression results between FVC and precipitation in each bioclimatic zone. In the northern part of the Loess Plateau, grassland has a wide distribution and has been greatly improved by the GTGP. However, given the long-term insufficient rainfall, the increased water demands from grassland or woodland may alter regional hydrological processes and accentuate water stress (Shangguan Reference Shangguan2007; Liu & Shao Reference Liu and Shao2016). Thus, the trade-off between vegetation cover increases and water balance needs to be investigated.
Temperature plays a key role in controlling vegetation change (Xin et al. Reference Xin, Xu and Zheng2008; Hao et al. Reference Hao, Zhang, Ouyang, Skidmore and Toxopeus2012). The negative influence of temperature on vegetation cover has been identified in several studies (Karnieli et al. Reference Karnieli, Bayasgalan, Bayarjargal, Agam, Khudulmur and Tucker2006; Sun et al. Reference Sun, Song, Mu, Gao, Wang and Zhao2015). In the Loess Plateau, the temperature has increased at a rate of 0.02°Ca–1 over the last 60 years (Lü et al. Reference Lü, Fu, Feng, Zeng, Liu, Chang, Sun and Wu2012). The effects of temperature are highly spatially heterogeneous, with the coexistence of positive and negative effects on vegetation cover. The positive influence is best shown in Zone FOR, which is located in the south-eastern part of the Loess Plateau. The temperature influence changes from positive to negative, with the transformation mainly in the FOR-GRASS zone. To the N of Zone FOR-GRASS, where there is steppe and meadow land, the temperature influence is negative. Within this large area, including the GRASS, DES-GRASS and DES zones, the warmer trend in temperature may inhibit vegetation cover improvement in grassland and potentially restrict further ecological restoration by exacerbating water stress. In addition, the temperature increases in the N of the Loess Plateau result in the degradation of permafrost, which has indirect and negative impacts on vegetation cover by reducing the available water for grassland root systems (Zhou et al. Reference Zhou, Zhao, Tang, Gu and Zhou2005; Yang et al. Reference Yang, Ding and Chen2006).
Although the general trend in the Loess Plateau is for it to become drier (Wang et al. Reference Wang, Yang, Saito, Liu, Sun and Wang2007; Xin et al. Reference Xin, Yu, Li and Lu2011), precipitation slightly increased during 2000–2014. Uncertainty also exists with respect to the temperature trends. Given the insufficient knowledge on climate change and the complex interactions between climate and vegetation, further work is necessary for identifying the interactions between vegetation and climate change (Arneth Reference Arneth2015; Davies-Barnard et al. Reference Davies-Barnard, Valdes, Singarayer, Wiltshire and Jones2015).
3.4. Implications for large-scale ecological restoration
The GTGP has been implemented in the Loess Plateau for more than ten years, and has made great achievements. In 2014, the Chinese government ratified a new round of GTGP implementations. The results of this study would provide some guidance on the planning and management of the GTGP. In this study we observed the restrictions imposed by precipitation and temperature on the vegetation in the northern part of the Loess Plateau. Native species should be used in future programs because they are more suited to the local climatic conditions (Chen et al. Reference Chen, Wang, Lin, Shi, Song and He2015). In addition, we found that the promotion effect of afforestation gradually emerged along with the prolonging of restoration age. The policies and subsidies for the GTGP are in need of continuous development and application. Performance assessments of the GTGP should establish long-term achievements. For the sustainability and maintenance of restoration, it is necessary to develop a comprehensive framework that takes the influences of climate and ecological restoration into consideration. For general large-scale ecological restoration programs, this study highlights the importance of considering the spatiotemporal heterogeneity in restoration performances.
4. Conclusion
In this study, we use FVC time series data to investigate the spatial distribution and temporal change trends in vegetation across the Loess Plateau during 2000–2014. We also examine the roles of ecological restoration and climate in vegetation change. The main findings are as follows:
(1) The average vegetation cover in the Loess Plateau remained at a relatively low level in 2000–2014, with FVC below 30% in more than 60% of the study region. The spatial distribution of vegetation cover demonstrated an overall increasing trend from NW to SE.
(2) There have been significant improvements in the vegetation since the implementation of the GTGP. The percentages of significant vegetation restoration were 2.08, 20.99 and 51.97% in 2000–2005, 2000–2010 and 2000–2014, respectively. There was an increasing rate of restoration, with improvement greater in the N than in the S.
(3) With vegetation change, ecological restoration has had an effect in stimulating vegetation cover. The effect of ecological restoration tended to strengthen along with restoration age.
(4) The effect of climate on vegetation change was also significant. The effect of precipitation was detected to be positive across the Loess Plateau, while the effect of temperature changed from positive in the S to negative in the N.
This study highlights the important influence of policy-driven ecological restoration on vegetation. However, vegetation change is ultimately regulated and controlled by the regional climate. Subsequently, there could be some thresholds for vegetation rehabilitation for different bioclimatic zones, as revealed by the spatiotemporal variability in vegetation change in the Loess Plateau during 2000–2014. Furthermore, climatic warming is not necessarily detrimental to vegetation restoration, but may show significant negative effects in areas with water shortage problems. This study also shows that the effects of restoration on vegetation may not be linear. Thus, we recommend the consideration of thresholds and spatiotemporal effects on vegetation change for planning and performance assessments in large-scale ecological restoration projects, especially in arid and semi-arid regions.
5. Acknowledgements
This research was supported by the National Key Research and Development Program (2016YFC0501601) and the Ministry of Environmental Protection of China (201409055).


