

Understanding urban geology is critical in addressing a wide range of problems associated with unforeseen ground conditions, groundwater systems and the environmental impact of previous industrial activity. Management and mitigation of such issues by those charged with developing, regenerating and conserving urban areas, requires access to high-resolution, three-dimensional (3D) geological information, particularly in areas characterised by complex geology (Culshaw & Price Reference Culshaw, Nathanail, Leeks, Alker, Bridge, Duffy, Fowler, Packman, Swetnam, Wadsworth and Wyatt2011).
Over the past decade, digital systems have been increasingly used to facilitate urban planning, development and environmental management. Against this backdrop, the use of digital technology in geology provides important opportunities to develop digital geological resources that can integrate more data from diverse sources; help visualise and analyse the subsurface in 3D spatial contexts; and provide flexible products designed to be integrated in a range of secondary modelling and engineering design applications. In recent years, 3D geological models have increasingly been used to help communicate the understanding of geology at national and urban scales (Thierry et al. Reference Thierry, Prunier-Leparmentier, Lembezat, Vanoudheusden and Vernoux2009; Wycisk et al. Reference Wycisk, Hubert, Gossel and Neumann2009; Van der Meulen et al. Reference Van der Meulen, Doornenbal, Gunnink, Stafleu, Schokker, Vernes, Van Geer, Van Gessel, Van Heteren, Van Leeuwen, Bakker, Bogaard, Busschers, Griffioen, Gruijters, Kiden, Schroot, Simmelink, Van Berkel, Van der Krogt, Westerhoff and Van Daalen2013; Sandersen et al. Reference Sandersen, Kristensen and Mielby2015; Schokker et al. Reference Schokker, Bakker, Dubelaar, Dambrink and Harting2015). 3D geological models, comprising fence diagrams of intersecting cross-sections, have been developed by the British Geological Survey (BGS) over the last 15 years for a range of applied uses, including groundwater flow, siting of infrastructure, hazard assessment and scientific investigation (Jackson & Green Reference Jackson and Green2003; Smith Reference Smith2005; Merritt et al. Reference Merritt, Entwisle and Monaghan2006; Ford et al. Reference Ford, Burke, Royse and Mathers2008, Reference Ford, Mathers, Royse, Aldiss and Morgan2010; Burke et al. Reference Burke, Price, Crofts and Thorpe2009; Kessler et al. Reference Kessler, Mathers and Sobisch2009; Royse et al. Reference Royse, Rutter and Entwisle2009; Campbell et al. Reference Campbell, Merritt, O Dochartaigh, Mansour, Hughes, Fordyce, Entwisle, Monaghan and Loughlin2010; Mathers et al. Reference Mathers, Burke, Terrington, Thorpe, Dearden, Williamson and Ford2014).
The city of Glasgow (Fig. 1) is underlain by complex glacial, fluvial and marine deposits, and heterogeneous anthropogenic deposits that reflect Glasgow's industrial heritage. These overlie bedrock consisting of faulted coal-bearing sedimentary rocks and intrusive and extrusive igneous rocks of Carboniferous age (Hall et al. Reference Hall, Browne and Forsyth1998). The highly variable nature of subsurface geology provides a complex foundation for planning city infrastructure and hydrological conditions. Furthermore, the legacy of anthropogenic alteration such as quarrying and mining for coal and ironstone has caused localised subsidence resulting in failure of existing buildings (Browne et al. Reference Browne, Forsyth and McMillan1986; Merritt et al. Reference Merritt, Monaghan, Entwisle, Hughes, Campbell and Browne2007; Campbell et al. Reference Campbell, Merritt, O Dochartaigh, Mansour, Hughes, Fordyce, Entwisle, Monaghan and Loughlin2010). In the 1980s, a set of thematic Environmental Geology Maps for the Glasgow area was compiled by the BGS to help planners and developers. Themes included bedrock and superficial geology, drift thickness, mining and hydrological information. These maps included as one of their inputs a database of 15,000 boreholes (Browne et al. Reference Browne, Forsyth and McMillan1986). Since the 1980s this databased has grown to nearly 100,000 boreholes. It would be impractical to synthetise such large amounts of data using traditional mapping methods. However, in recent years, advances in digital technology have paved the way for new methods of mapping, modelling and visualising the subsurface. This new capability, combined with the need for up-to-date geological information to inform decision-making and support development programmes, has provided a basis for the development of a suite of 3D geological models for Glasgow and its ‘hinterland' area, the River Clyde catchment.
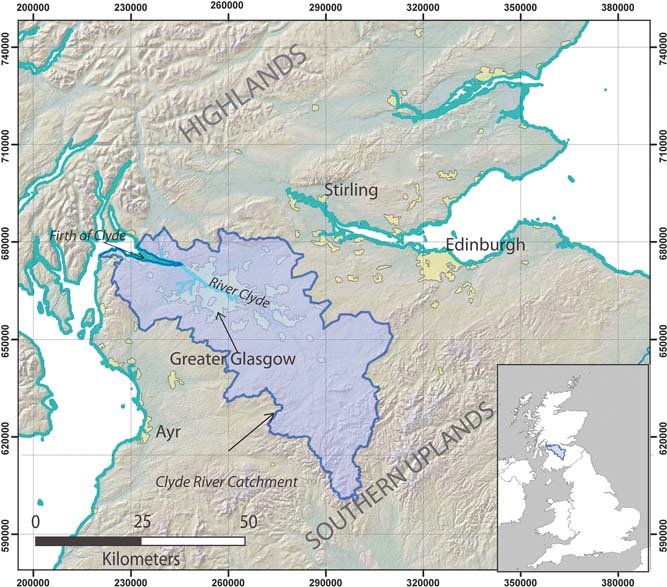
Figure 1 Map of central Scotland showing the River Clyde Catchment and urban area of Greater Glasgow. Includes mapping data licensed from Ordnance Survey. © Crown Copyright and/or database right 2017. Licence number 100021290 EU and NEXTMap Britain elevation data from Intermap Technologies.
In the Glasgow area, a programme of 3D geological modelling was undertaken as part of the Clyde-Urban Super-Project (CUSP) and in partnership with Glasgow City Council and other local and regulatory authorities. A suite of models was constructed between 2008 and 2013, including separate bedrock and superficial deposits models for much of the urban area of greater Glasgow at 1:50,000 scale resolution, and a larger superficial deposits model covering the whole Clyde Catchment area at 1:250,000 scale resolution. A pioneering consortium approach was taken to the development and delivery of the 3D geological models, resulting in the establishment of the ASK (Accessing Subsurface Knowledge) network, a data and knowledge exchange consortium involving public and private sector partners. ASK promotes free flow of digital subsurface data and knowledge between its partners (Campbell et al. Reference Campbell, Bonsor, Lawrence, Monaghan, Whitbread, Kearsey, Finlayson, Entwisle, Kingdon, Bricker, Fordyce, Barron, Dick and Hay2015). It encourages the use of a standardised template (GSPEC) for digital transfer of borehole data, and ingestion, storage and delivery of the data in the industry standard digital Association of Geotechnical & Geoenvironmental specialists (AGS) Data Format, via a portal managed by BGS. This allows for both development of 3D attributed geological models and provides a user forum to refine the modelling process, based on requirements of those who are using the models (Bonsor et al. Reference Bonsor, Entwisle, Watson, Lawrie, Bricker, Campbell, Lawrence, Barron, Hall and Ó Dochartaigh2013; Campbell et al. Reference Campbell, Bonsor, Lawrence, Monaghan, Whitbread, Kearsey, Finlayson, Entwisle, Kingdon, Bricker, Fordyce, Barron, Dick and Hay2015).
This paper describes the bedrock and superficial models for Glasgow and the Clyde catchment, and the methods used in their development. Owing to the nature of the geology and the variability in the types and quality of the input data, different software applications and methodologies were used to create the bedrock and superficial models. This paper also discusses how these models have been used to create bespoke products for clients as well as forming the geological input into hydrogeological and glaciological studies.
1. Study area and geology
Glasgow, located in the west of Scotland's Central Belt, comprises the City of Glasgow and surrounding urban areas, collectively known as Greater Glasgow (Fig. 1). The city lies within a lowland terrain between the Highlands to the north and the Southern Uplands to the south. The River Clyde flows west through the heart of the city into the Clyde Estuary at the head of the coastal inlet of the Firth of Clyde. The River Clyde catchment covers an area of ∼3200km2 extending from the Southern Uplands throughout much of the western half of the Central Lowlands (Fig. 1).
The suite of geological models developed for Glasgow include a high-resolution superficial deposits model covering 600km2 of the Greater Glasgow area, a lower resolution superficial deposits model for the Clyde Catchment area, and a bedrock model covering approximately 80 % of the Clyde Catchment area (see Fig. 2 for model areas).
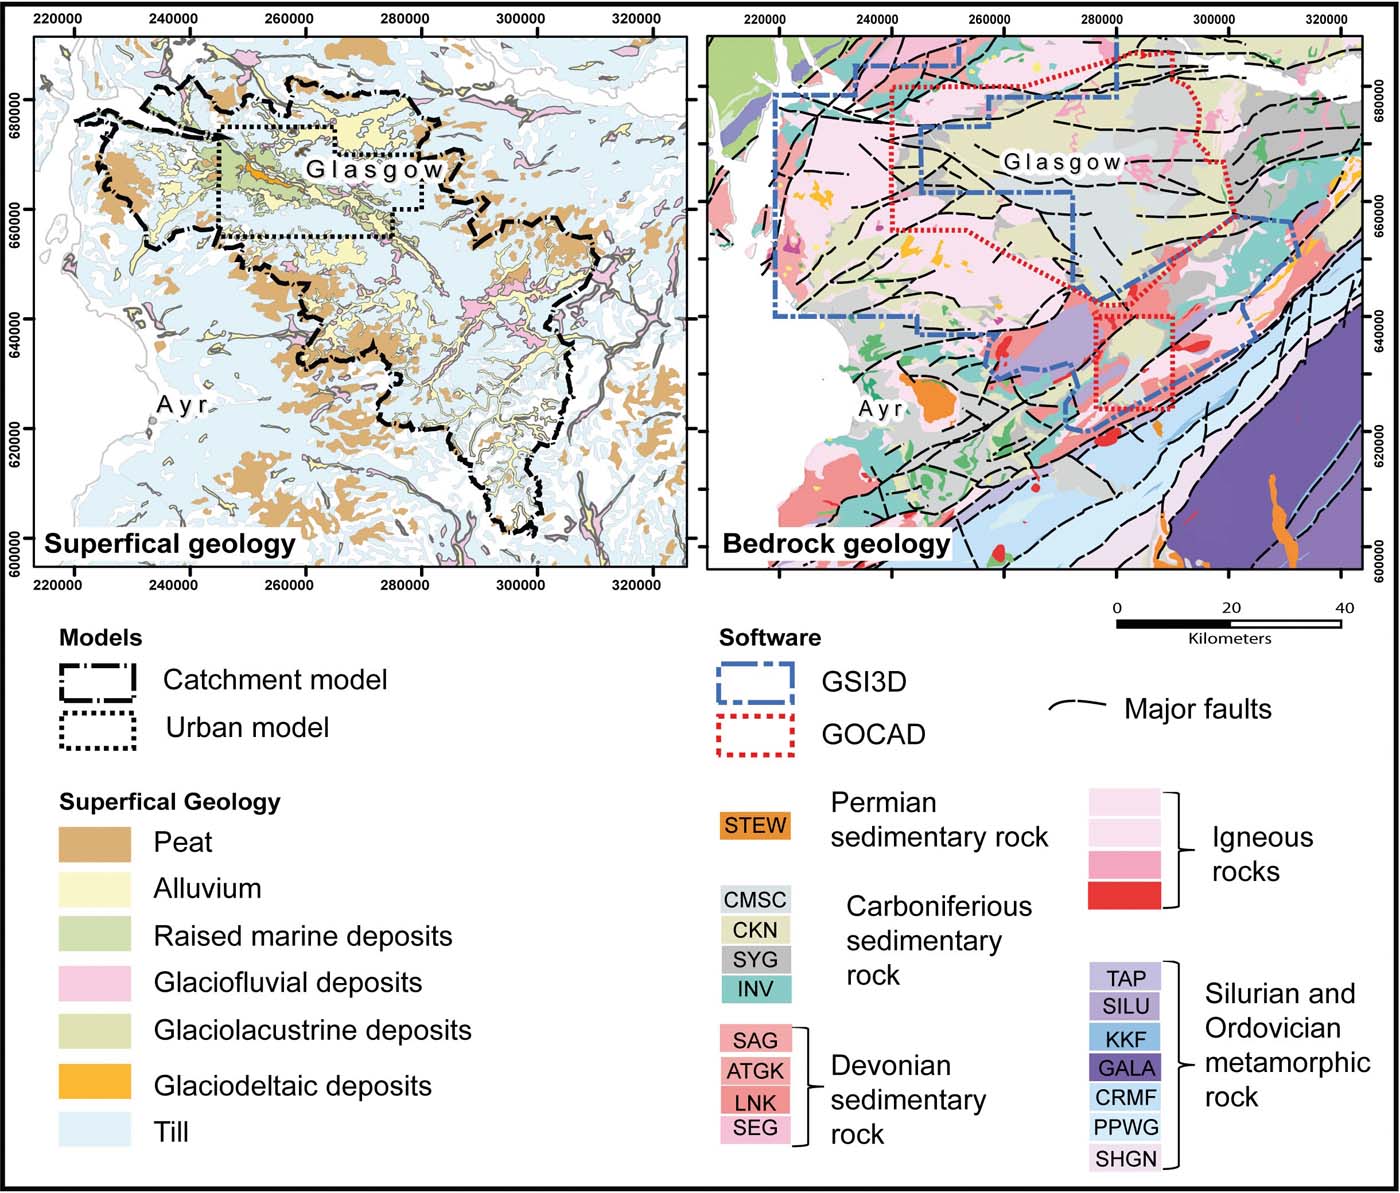
Figure 2 Superficial and bedrock geology maps from DiGMapGB-50 V6 for the study area. The names of the individual bedrock units are as follows: Stewartry Group (STEW), Scottish Coal Measures Group (CMSC), Clackmannan Group (CKN), Strathclyde Group (SYG). Inverclyde Group (INV). Stratheden group (SAG), Arbuthnott–Garvock Group (ATGK) Lanark Group (LNK), Strathmore Group (SEG), Tappins Group (TAP), Silurian undifferentiated (SILU), Kirkcolm Formation (KKF) ,Gala Group (GALA), Crawford Group and Moffat Shale Group (CRMF), Portpatrick Formation and Glenwhargen Formation (PPWG), Shinnel Formation and Glenlee Formation (SHGN). Includes mapping data licensed from Ordnance Survey. © Crown Copyright and/or database right 2017. Licence number 100021290 EU.
1.1. Superficial geology
The superficial geology of the Clyde Basin area reflects successive transitions between glacial, marine, estuarine and fluvial environments that have occurred since the last major glaciation of the region during the Late Devensian period (ca.30–25ka; Browne & McMillan Reference Browne and McMillan1989; Hall et al. Reference Hall, Browne and Forsyth1998; Campbell et al. Reference Campbell, Merritt, O Dochartaigh, Mansour, Hughes, Fordyce, Entwisle, Monaghan and Loughlin2010; Finlayson et al. Reference Finlayson, Merritt, Browne, Merritt, McMillan and Whitbread2010). Glacial till occurs widely throughout the Clyde catchment, where it typically overlies bedrock (Fig. 2; Hall et al. Reference Hall, Browne and Forsyth1998). In the lower parts of the catchment, underlying the urban area, the till is overlain by a highly variable sequence of deposits laid down during regional deglaciation, a subsequent marine inundation and later by the development of the fluvial system of the River Clyde (Browne & McMillan Reference Browne and McMillan1989).
1.2. Bedrock geology
The Clyde catchment is largely underlain by sedimentary and igneous rocks of Carboniferous age dissected by a complex network of faults (Fig. 2; Forsyth et al. Reference Forsyth, Hall and McMillan1996; Hall et al. Reference Hall, Browne and Forsyth1998). The oldest strata are of the Inverclyde Group and contain the Kinnesswood, Ballagan and Clyde Sandstone formations (Hall et al. Reference Hall, Browne and Forsyth1998). These strata comprise sandstones and siltstones with thin beds of limestone and dolomite. Overlying the Inverclyde Group is the Strathclyde Group, consisting of interbedded sedimentary rocks and igneous sills, plugs and dykes primarily relating to the Clyde Plateau Volcanic Formation (Upton et al. Reference Upton, Stephenson, Smedley, Wallis, Fitton, Wilson, Neumann, Davies, Timmerman, Heeremans and Larsen2004; Monaghan & Parrish Reference Monaghan and Parrish2006). The volcanic episodes giving rise to the igneous rocks occurred during a period of active extensional faulting in the basin 342 million years ago (Upton et al. Reference Upton, Stephenson, Smedley, Wallis, Fitton, Wilson, Neumann, Davies, Timmerman, Heeremans and Larsen2004). The resistant rocks of the Clyde Plateau Volcanic Formation form the uplands both to the north and south of the city of Glasgow.
The Greater Glasgow area is largely underlain by the Clackmannan and Scottish Coal Measures groups, which overly the Strathclyde Group. These comprise cyclic sandstones and mudstones with limestones, coals, ironstones and seatrocks (Campbell et al. Reference Campbell, Merritt, O Dochartaigh, Mansour, Hughes, Fordyce, Entwisle, Monaghan and Loughlin2010). The Scottish Coal Measures and Clackmannan groups have been extensively mined for coal and ironstone in the Glasgow area since the 1800s. Undermining, commonly at shallow depths (less than 30m below the ground surface), affects many areas that are planned for urban redevelopment (Browne et al. Reference Browne and McMillan1986). The collapse of underground ‘pillar and stall' workings has resulted in cases of severe local subsidence affecting building stability. Subsurface mine systems are also known to provide paths for groundwater contaminant movement and may influence the quality of groundwater in shallow aquifers (Browne et al. Reference Browne and McMillan1986; Campbell et al. Reference Campbell, Merritt, O Dochartaigh, Mansour, Hughes, Fordyce, Entwisle, Monaghan and Loughlin2010).
Both the sedimentary and igneous rocks have been subsequently cross-cut by a suite of major east–west striking faults. Associated with these major faults are minor faults in several different orientations (Fig. 2). These formed in Late Carboniferous times and are associated with the development of major folds in the Carboniferous strata. (Underhill et al. Reference Underhill, Monaghan and Browne2008).
2. Available input data
The strategy developed for the 3D geological model construction has been influenced by the availability of different sources of data, as well as its resolution and quality. Key data sources for model development include geological maps, borehole records, mine plans and digital elevation models (DEMs), which are used to constrain the ground surface elevation (Jones et al. Reference Jones, McCaffrey, Clegg, Wilson, Holliman, Holdsworth, Imber and Waggott2009; Kaufmann & Martin Reference Kaufmann and Martin2009; Kessler et al. Reference Kessler, Mathers and Sobisch2009).
2.1. Geological maps
The majority of 3D geological models created by geological surveys in Europe are built upon a geological mapping heritage (e.g., Van der Meulen et al. Reference Van der Meulen, Doornenbal, Gunnink, Stafleu, Schokker, Vernes, Van Geer, Van Gessel, Van Heteren, Van Leeuwen, Bakker, Bogaard, Busschers, Griffioen, Gruijters, Kiden, Schroot, Simmelink, Van Berkel, Van der Krogt, Westerhoff and Van Daalen2013). As a result, they tend to be largely constructed on the basis of information from boreholes and/or outcrops and show the geometries of stratigraphic units as their main parameter. Digital geological maps of the bedrock and superficial deposits are available for the whole area of the Clyde catchment at 1:50,000 scale, and for much of the urban area of Glasgow at 1:10,000 scale. The BGS digital map dataset DiGMapGB-50 V6 provided 1:50,000 scale geological map data for the Clyde Catchment Model. For the higher resolution models of the urban area, 1:10,000 scale digital map data from the DiGMapGB-10 dataset were used (Monaghan et al. Reference Monaghan, Arkley, Whitbread and McCormac2014). The digital map datasets provide a range of stratigraphic and lithological information for each bedrock formation or superficial deposit unit, derived from the BGS Lexicon (Smith Reference Smith2009). The geological map provided both the stratigraphic order and the top surface to the models.
2.2. Boreholes
The BGS holds 95301 digital borehole records for the Glasgow catchment Fig. 3) in the corporate Single Onshore Borehole Index (SOBI) and Borehole Geology (BoGe) databases (see Kessler et al. Reference Kessler, Mathers and Sobisch2009). Within the Glasgow area, the archived borehole records are largely derived from site investigations and historic mining activity. The site investigation boreholes are typically shallow, with depths commonly between 2 and 5m and were primarily drilled and logged by Glasgow City Council and their sub-contractors as engineering site investigations. Many boreholes related to historic coal and ironstone mining were drilled during the 1800s to early 1900s. These boreholes were drilled to prove subsurface coal resources at depths of up to several hundred metres below the ground surface. Over 70 of the boreholes were drilled or examined by BGS in Glasgow between 1960 and 1990 to constrain key elements of the stratigraphy of bedrock formations within the Glasgow area.

Figure 3 Map showing the distribution of all the borehole records currently held by the BGS in the study area. The borehole points are coloured based on the total depth of the borehole and show that the majority of the deep boreholes (blue) are only found in the area of the Coal Measures. The histograms show the frequency distribution of the depth of these boreholes (top right) and an expanded plot for boreholes less than 100m deep. Includes mapping data licensed from Ordnance Survey. © Crown Copyright and/or database right 2017. Licence number 100021290 EU and NEXTMap Britain elevation data from Intermap Technologies.
The length of the 95,301 boreholes varies from less than 1m to 1300m; however, the vast majority of the boreholes penetrate only to shallow depths: 75 % of the boreholes are less than 18.1m deep and the median borehole depth is 6.5m (Fig. 3). The lack of deep boreholes means there are fewer data available for bedrock modelling relative to that available for superficial deposits. The boreholes are not evenly distributed throughout the area, but are largely focused in Greater Glasgow and the surrounding urban areas, and in regions underlain by strata of the Scottish Coal Measures Group. Elsewhere borehole distribution is sparse, with greater borehole density occurring locally along transport corridors (Fig. 3). This clustering, along with the complexity of the geology, is one of the strongest controls on the uncertainty of the final models (see Campbell et al. Reference Campbell, Merritt, O Dochartaigh, Mansour, Hughes, Fordyce, Entwisle, Monaghan and Loughlin2010 and Kearsey et al. Reference Kearsey, Williams, Finlayson, Williamson, Dobbs, Marchant, Kingdom and Campbell2015 for further discussion).
2.3. Mine plans
Mine abandonment plans dating from 1840 to 1980, related to historic coal and ironstone working, are held in the BGS archive. Many of these mine plan records have been digitally captured by BGS in ESRI ArcGIS® formats, with recorded levels transcribed to Ordnance Datum (OD) (Fig. 4). To date, data on plans from 25 different coal seams have been digitised in the Clyde Catchment area, distributed throughout the regions underlain by coal and ironstone bearing strata (Fig. 5). These plans provide detailed information on the depth and form of coal horizons at a range of stratigraphic levels and the coal seam level information was used as control points when building coal seams in the 3D models. The positions where faults cut key coal seams in the subsurface were used, along with the mapped trace of the fault at the surface to control dip and displacement in the 3D model.

Figure 4 A detail of a digitised mine plan in the central Glasgow area, showing the geographical area of known worked coal seam (in blue) and the depth measurements shown as point data attributed with values from the mine plans converted to depths relative to Ordinance datum (OD). Includes mapping data licensed from Ordnance Survey. © Crown Copyright and/or database right 2017. Licence number 100021290 EU.
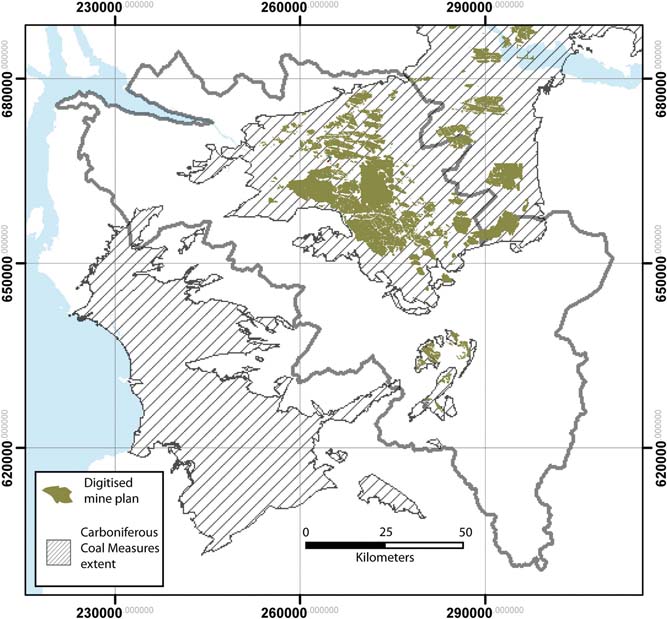
Figure 5 The geographic extent of all the mine plans digitised at 2014 in the Clyde Catchment area. The hatched area shows the extent of the Carboniferous Coal measures. Includes mapping data licensed from Ordnance Survey. © Crown Copyright and/or database right 2017. Licence number 100021290 EU.
2.4. Digital elevation models
DEMs are used in the modelling to provide representations of the elevation of both the ground surface and the surface level of the bedrock (rockhead). The ground surface is constrained by the NEXTmap® digital terrain model (DTM), which is derived from digital elevation data acquired by airborne radar survey (Intermap 2011). The original NEXTmap® DTM has a 5m grid spacing and a stated vertical accuracy of approximately ±1m. However, because of restrictions in processing capacity of the 3D modelling software, the DTM was resampled to a 50m grid resolution for the Greater Glasgow superficial deposits model and 500m for the Clyde Catchment model.
The BGS Rockhead Elevation Model (RHEM) was used to inform the modelling of superficial deposits in the high-resolution urban models, and to constrain superficial deposits thickness in the Clyde Catchment model. The BGS RHEM is a 50m grid resolution national dataset that was derived by subtracting the thickness of superficial deposits, modelled from the national borehole dataset using a natural neighbour algorithm, from the NEXTmap® DTM (Lawley & Garcia-Bajo Reference Lawley and Garcia-Bajo2009). In the Clyde basin area, the RHEM is constrained by 44,753 proven rockhead depths from borehole records, and is ‘influenced' by a further 7028 total depth (rockhead not proven) records (for details see Lawley & Garcia-Bajo, Reference Lawley and Garcia-Bajo2009).
Rockhead forms the base surface of the high-resolution superficial deposits model for the Glasgow urban area. A new rockhead surface for this model was constructed during development of the superficial deposits model, to include rockhead data from over 600 more borehole records that were not available for construction of the BGS RHEM. This locally revised RHEM forms the top surface of the high-resolution bedrock model for the Glasgow area.
2.5. Memoirs and other data
Other sources of geological information utilised in the modelling process include geological memoirs (e.g., Francis et al. Reference Francis, Forsythe, Read and Armstrong1970; Forsyth et al. Reference Forsyth, Hall and McMillan1996; Hall et al. Reference Hall, Browne and Forsyth1998; Monro Reference Monro1999 and Paterson et al. Reference Paterson, Hall and Stephenson1990, Reference Paterson, McAdam and MacPherson1998), and PhD thesis (e.g., Craig Reference Craig1980). The geological memoirs contain most of the detailed information and control on the stratigraphy of the areas and it was from them that the model stratigraphy was constructed. Cross-sections, structural information and thickness estimates for stratigraphic units from these sources provided additional constraints for development of the geological models. Stratigraphic descriptions and correlations for the Clyde Basin area, such as those provided by Browne & McMillan (Reference Browne and McMillan1989) and Browne et al. (Reference Browne, Dean, Hall, McAdam, Monro and Chisholm1999) provided essential context for defining the stratigraphic horizons to be represented in the 3D models.
3. Modelling approach
When the CUSP was started no one piece of software available to the BGS was capable of dealing with the data density in superficial deposits, the complex faulted geometry and mine plan input data of bedrock coal measures strata. Therefore, when the project started different modelling strategies were used to model the bedrock and superficial deposits, and consequently a ‘suite' of models has been developed for the Glasgow area. The anthropogenic and superficial and non-coalfield deposits were modelled using GSI3D® while coalfield strata were modelled using GoCAD™ software. The use of different modelling strategies reflects a pragmatic approach balancing considerations of potential user requirements, the geological complexity of both the superficial deposits and bedrock, constraints provided by modelling software capability and varying levels of data availability for different stratigraphic units. Both GSI3D® and GoCAD™ represent geological surfaces using a series of triangulated irregular networks (TINs), which allow more complex geometries of geological structures to be captured in greater detail than grid based methods for similar computational data (Zu et al. Reference Zu, Hou, Zhang, Hua and Luo2012).
3.1. Anthropogenic deposits (man-made ground)
In urban areas often one of the units that causes greatest geotechnical problems is man-made ground (De Beer, Reference De Beer2005; Reference De Beer2008; De Beer et al. Reference De Beer, Price and Ford2012, Schokker et al. Reference Schokker, Bakker, Dubelaar, Dambrink and Harting2015). In Glasgow the variety of different historical land uses including, made and worked ground, which includes filled and partially back-filled pits and quarries (Browne et al. Reference Browne and McMillan1986), meant that it was impractical to sub-divide anthropogenic deposits in to different types (see Price et al. Reference Price, Ford, Cooper and Neal2011). Instead all areas of man-made ground were primarily identified using Digital Geological Map (DiGMapGB 1:10,000) polygons. These were subsequently altered to encompass areas where boreholes reported additional areas of artificial ground greater than 3m thick. Alterations were made using the Ordnance Survey maps to identify the extent of industrial areas, housing developments and other information. It was assumed in urban areas that there was likely to be a 1m thickness covering of man-made ground throughout the city, so the modelling methodology was focused around identifying areas of man-made ground thicker than 3m.
3.2. Superficial deposits models
A detailed model of the superficial deposits was developed for the Greater Glasgow area, utilising the high density of borehole records and available 1:10,000 scale digital geological map data. The higher resolution modelling approach for the urban area reflects the greater potential user requirements for geological information in relation to development pressures, environmental management, and mitigation of hazards related to ground conditions. The Greater Glasgow superficial deposits model includes 18 stratigraphic units (Fig. 6), as defined by Browne & McMillan (Reference Browne and McMillan1989). A lithostratigraphic approach was used because the geological map and geometric understanding of the deposits was in that form. This forms the basis upon which lithological and geotechnical parameters can be added to the model (see Section 5.2). Stratigraphic associations were assigned to the borehole during the modelling process on the basis of lithological descriptions provided in the borehole record and position within the borehole and basin area (see Table 1).
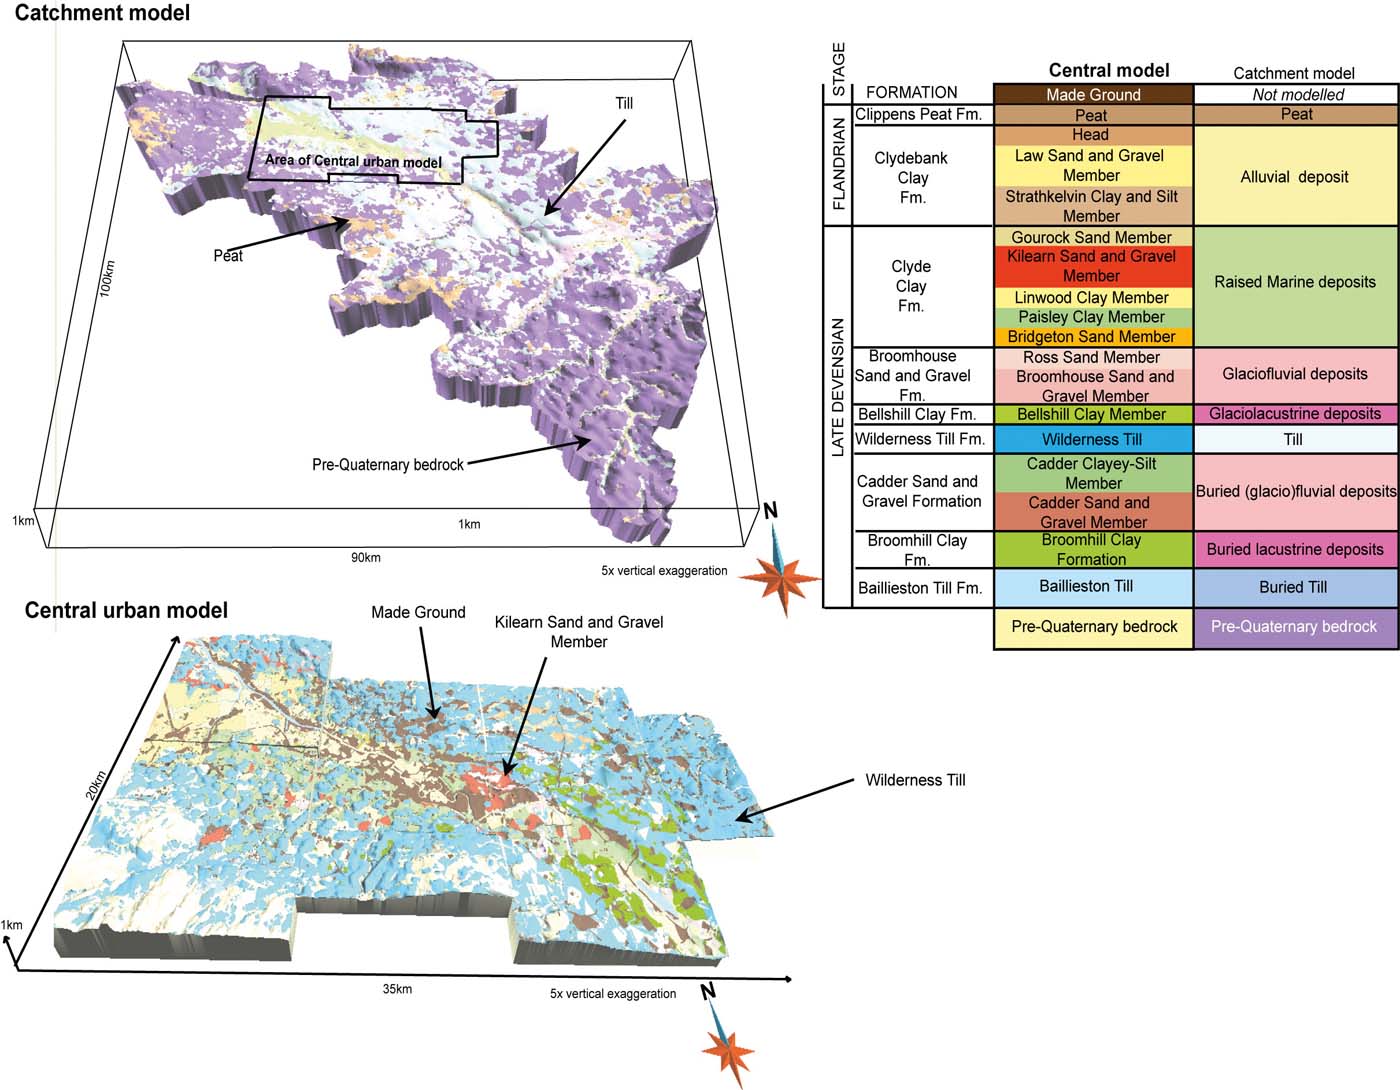
Figure 6 The Clyde Catchment (top left) and Greater Glasgow (bottom left) superficial geology models. The area of the Clyde Catchment model which is covered by the higher resolution urban model is shown by the black box. The key to major stratigraphic units used in the superficial models is derived from Browne & McMillan (Reference Browne and McMillan1989) for both the detailed central model and catchment models (right).
Table 1 Lithologies found within the superficial lithostratigraphic units in Glasgow.

For the lower resolution Clyde catchment superficial deposits model (Fig. 6), a simplified stratigraphy was used, comprising nine lithogenetic units (Fig. 6). The reduced resolution of the modelled stratigraphy reflects the sparse distribution of boreholes within much of the catchment area, and the fact that 1: 50,0000 geological maps for superficial deposits record lithogenetic units with limited stratigraphic information (e.g., Till, Glaciofluvial Sand and Gravel, or Alluvial Deposits).
The superficial deposits were modelled using the software package GIS3D, a system for developing ‘framework' models, generated from fence diagrams of intersecting cross-sections constructed by a geological modeller through interpretation of borehole records (Kessler et al. Reference Kessler, Mathers and Sobisch2009). The interpretive approach is particularly suited for modelling superficial deposits and simply faulted bedrock in regions where the data density is variable. It has been employed in a range of urban environments. This is because it allows the geologist to use their expert judgement in areas of ambiguous data (Merritt et al. Reference Merritt, Entwisle and Monaghan2006; Ford et al. Reference Ford, Burke, Royse and Mathers2008, Reference Ford, Mathers, Royse, Aldiss and Morgan2010; Burke et al. Reference Burke, Price, Crofts and Thorpe2009; Kessler et al. Reference Kessler, Mathers and Sobisch2009; Royse et al. Reference Royse, Rutter and Entwisle2009; Campbell et al. Reference Campbell, Merritt, O Dochartaigh, Mansour, Hughes, Fordyce, Entwisle, Monaghan and Loughlin2010; Price et al. Reference Price, Ford, Cooper and Neal2010). This interpretive approach allows the geological modeller to use a range of resources alongside geological expertise to resolve discrepancies in data and to construct geologically realistic geometries in areas where there are limited geological data.
The Greater Glasgow superficial deposits model was constrained using 1167 cross-sections and 11,570 boreholes. These sections are interpolated by the GSI3D® software into triangulated surfaces using a Delaunay triangulation (Figs 6, 7). The Clyde Catchment model used 1066 boreholes to constrain 85 cross-sections, producing 41,727 control points for the triangulated surfaces (Figs 6, 7). The location where each unit outcrops as the surface was constrained by DiGMapGB-10 for the Greater Glasgow model and was simplified from DigMapGB-50 (V6) for the Clyde Catchment model.
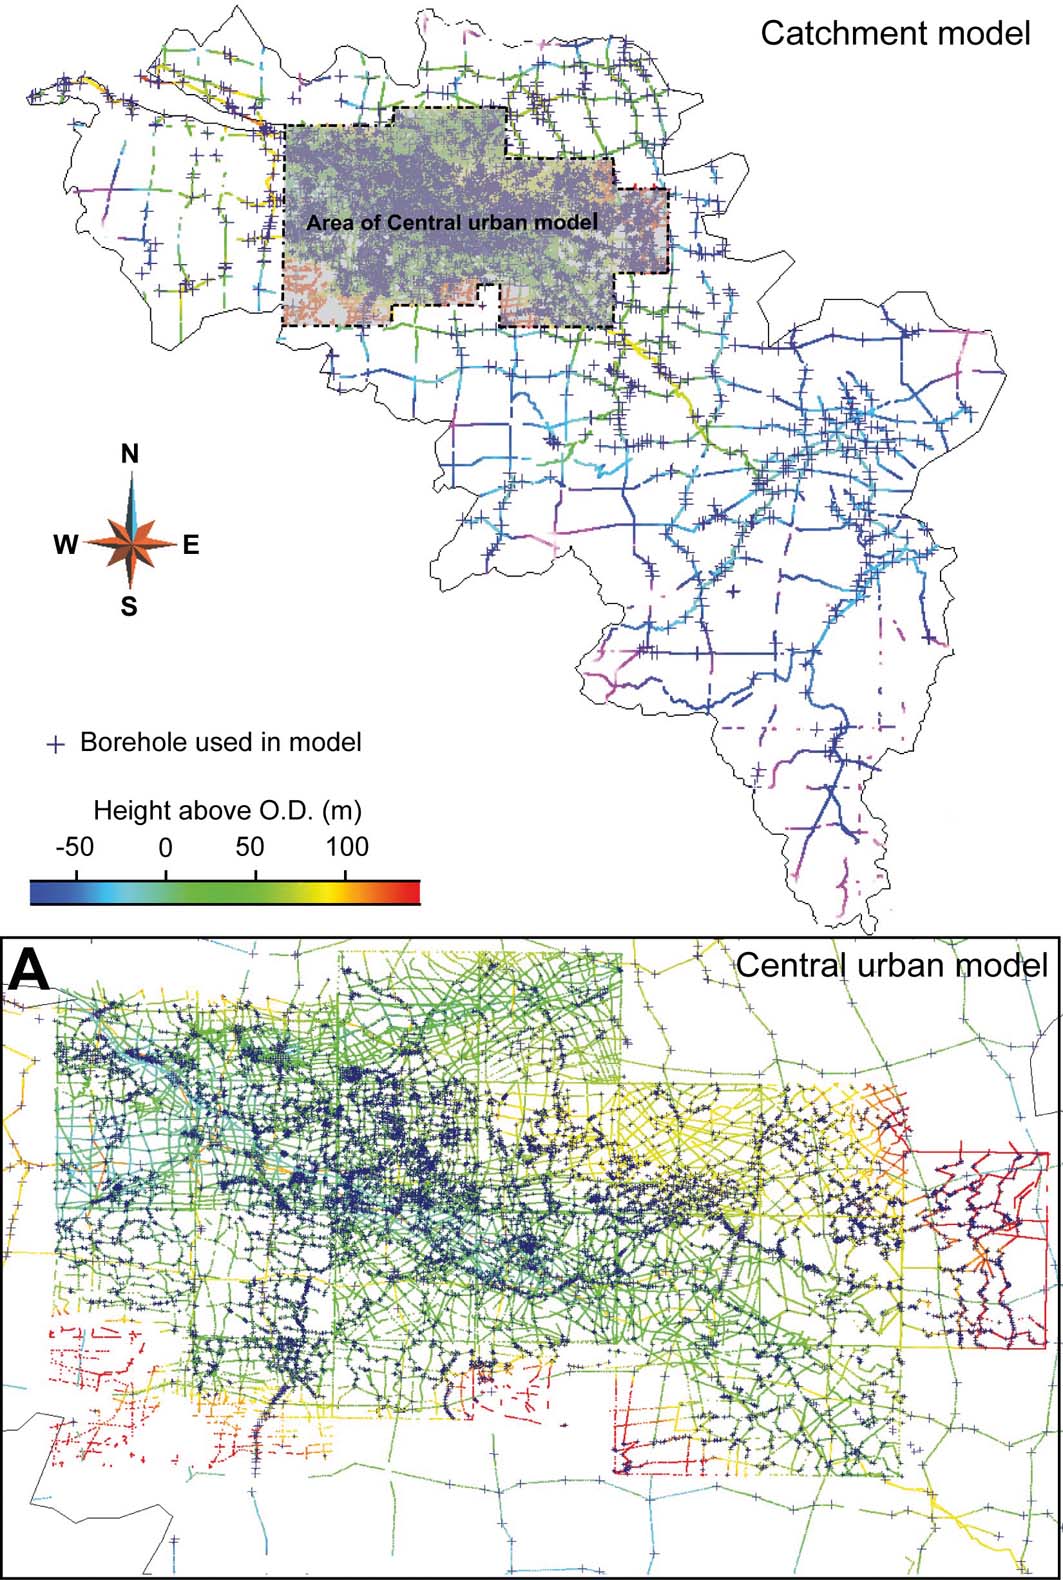
Figure 7 Maps of the cross-sections and control points used to derive triangulated surfaces for the Clyde Catchment (top) and Greater Glasgow (bottom) models in GSI3D. Boreholes that were used to constrain the cross-sections are shown as blue crosses. Area A is the area of the Clyde Catchment model, which is covered by the Greater Glasgow model.
3.3. Bedrock models
Two separate strategies were adopted to construct the bedrock model covering most of the Clyde Catchment and adjacent areas. Northern and western areas of the Clyde catchment that are underlain by strata of the Clyde Plateau Volcanic Formation (Fig. 2), were modelled using GSI3D® software to construct stratigraphic surfaces and simple fault geometries (Figs 8, 9). The use of GSI3D® in these areas reflects limited subsurface data constraints due to sparse borehole records and absence of mining data. The interpretive approach of GSI3D®, allowing users to model simple fault geometries and bedrock structure from surface observations and broader geological understanding of the region was preferred for these areas of limited data availability.
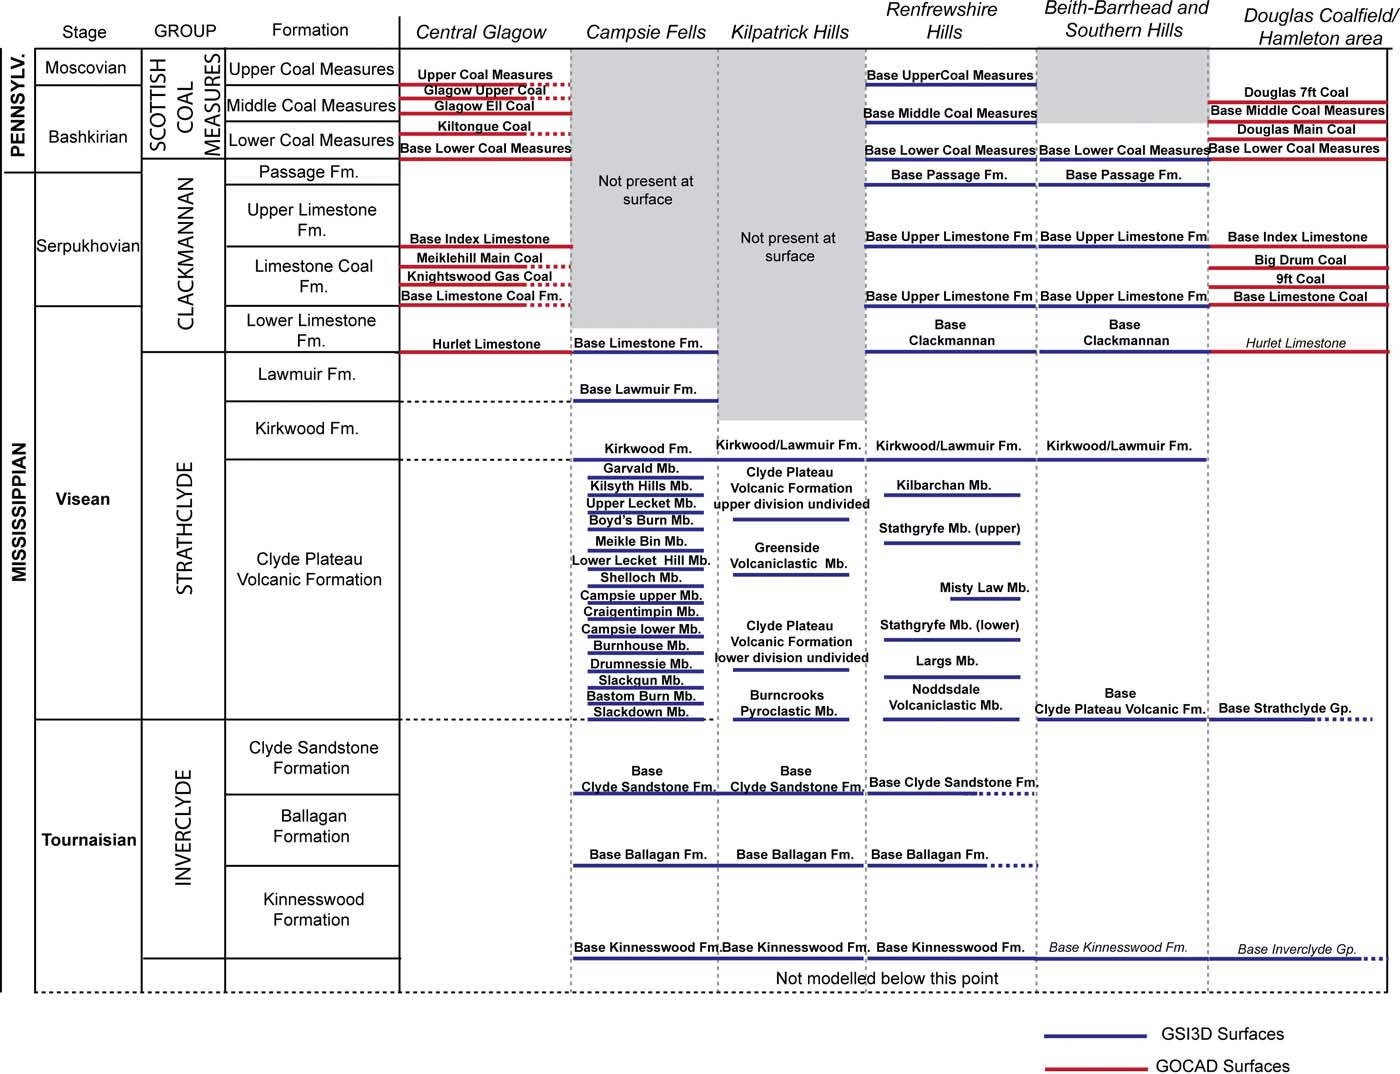
Figure 8 The stratigraphic horizons represented in the bedrock model. The horizons marked in red were modelled in GOCAD® and those in blue were modelled in GSI3D®. For the geographical position of the modelled areas, see Figure 10.
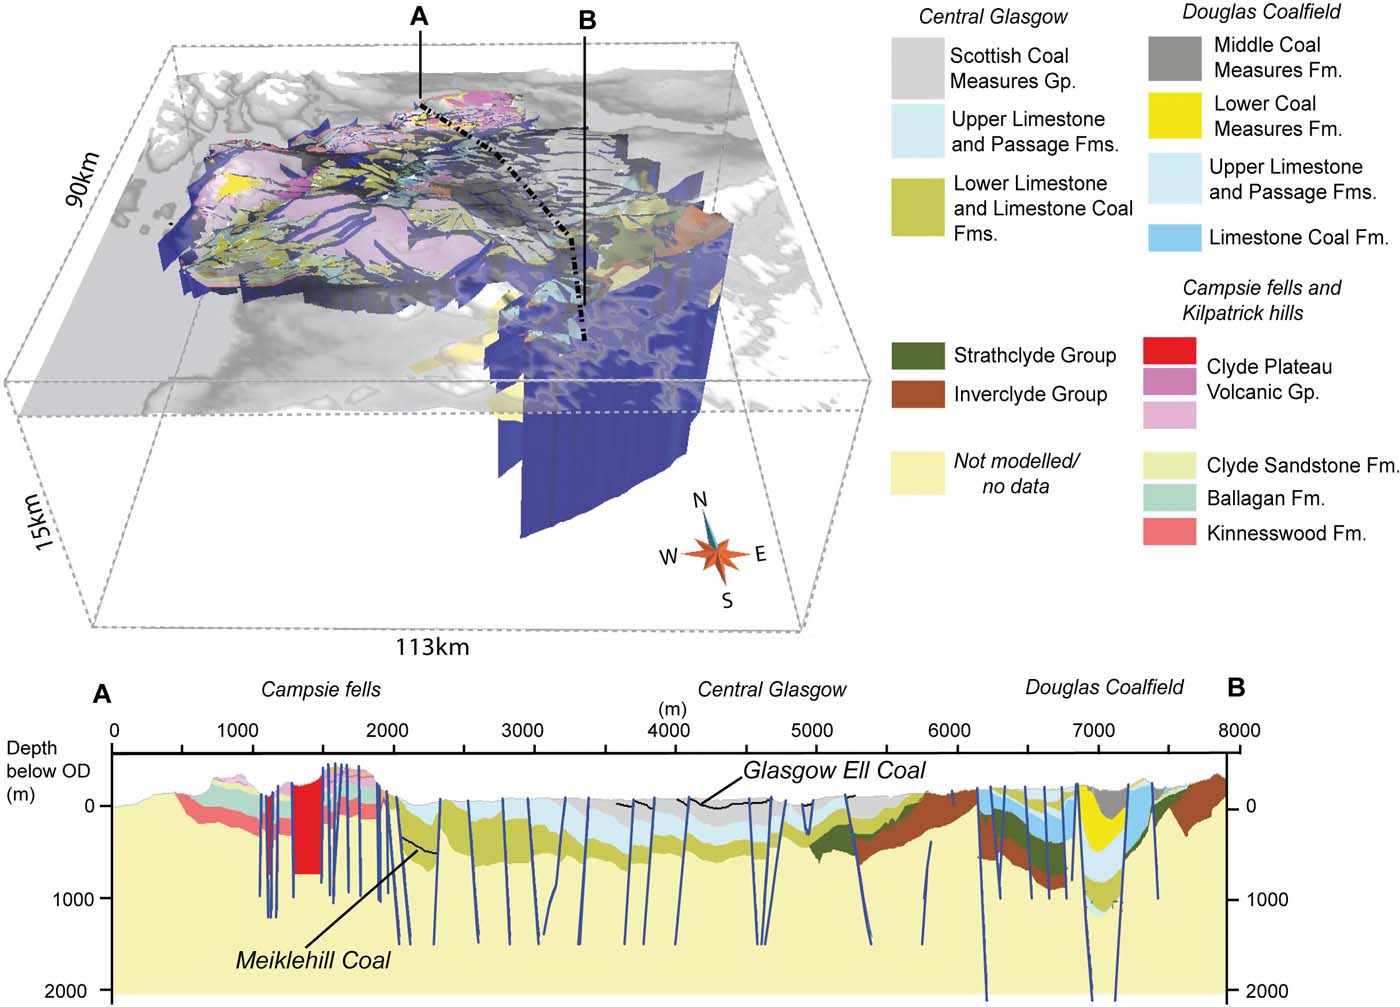
Figure 9 The completed bedrock geology models for the Clyde Catchment. Cross-section running north (a) to south (b) shows the integrated GOCAD® and GSI3D® models across the catchment.
In regions underlain by coal-bearing strata, covering central and eastern areas of the catchment (Fig. 2), the GOCAD® modelling software was used to construct more complex fault geometries and integrate the digitised mine data into the modelling process (cf. Campbell et al. Reference Campbell, Merritt, O Dochartaigh, Mansour, Hughes, Fordyce, Entwisle, Monaghan and Loughlin2010). The GOCAD® modelling package allows geological surfaces, such as the top of a stratigraphic unit or a coal horizon, to be interpolated from a set of control points provided by the borehole picks or mine plan data values and later cut and offset by a series of modelled faults. The GOCAD® modelling software and approach is widely used in the hydrocarbon industry and has been successfully applied to many complicated geological structures (e.g., Zanchi et al. Reference Zanchi, Francesca, Stefano, Simone and Graziano2009; Guyonnet-Benaize et al. Reference Guyonnet-Benaize, Lamarche, Masse, Villeneuve and Viseur2010). Modelled surfaces produced in GSI3D® and GOCAD® can be outputted in compatible data formats to provide a unified bedrock model for most of the Clyde Catchment area. A seamless fit between the GSI3D® and GOCAD® models was achieved by importing the surfaces and control data from the GSI3D® models into GOCAD® and any deficiency in the surfaces manually corrected; while insuring the surfaces still honour the control data.
The bedrock stratigraphy of the Glasgow area is described by Browne et al. (Reference Browne, Dean, Hall, McAdam, Monro and Chisholm1999) and summarised in Figure 8. Key stratigraphic horizons were identified for modelling on the basis of the regional geology, data availability and potential user requirements. In the coal-bearing strata, the uppermost extensively worked coal seam horizons were selected for modelling due to a wealth of mine plan and borehole data (Fig. 8).
In both the GSI3D® and GOCAD® models, only major faults with displacements of greater than 100m, or with surface traces exceeding 500m, were modelled. These correspond with the ‘principal' fault structures depicted on 1:50,000 scale geological maps or recorded in mine plan information. The bedrock model (Fig. 9) consists of a total of 47 separate stratigraphic surfaces and contains 794 individual faults (Fig. 10). The horizons are modelled down to a depth of 1.4km below OD, and the modelled faults cut the entire modelled volume. Fault dips were assigned on the basis of intersection with worked underground coal seams, if available, or from geological map information. The model was constructed in six parts (Fig. 10) including the coalfield areas of Central Glasgow and the Douglas Coalfield, and the predominantly volcanic areas of the Campsie Fells, Kilpatrick Hills, Renfrewshire Hills, Beith–Barrhead and Southern Hills.
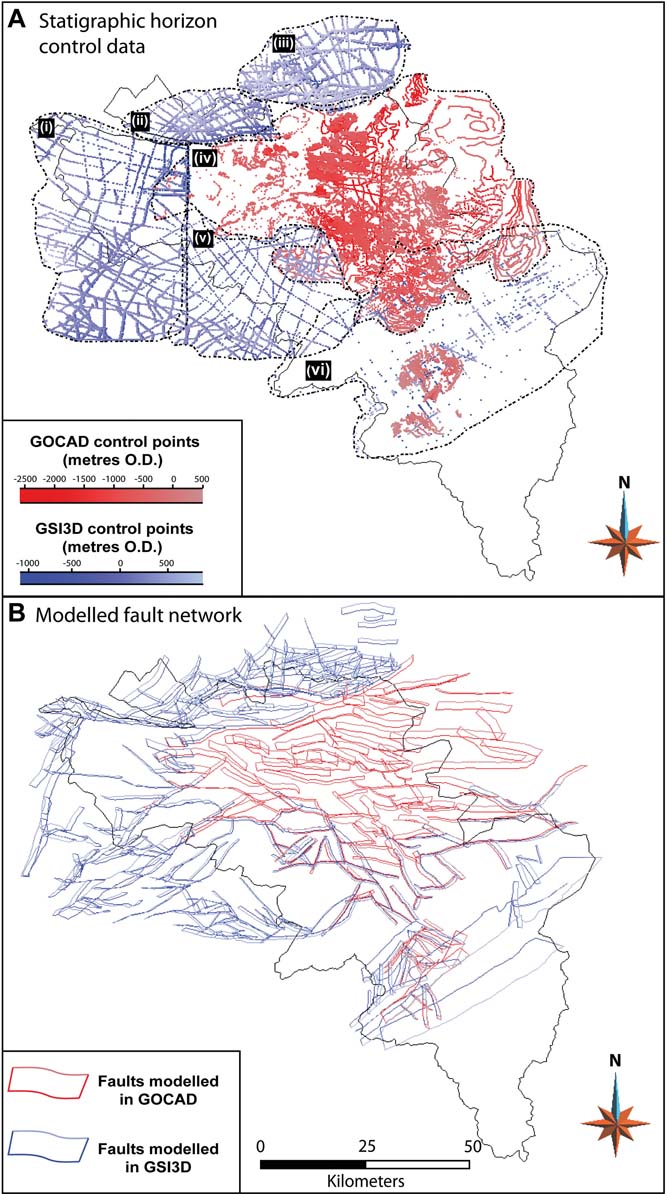
Figure 10 The stratigraphic horizon control point data (a) and the modelled fault network (b) for the bedrock geology model for the Clyde Catchment. Faults and surface control points modelled in GOCAD® (red) and GSI3D® (blue) are shown. The model areas outlined by dashed lines are: (i) Renfrewshire Hills; (ii) Kilpatrick Hills; (iii) Campsie Fells; (iv) Central Glasgow; (v) Beith–Barrhead and Southern Hills; (vi) Douglas Coalfield and Hamilton area.
The GSI3D® component of the bedrock models was constrained by 276 cross-sections, which were built using 24 boreholes and referenced to 12 published cross-sections (British Geological Survey 1970, 1971, 1992, 1993, 1995, 1998, 2002; Francis et al. Reference Francis, Forsythe, Read and Armstrong1970; Craig Reference Craig1980). The GOCAD® components of the bedrock model were constrained by 105,921 control points including borehole picks, mine plan spot heights, outcrop lines and digitised coal seams.
4. New geological findings from the models
This 3D modelling methodology allows for the integration of more data from a greater range of sources than traditional map compilation. 3D modelling methods also contain higher resolution depth information than that which can be portrayed in 2D map formats, allowing more rigorous analysis of the complex spatial relationships between multiple datasets and leading to new discoveries about the nature of the geology under Glasgow.
The superficial deposits Clyde Catchment model was used by Finlayson (Reference Finlayson2012, Reference Finlayson2013) in studies of former glacial processes. The model allowed patterns and volumes of sediment movement to be linked to different stages of ice sheet evolution through an ice sheet growth and decay cycle. The model was also used to calculate the volume of post-glacial sediment, and to demonstrate how these post-glacial sediments can produce errors in quantitative studies of former ice sheet beds. The removal of postglacial sediments results in an increase in measured drumlin length, width and relief, causing an increase in drumlin volume of between 37 % and 119 % and also reconstructed glacier thickness is increased by 5 % (see Finlayson Reference Finlayson2013).
The Greater Glasgow superficial deposits model has been used to characterise deep, sediment-filled troughs known as buried valleys. A buried valley, which is incised into bedrock, lies along the line of the Kelvin Valley to the north of Glasgow (Fig. 11) (Browne et al. Reference Browne and McMillan1986; Browne & McMillan Reference Browne and McMillan1989). Buried valleys are important because they contain sand and gravel deposits up to 80m thick, which can act as important aquifers (Bonsor et al. Reference Bonsor, Entwisle, Watson, Lawrie, Bricker, Campbell, Lawrence, Barron, Hall and Ó Dochartaigh2013). The 3D models allow this valley to be characterised with a higher degree of accuracy than was indicated by the previous ‘drift thickness' engineering geology map for the area (Fig. 11). 3D modelling demonstrates the valley is 15km long and up to 137m deep (to a depth of −79m below OD), and has a markedly undulating base (Fig. 11). The morphology of the buried valley suggests it has a sub-glacial origin, although the processes by which such features are formed remains poorly understood (Campbell et al. Reference Campbell, Merritt, O Dochartaigh, Mansour, Hughes, Fordyce, Entwisle, Monaghan and Loughlin2010).
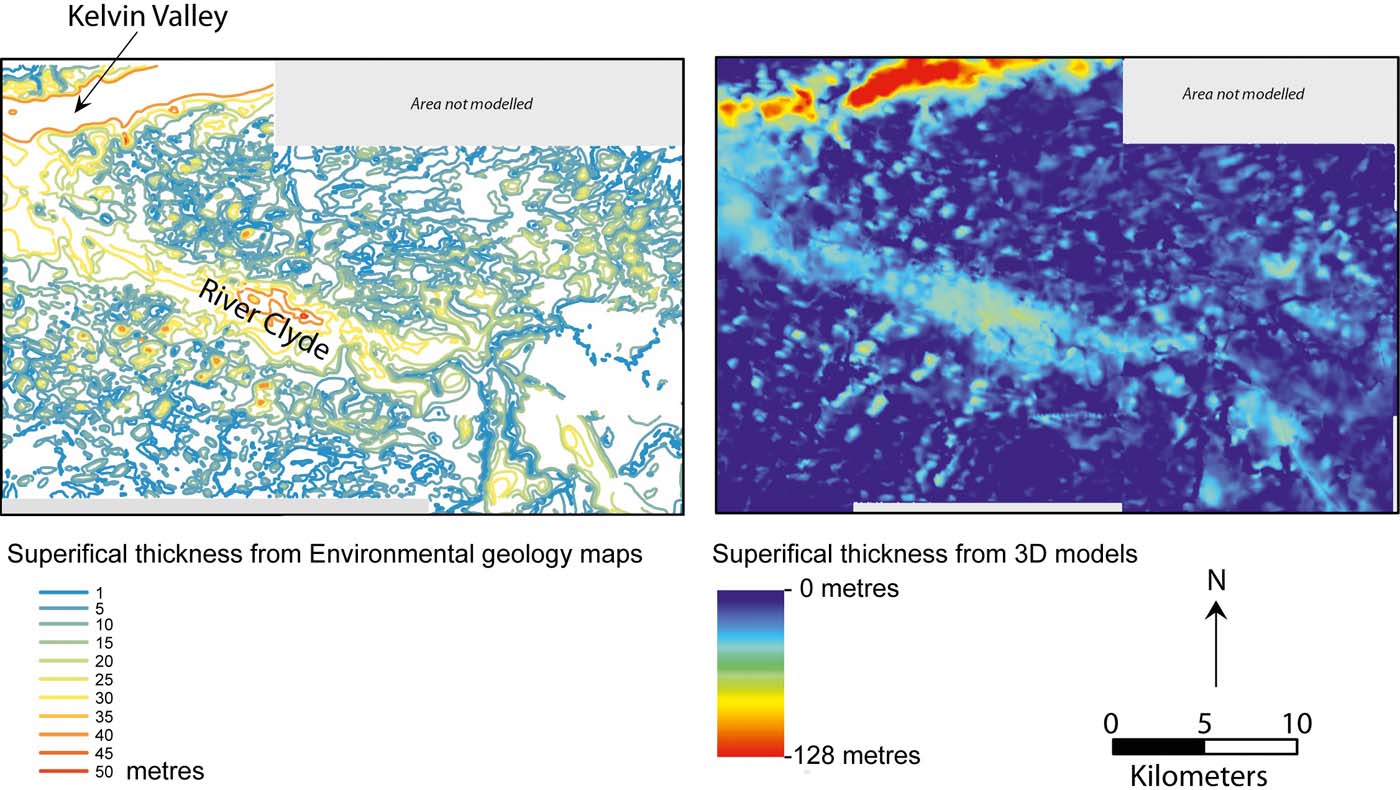
Figure 11 A comparison between the hand-drawn superficial thickness contours from Environmental Geology Maps from 1986 (left), with a gridded superficial thickness data derived from the Greater Glasgow model (right).
The bedrock model of the Clyde Plateau Volcanic Formation and underlying strata has identified an overstepping unconformity, where tilting and erosion of the underlying Clyde Sandstone, Ballagan and Kinnesswood formations means that the Clyde Plateau Volcanic Formation overlies successively older rocks. Millward & Stephenson (Reference Millward and Stephenson2011) identified through the modelling process that a transpressional ‘pop-up' fault duplex structure is forming in a bend on the strike-slip Campsie West Fault. This was discovered by validating the mapped fault traces and displacement in 3D and considering new scientific understanding of the kinematics and timing of the Carboniferous fault systems (e.g., Underhill et al. Reference Underhill, Monaghan and Browne2008). The local uplift of this structure associated with movement of the Campsie West Fault during Carboniferous times provides a mechanism for formation of the unconformity between the Clyde Plateau Volcanic Formation and underlying strata of Early Carboniferous age (Millward & Stephenson Reference Millward and Stephenson2011).
5. Applications and delivery of the 3D models
A key aim for the Glasgow modelling programme was to develop the capabilities for flexible generation of outputs for use in a range of applications from site investigation planning to further numerical analysis. The Glasgow superficial and bedrock models are being used as an input into a wide range of applications (Fig. 12), these include lithological and hydrogeological mathematical models, and as starting points for higher resolution models for site investigations.

Figure 12 Applications and uses of the 3D geological models in the Clyde Catchment.
5.1. Input into higher resolution site-specific geological models
The Glasgow geological model forms a basis for the development of higher resolution geological models for site-specific applications. This has included using the regional model to site ground investigation boreholes across features of interest to the client and ‘cookie- cutting' parts of the regional models and densifying them to include new ground investigation data. This process often refines and alters the regional model to help answer questions specific to the client. This approach has been used to build bespoke models for development projects including construction for sections of the Commonwealth Games site, hosted by the City of Glasgow in 2014 (Campbell et al. Reference Campbell, Merritt, O Dochartaigh, Mansour, Hughes, Fordyce, Entwisle, Monaghan and Loughlin2010); the planning of the Shieldhall Strategic Tunnel; and the Ravenscraig Urban Regeneration project. The bespoke models were developed using input data from the regional bedrock and superficial deposits models, combined with new site investigation data, creating a more detailed local model for the area of interest (Fig. 13).

Figure 13 Multi-scale bedrock model. Left-hand side shows different scales of models: (a) site-specific model; (b) local-scale model; (c) regional-scale model; (d) basin-scale model. Right: a diagram representation of a site-specific model sitting within a regional-scale model. Note the geological complexity increases in the site-specific model due to increased input data, but it retains the broad structures seen in the regional model.
5.2. Parameterising models: lithology and hydrology
The models can be parameterised to enhance their utility for land use planners, civil engineers and hydrogeological applications. Bulk lithological and geotechnical properties were derived for the Glasgow superficial deposits models using the National Geotechnical Properties database and summarised for each geological formation (Merritt et al. Reference Merritt, Entwisle and Monaghan2006; Campbell et al. Reference Campbell, Merritt, O Dochartaigh, Mansour, Hughes, Fordyce, Entwisle, Monaghan and Loughlin2015). These geotechnical properties were used to assign an engineering classification reflecting the bulk characteristics of each unit (Campbell et al. Reference Campbell, Bonsor, Lawrence, Monaghan, Whitbread, Kearsey, Finlayson, Entwisle, Kingdon, Bricker, Fordyce, Barron, Dick and Hay2015).
A more detailed investigation of the lithological variation in highly heterolithic lithostratigraphic units such as the superficial deposits of Central Glasgow has employed a stochastic modelling approach (Kearsey et al. Reference Kearsey, Williams, Finlayson, Williamson, Dobbs, Marchant, Kingdom and Campbell2015). This was used because some of the lithostratigraphic units contain a wide range of lithology, for instance slay, silt, sand, gravel and peat (Table 1). Stochastic modelling was used to refine the lithological distribution within the stratigraphic units. The lithostratigraphic surfaces from the superficial GSI3D models were used as inputs in the stochastic modelling procedure. This method allows the modelling of graded and variable lithological contacts, and provides greater resolution in regard to the lithological heterogeneity of key units than can be reflected in attribution of bulk characteristics alone (Kearsey et al. Reference Kearsey, Williams, Finlayson, Williamson, Dobbs, Marchant, Kingdom and Campbell2015). It was found that only those stratigraphic surfaces that represented an erosional contact were needed to control the stochastic simulation and this improved the ability of the model to predict lithology (see Kearsey et al. Reference Kearsey, Williams, Finlayson, Williamson, Dobbs, Marchant, Kingdom and Campbell2015).
The GSI3D® modelling workflow developed by BGS has been specially designed to interface with hydrological flow modelling software, such as ZOOMQ3D (Merritt et al. Reference Merritt, Monaghan, Entwisle, Hughes, Campbell and Browne2007; Campbell et al. Reference Campbell, Merritt, O Dochartaigh, Mansour, Hughes, Fordyce, Entwisle, Monaghan and Loughlin2010). The Clyde Catchment superficial deposits model has been converted into hydrologically attributed volumes to create a numerical groundwater model for the Clyde Catchment (Campbell et al. Reference Campbell, Merritt, O Dochartaigh, Mansour, Hughes, Fordyce, Entwisle, Monaghan and Loughlin2010). The regional groundwater model is being used in conjunction with the higher-resolution Greater Glasgow superficial deposits model to analyse groundwater flow in the urban areas. The aim of this modelling project is to improve sustainable drainage systems and assess risks related to groundwater flooding (Ó Dochartaigh et al. Reference Ó Dochartaigh, Helen Bonsor and Bricker2018). The Greater Glasgow model is also being used in analysis of hydraulic heads and groundwater fluxes. Bianchi et al. (Reference Bianchi, Kearsey and Kingdon2015) demonstrated that incorporating the modelled lithostratigraphic relationships into groundwater flux analyses increases their accuracy and reduces the uncertainty of predictions in the Glasgow superficial deposits.
5.3. Model delivery
The greatest challenge facing the uptake and use of 3D geological models is how they are delivered to the end user. While 3D models represent a great step forward in the quantity of input data used to construct them and the increased resolution of geological units at depth, when compared with the traditional paper map 3D models may be difficult to orientate and investigate with reference to particular points of interest. While 3D models are often a good way of visualising the geological subsurface, they often lack the detail found in the key of a geological map and are hard to take accurate 2D measurements from. As it is envisaged that 3D models will replace paper maps in the conventional geological engineering ‘desk study' (Culshaw et al. Reference Culshaw, Nathanail, Leeks, Alker, Bridge, Duffy, Fowler, Packman, Swetnam, Wadsworth and Wyatt2006), they must be able to convey the same level of information as a paper map as well as additional features, including the capability to construct cross sections or borehole prognoses anywhere in the model area. Therefore, any model delivery system has to be able to fulfil all these functions.
In Glasgow, the ASK network was established by BGS and Glasgow City Council in part to facilitate the development of data sharing methods for 3D geological data (Campbell et al. Reference Campbell, Bonsor, Lawrence, Monaghan, Whitbread, Kearsey, Finlayson, Entwisle, Kingdon, Bricker, Fordyce, Barron, Dick and Hay2015). The diverse range of partners involved in the network gives rise to challenges in delivering models and model outputs in accessible formats as there is no common geospatial software used by all the partners. However, Internet delivery provides the opportunity to disseminate a wide range of data to both specialist and non-specialist audiences (Culshaw et al. Reference Culshaw, Nathanail, Leeks, Alker, Bridge, Duffy, Fowler, Packman, Swetnam, Wadsworth and Wyatt2006). In recent years, the BGS has increasingly used online delivery mechanisms for products and services, from digital geological maps to Internet browsers (Westhead Reference Westhead2010; Smith & Howard Reference Smith and Howard2012), and increasingly through smartphones and tablet computers (Shelley et al. Reference Shelley, Marchant, Bell and Westhead2011). To facilitate data delivery to the ASK network, a web portal was developed utilising the BGS Groundhog application (Wood et al. Reference Wood, Richmond, Rinchardson and Howcroft2015). This portal allows the models to be viewed over the web and interrogated by means of ‘virtual' cross-sections and boreholes anywhere in the modelled area (Fig. 14).

Figure 14 Auto-generated cross-section and borehole stick through the Greater Glasgow model from BGS Groundhog webviewer. Includes mapping data licensed from Ordnance Survey. © Crown Copyright and/or database right 2017. Licence number 100021290 EU and NEXTMap Britain elevation data from Intermap Technologies.
As Culshaw & Price (Reference Culshaw, Nathanail, Leeks, Alker, Bridge, Duffy, Fowler, Packman, Swetnam, Wadsworth and Wyatt2011) note, not all users of geological information in urban areas want, or need, the same information. The advantage of 3D models over paper maps is that outputs in a range of formats may be readily tailored to the user's needs or interests. In ongoing work between Glasgow City Council and BGS, as part of a Knowledge Exchange fellowship (grant ref. NE/N005368/1), the key geological horizons that provide important subsurface information to help inform planning procedures have been identified in the geological models. For example, in the Greater Glasgow superficial deposits model it was identified that the top of till depth is important when designing foundations for buildings. As a result the models were used to create maps of depth to the top of the till (Fig. 15a). In addition, the occurrence and thickness of buried unconsolidated sand and gravel deposits (Fig. 15b) was important when looking for groundwater resources. It was also identified that subsurface mine workings pose particular problems for development in the Glasgow area, and can affect contaminant migration through the subsurface (Browne et al. Reference Browne, Forsyth and McMillan1986). The 3D bedrock model can be used to derive maps of the known area of worked coal seams and depth to workings from the ground surface (Fig. 15c) and help to highlight areas where coal mining may cause issues for building development. These maps are also of use in assessing the opportunities of using groundwater from abandoned mines for ground-source heat extraction (Campbell et al. Reference Campbell, Merritt, O Dochartaigh, Mansour, Hughes, Fordyce, Entwisle, Monaghan and Loughlin2015). The relative ease with which such maps can be created and tailored to user needs from a single unified 3D model means it is possible to quickly generate outputs customised to answer specific questions that an end user may have of the geology.

Figure 15 Map outputs derived from Glasgow superficial and bedrock models: (a) the occurrence of till in part of the Greater Glasgow area; darker blue highlights the distribution of till at surface and lighter blue indicates distribution of till beneath overlying deposits. The contours indicate depth in metres below ground surface to the top of the till; (b) occurrence of buried sand and gravel deposits in part of the Greater Glasgow area, contours represent the thickness of sand and gravel in metres; (c) Raster grid of a worked coal seam from the 3D model with contours and colour gradation indicating depth below ground surface. The areas highlighted in red indicate shallow workings within 30m of the surface; blue areas indicate deep workings greater than 60m below the ground surface. Includes mapping data licensed from Ordnance Survey. © Crown Copyright and/or database right 2017. Licence number 100021290 EU.
5.4. Model maintenance and update
Information about the urban subsurface changes quickly. Invasive ground investigations, which are the major source of input data for shallow subsurface 3D geological models, regularly generate new data in urban areas. In Glasgow, these data historically came to the BGS in the form of paper records and scans. Digitally capturing these borehole data in databases was a very time-consuming and costly manual process, and has often been the limiting factor in model updates. However, the ASK network, developed by BGS and Glasgow City Council, is transforming digitally the capture of ground investigation data in the Glasgow area (see Bonsor et al. Reference Bonsor, Entwisle, Watson, Lawrie, Bricker, Campbell, Lawrence, Barron, Hall and Ó Dochartaigh2013 for details). A key to this network's success is widespread acceptance of the use of a standardised template (GSPEC) for digital transfer of borehole data, and ingestion, storage and delivery of the data in the industry standard AGS digital format, via a portal managed by BGS (Bonsor et al. Reference Bonsor, Entwisle, Watson, Lawrie, Bricker, Campbell, Lawrence, Barron, Hall and Ó Dochartaigh2013).
This, however, poses a new challenge for updating 3D models as traditionally third party borehole data were assessed against field observations and the understanding that underpins the geological map. The increase in digital borehole data will necessitate the development of novel methods to check the new data against the existing 3D model. This would highlight areas where the new data contradict the existing model and allow the geologist to prioritise updating in those areas.
6. Conclusion
The move from 2D to 3D geological data for Glasgow continues a process of developing geological products for applied uses that began with the Environmental Geology Maps developed by BGS in the 1980s. The modelling methodologies outlined in this paper developed for Glasgow have allowed vast quantities of subsurface data in a range of formats to be readily integrated, improving the resolution of geological units underlying the urban area and the Clyde Catchment. The modelling approach has paved the way for development of a broader range of tailored products to meet the diverse needs of urban user communities. Modelling approaches, therefore, offer more responsive methods for undertaking geological investigations, especially where input data are available in digital formats.
The models described in this work are being utilised by Glasgow City Council to investigate the ground-source heat potential of mine waters and superficial deposit aquifers beneath the Glasgow conurbation, (Glasgow City Council 2010). Understanding how they are being used in this context is helping to refine how the models are delivered to different clients in the future. They are also an invaluable input into other hydrological and property models (Bianchi et al. Reference Bianchi, Kearsey and Kingdon2015; Kearsey et al. Reference Kearsey, Williams, Finlayson, Williamson, Dobbs, Marchant, Kingdom and Campbell2015; Ó Dochartaigh et al. Reference Ó Dochartaigh, Helen Bonsor and Bricker2018).
The digital nature of all of the data used to create the models, and the models themselves means that unlike the paper map, the 3D model is not the end point, but rather the beginning. The models, and the data used to create them, can be easily recombined and displayed in a range of formats. The models may also be revised to include new data as they become available. Geological model development, validation, testing and future improvement, relies on the availability of sufficient high quality digital data. The benefits conveyed by 3D geological models can only be realised following considerable investment in the digitisation of historic records, and/or the capture of new digital data using rigorous and consistent methodologies.
7. Acknowledgements
We thank Dr J. Schokker and Dr K. MacCormack for their critical comments on the manuscript. Helen Bonsor, Joanne Merritt, Tony Irving and Mike Browne are thanked for their involvement and discussions on various aspects of this study. This paper was funded by NERC National Capability funding, and is published with the permission of the Executive Director, British Geological Survey (NERC). BGS/NERC reference: PRP17/036.


