INTRODUCTION
Since the seminal work of W. E. B. Du Bois (Reference Du Bois1899) and Clifford Shaw and Henry McKay (1942), sociologists have grappled with striking ethnoracial inequality in neighborhood crime, especially dramatically higher rates in non-White than White areas. Predominant accounts link urban racial inequality in the distribution of crime to differential structural conditions in neighborhoods (Peterson and Krivo, Reference Peterson and Krivo2010a; Sampson and Wilson, Reference Sampson, Wilson, Hagan and Peterson1995; Shaw and McKay, Reference Shaw and McKay1942). The divergent social worlds of White and non-White neighborhoods, brought about by enduring racial residential segregation and discrimination, largely explain why violent crime rates are typically two to five times higher in minority than White communities (Peterson and Krivo, Reference Peterson and Krivo2010a; Sampson Reference Sampson2012). Yet, research on ethnoracial inequality in neighborhood crime focuses largely on cross-sectional correlates of violent and property crime rather than change over time, despite the centrality of structural change for social disorganization and urban ecology models (Fagan Reference Fagan, Goldberger and Rosenfeld2008; Kirk and Laub, Reference Kirk and Laub2010; Park and Burgess, Reference Park and Burgess1921; Stults Reference Stults2010).
The socioeconomic upheaval of the last decade, coupled with the national crime drop, draw attention to the inadequacy of static explorations of race/ethnicity and neighborhood crime. The Great Recession and the concomitant housing crisis substantially increased poverty, foreclosures, vacancies, and unemployment in most communities (Baumer et al., Reference Baumer, Wolff and Arnio2012; Owens and Sampson, Reference Owens and Sampson2013). However, the downturn hit Black, Latino, and immigrant communities particularly hard (Owens and Sampson, Reference Owens and Sampson2013). We know little though about whether and how recent dramatic shifts in the fortunes of U.S. neighborhoods influenced the ethnoracial patterning of crime. Nor do we know if the economic crisis altered the “Great Crime Decline,” whereby crime fell nationally after the early 1990s (see Blumstein and Rosenfeld, Reference Blumstein and Rosenfeld1998; Zimring Reference Zimring2007). Did crime decline after 2000 in all neighborhoods despite the recession? Or, did crime decrease less or even increase in non-White and economically marginalized communities that bore the brunt of the Great Recession? Finally, did initial disparities and changes in crime-producing conditions since the start of the twenty-first century set communities on divergent crime trajectories?
To address these questions, we examine the dynamics of violent and property crime within neighborhoods between 1999 and 2013. We use group-based trajectory models (Apel Reference Apel, Bruinsma and Weisburd2014) to determine if there are distinct clusters of neighborhoods that follow similar trends in homicide and burglary—the most serious forms of violent and property crime, respectively—across a large sample of neighborhoods. We then model the social structural predictors of distinct crime trajectories. Our analyses make three contributions. First, we interrogate whether patterns of change in crime differ by ethnoracial neighborhood composition. Some work indicates that minority neighborhoods benefited the most from the crime decline (Friedson and Sharkey, Reference Friedson and Sharkey2015) while other studies suggest that minority neighborhoods are vulnerable to crime increases especially during a period of economic tumult (Stults Reference Stults2010; Weisburd et al., Reference Weisburd, Bushway, Lum and Yang2004). We evaluate these alternatives to assess whether inequalities in the ethnoracial and spatial distribution of serious crime endured or declined during a period of changing neighborhood conditions. Second, we move beyond prior studies that largely describe neighborhood crime trajectories (see Baumer et al., Reference Baumer, Vélez and Rosenfeld2018 for a review) to predict distinct patterns of within-neighborhood change. Our framework integrates insights from urban inequality and community crime research highlighting how socioeconomic conditions, housing instability, and ethnoracial composition shaped neighborhood violent and property crime trends before, during, and after the Great Recession. This approach allows us to assess the implications of inequities in community circumstances across space and time for the racial-spatial divide in crime.
Third, criminologists have explored the contours of the national crime drop, yet we know little about how the crime decline plays out across local communities. Some research explores this issue, but with rare exceptions (e.g., Ellen and O’Regan, Reference Ellen and O’Regan2009; Friedson and Sharkey, Reference Friedson and Sharkey2015) longitudinal studies of neighborhood crime focus on areas within one city, such as Seattle (e.g., Groff et al., Reference Groff, Weisburd and Yang2010; Weisburd et al., Reference Weisburd, Bushway, Lum and Yang2004; Yang Reference Yang2010) or Chicago (Griffiths and Chavez, Reference Griffiths and Chavez2004). Single-city studies generally support contentions about the spatial breadth of the crime decline, finding that although many neighborhoods have stable crime rates, those that do change have declining levels since 1990 (Andresen et al., Reference Andresen, Curman and Linning2017; Curman et al., Reference Curman, Andresen and Brantingham2015; Wheeler et al., Reference Wheeler, Worden and McLean2016). However, large differences across cities in levels of crime, experiences during and after the Great Recession, and the degree of ethnoracial inequality raise the possibility that neighborhood crime patterns for one city do not generalize to others (Hyra and Rugh, Reference Hyra and Rugh2016). We examine a unique dataset that includes almost 2700 neighborhoods across eighteen large cities with varying ethnoracial compositions, socioeconomic conditions, and regional locations to begin drawing broader conclusions about the local dynamics of crime.
STABILITY AND CHANGE IN THE SOURCES OF NEIGHBORHOOD CRIME
Serious crime in the United States clusters in a small portion of communities in ways that are highly racialized (Peterson and Krivo, Reference Peterson and Krivo2010a; Sampson Reference Sampson2012; Shaw and McKay, Reference Shaw and McKay1942). Urban scholars trace the stark ethnoracial patterning of crime to the divergent social structural conditions of minority versus White neighborhoods (Peterson and Krivo, Reference Peterson and Krivo2010a; Sampson and Wilson, Reference Sampson, Wilson, Hagan and Peterson1995; Shaw and McKay, Reference Shaw and McKay1942; Wilson Reference Wilson1987). Racial residential segregation serves as a prominent force that fosters a hierarchical distribution of socioeconomic resources across place whereby Black, and to a lesser extent Latino, neighborhoods are typically far more disadvantaged than White neighborhoods (Peterson and Krivo, Reference Peterson and Krivo2010a). Data from the National Neighborhood Crime Study show startling ethnoracial differences in levels of disadvantage: only 5.4% of all White neighborhoods have levels as high as those found in 89% of predominantly Black areas and 87% of Latino areas (Peterson and Krivo, Reference Peterson and Krivo2010a). Scholars theorize that disadvantaged conditions exacerbate social and geographic isolation from mainstream society, including access to employment, conventional role models, and political elites and services. Consequently, isolation should diminish the capacity of neighborhoods to come together and control crime, and/or facilitate normative processes that encourage crime (Peterson and Krivo, Reference Peterson and Krivo2010a; Sampson Reference Sampson2012; Sampson and Wilson, Reference Sampson, Wilson, Hagan and Peterson1995).
Accounting for inequality in structural conditions explains a substantial portion of the ethnoracial divide in neighborhood crime (Peterson and Krivo, Reference Peterson and Krivo2010a). However, research neglects how ethnoracial inequality in local crime changes over time, regardless of clear evidence that urban ecologies continually evolve, raising the possibility that inequalities in neighborhood crime may shift over time as the forces that undergird crime change. Understanding these dynamic patterns requires moving beyond cross-sectional between-neighborhood comparisons to explore within-neighborhood change in local social structural conditions and crime.
The paucity of longitudinal neighborhood data deters dynamic analyses of the spatial distribution of crime. Yet an equally important barrier is the assumption that ecological processes related to crime are relatively stable. This notion is based on Shaw and McKay’s (1942) between-neighborhood comparisons in Chicago, which revealed similar rankings in crime levels throughout the early twentieth century despite shifts in ethnoracial composition and other demographics (Kirk and Laub, Reference Kirk and Laub2010).
Some work in the ecological tradition, however, questions the relevance of the stability thesis after the 1950s. For example, Leo Schuerman and Solomon Kobrin (Reference Schuerman and Kobrin1986) uncovered that some Los Angeles neighborhoods transformed from being virtually crime free in 1950 into high crime neighborhoods in 1970 due to structural deterioration. Robert Bursik and Jim Webb (Reference Bursik and Webb1982) demonstrated stability in the relative distribution of crime in Chicago neighborhoods prior to 1950. Yet, between 1950 and 1970 unexpected changes in household density and the non-White and foreign-born populations altered the relative concentration of neighborhood delinquency. Both Schuerman and Kobrin’s (Reference Schuerman and Kobrin1986) and Bursik and Webb’s (Reference Bursik and Webb1982) comparisons demonstrate that the relative order of neighborhood crime/delinquency rates can shift as local and broader social conditions change during particular historical periods.
The Dynamics of the New Millennium
The context of social and economic disruption since the turn of the twenty-first century warrants a dynamic approach to appreciate the interrelationships between neighborhood crime and ethnoracial inequality. This approach must take into account that as social and economic conditions within local areas shift, levels of crime within individual neighborhoods may change. Whereas work rooted in Shaw and McKay (Reference Shaw and McKay1942) focuses on between-neighborhood comparisons to examine stability or change in the relative ranking of crime rates, we employ a within-neighborhood framework to explore how and why neighborhoods change internally over time in the new century. A within-neighborhood approach allows for the possibility that crime can increase (or decrease) in neighborhoods without necessarily affecting the rank ordering of crime levels.
Since the 2000s, two trends are particularly relevant: shifting socioeconomic inequalities across place and the national crime drop. Neighborhood inequality deepened across many domains that are consequential for neighborhood crime. Although poverty concentration across neighborhoods decreased during the 1990s, the Great Recession undermined this progress (Iceland and Hernandez, Reference Iceland and Hernandez2016; Jargowsky Reference Jargowsky2014). The number of high-poverty tracts increased by 50% from 2000 to 2010 and, pockets of poverty are more widespread than ever before (Jargowsky Reference Jargowsky2014). The recession also adversely affected levels of unemployment (Owens and Sampson, Reference Owens and Sampson2013). Minority and immigrant neighborhoods were hardest hit partly because they began the millennium with higher levels of disadvantage than White neighborhoods (Owens and Sampson, Reference Owens and Sampson2013).
The Great Recession increased housing instability, as seen in rising home foreclosures and vacancy rates. Widely considered a precipitating force of the subsequent housing crisis (Baumer et al., Reference Baumer, Wolff and Arnio2012; Mian et al., Reference Mian, Sufi and Trebbi2015), the dramatic surge in foreclosures during the mid-to-late 2000s was highly racialized, impacting neighborhoods with large shares of Blacks and Latinos most severely (Hall et al., Reference Hall, Crowder and Spring2015; Rugh and Massey, Reference Rugh and Massey2010). Racial segregation facilitated predatory and subprime lending that targeted minority populations and neighborhoods. Between 2005 and 2012, predominantly Latino or Black neighborhoods had about eight more foreclosures per 100 housing units than White neighborhoods, and about half of minority neighborhoods were characterized as having very high foreclosures rates (Hall et al., Reference Hall, Crowder and Spring2015).
The demographic landscape also changed extensively during the 2000s. Many cities increasingly diversified as immigration and White flight continued; global neighborhoods arose where Latinos, Asians, Whites, and Blacks live side by side (Logan and Zhang, Reference Logan and Zhang2010). Still, ethnoracial segregation remains entrenched: 50% of Blacks and 40% of Latinos live in neighborhoods with very few Whites (Logan and Zhang, Reference Logan and Zhang2010). This shifting landscape sustains a separate but unequal urban geography in which minority, but not global, neighborhoods experience a myriad of disadvantages including limited access to quality schools, jobs, and connections to larger opportunity structures (Logan and Zhang, Reference Logan and Zhang2011).
These socioeconomic, housing, and demographic shifts occurred alongside decreasing crime (Zimring Reference Zimring2007). This crime decline is well documented at the national and city levels (Baumer et al., Reference Baumer, Vélez and Rosenfeld2018), although the downward trend within cities depends upon the time period (Baumer and Wolff, Reference Baumer and Wolff2014; McDowall and Loftin, Reference McDowall and Loftin2009). Few studies examine the crime drop within neighborhoods, and thus, the consequences of the crime decline for the ethnoracial patterning of neighborhood crime are unclear.
Nonetheless, preliminary insights into local patterns of change are discernible from the small number of neighborhood crime trajectory studies. Despite the national crime decline, single city studies typically find that most neighborhoods have relatively stable crime rates that begin and persist at low levels. For instance, between 1989 and 2002, 84% of Seattle street segments had low and stable crime change (Weisburd et al, Reference Weisburd, Bushway, Lum and Yang2004; see also Griffiths and Chavez, Reference Griffiths and Chavez2004). Similar trends are found in Vancouver (Andresen et al., Reference Andresen, Curman and Linning2017; Curman et al., Reference Curman, Andresen and Brantingham2015) and Albany (Wheeler et al., Reference Wheeler, Worden and McLean2016).
A smaller percentage of neighborhoods experienced notable change in crime. Typically, such change reflects the national trend of decreasing crime. For instance, Elizabeth Griffiths and Jorge Chavez (Reference Chavez and Griffiths2004) found that non-gun related homicides declined in about 48% of Chicago tracts for the period 1980 to 1995. David Weisburd and colleagues (2004) demonstrate that crime decreased between 1989 and 2002 in 14% of street segments in Seattle. Notably, Michael Friedson and Patrick Sharkey (2015) show that between 1990 and 2012 serious crime decreased in most neighborhoods in Chicago, Cleveland, Denver, Philadelphia, Seattle, and St. Petersburg.
Increasing crime trajectories are less common, but this varies across time periods. There are more neighborhoods with increasing trajectories in earlier periods. In Chicago, homicide increased in about 50% of tracts between 1965 and 1995 and nearly 40% of tracts between 1980 and 1995 (Griffiths and Chavez, Reference Griffiths and Chavez2004; Stults Reference Stults2010). However, studies after 1990 find only a few areas with increasing neighborhood crime (Weisburd et al., Reference Weisburd, Bushway, Lum and Yang2004), or find none at all (Andresen et al., Reference Andresen, Curman and Linning2017; Curman et al., Reference Curman, Andresen and Brantingham2015; Wheeler et al., Reference Wheeler, Worden and McLean2016).
Explaining Neighborhood Crime Trends
We derive expectations about the social and economic drivers of neighborhood crime trajectories from a range of prior research and perspectives. Socioeconomic disadvantage is the most consistent predictor of differences in crime between neighborhoods at various points in time. High and rising levels of disadvantage are also associated with increasing neighborhood crime. For example, in Chicago, higher initial levels and increases in disadvantage augmented the odds that census tracts had increasing or persistently high rather than declining homicide rates from 1965 through 1995 (Stults Reference Stults2010). Thus, we expect that both initially high and growing levels of disadvantage are linked with trajectories that diverge from the crime drop—increasing the likelihood of showing stable or increasing crime rates.
The consequences of high and rising disadvantage for ethnoracial inequality in neighborhood crime are less clear. To the extent that the most disadvantaged and non-White neighborhoods experienced the greatest benefits from the crime decline (Friedson and Sharkey, Reference Friedson and Sharkey2015), ethnoracial differences in the spatial distribution of crime would be reduced. However, given that non-White neighborhoods disproportionately felt the burden of the Great Recession (Hyra and Rugh, Reference Hyra and Rugh2016; Owens and Sampson, Reference Owens and Sampson2013), we expect that declining crime was more common in affluent and White than other areas and more likely stalled or reversed in disadvantaged and non-White areas.
In light of the housing crisis, we also anticipate that changes in housing instability, particularly rising vacancies and foreclosures, set the stage for divergent neighborhood crime trajectories. Vacant housing and foreclosed properties can increase criminal opportunities by signaling a lack of informal social control to motivated offenders and serving as sites for criminal behavior such as drug dealing and storage of stolen goods. Vacant and foreclosed properties are signs of physical disorder, which may precipitate a spiral of neighborhood decline toward disinvestment and increasing crime (Skogan Reference Skogan1990). In fact, Brian Stults (Reference Stults2010) found that initially higher vacancy rates made Chicago neighborhoods vulnerable to increasing homicide trajectories from 1965 to 1995. Studies have also shown that housing foreclosures increase neighborhood crime either directly (Ellen et al., Reference Ellen, Lacoe and Sharygin2013; Immergluck and Smith, Reference Immergluck and Smith2006) or indirectly through rising vacancies (Cui and Walsh, Reference Cui and Walsh2015). The racially inequitable distribution of the housing crisis (Hall et al., Reference Hall, Crowder and Spring2015) could have made Black and Latino neighborhoods particularly vulnerable to increases in violent and property crime, despite the national crime decline.
Demographic characteristics may also account for changing neighborhood crime patterns. We pay particular attention to population loss and ethnoracial composition and change. Population loss is often an indicator of neighborhood decline (Skogan Reference Skogan1990; Wilson Reference Wilson1987). Neighborhood depopulation can signal that those with resources are abandoning the area. As people leave, the capacity to deal with problems and take care of the neighborhood diminishes. Therefore, population loss likely leads to increasing rather than decreasing crime trajectories.
Neighborhoods with growing and/or predominantly Black and Latino populations often have a constellation of disadvantages that are not well captured with census measures. These include inadequate institutions, poor city services, and local disinvestments from long-term and continued discriminatory government and private sector practices (Logan and Zhang, Reference Logan and Zhang2011). As a result, growth in the minority population may correspond with increasing as opposed to declining or stable neighborhood crime trajectories. In contrast, given its role in reducing crime (Lyons et al., Reference Lyons, Vélez and Santoro2013), the foreign-born population should be associated with declining neighborhood crime trajectories. Stults (Reference Stults2010) found that increases in the foreign-born population protect neighborhoods from increases in homicide (see also Chavez and Griffiths, Reference Chavez and Griffiths2009).
In sum, we expect that dramatic changes in the structural factors underlying neighborhood crime since the turn of the twenty-first century led to variable patterns of crime change within local communities. Specifically, we predict that neighborhoods with higher initial and growing levels of disadvantage, housing instability, population loss, minority populations, and decreasing levels of recent foreign-born residents were vulnerable to increases or slower declines in crime. Of central concern is the disproportionate harm from the Great Recession felt in minority and disadvantaged areas and how this may yield rising crime in such areas. Moving beyond studies that compare change between neighborhoods or examine within-neighborhood change within a single city, we explore these possibilities with unprecedented longitudinal data on neighborhoods across multiple cities.
DATA AND METHODS
Data and Sample
We use data for neighborhoods (census tracts) in eighteen cities with populations over 100,000 (in 2000) to examine changes in neighborhood homicide and burglary rates from 1999 to 2013. The eighteen cities are a subset of places in the National Neighborhood Crime Study (NNCS), which provides crime and sociodemographic data for census tracts within a nationally representative sample of ninety-one U.S. cities (Peterson and Krivo, Reference Peterson and Krivo2010b). Census tract data in the current study include: (1) reported homicide and burglary counts for 1999–2001 obtained from police departments in the NNCS; (2) reported homicide and burglary counts for 2002–2013 provided by police departments in a follow-up studyFootnote 1; (3) socioeconomic and demographic characteristics for 2000 from the NNCS and 2008–2012 from the American Community Survey; and (4) proprietary information on housing foreclosures from RealtyTrac. Our sample includes 2693 census tracts with populations of at least 300 and no more than 50% of residents in group quarters in both 2000 and 2008–2012.Footnote 2 Data are normalized around 2010 census tract boundaries (Logan et al., Reference Logan, Xu and Stults2014). The number of tracts ranges from twenty-six in Carrollton, Texas to 785 in Chicago.Footnote 3
The cities in our analyses vary substantially in size, poverty rates, racial/ethnic composition, immigrant presence, racial residential segregation, and regional location. Their 2008–2012 populations range from just over 120,000 in Carrollton to over one million in Dallas, San Diego, and Chicago. Poverty rates average 18.6%, but are below 10% in four places and over 20% in seven cities. Vacancy rates, an indicator of housing instability and a key concern during our study period, are as low as 3% in Simi Valley but are over 20% in Dayton, Cleveland, and St. Louis. Our sample includes hypersegregated (Massey and Tannen, Reference Massey and Tannen2015), multiethnic (Logan and Zhang, Reference Logan and Zhang2011), and predominantly White cities.
Dependent Variables
Our initial analyses identify trajectories of tract change for yearly levels of homicides and burglaries for 1999–2013.Footnote 4 For homicides, which are rare events in census tracts, we use annual counts as the outcome with population for the year as an exposure variable (Osgood Reference Osgood2000). For burglaries, the dependent variable is an annual rate per 1000 population (logged for skewness). Annual populations for the exposure variable and the denominators for rates are derived from 2000 (summary file 3) and 2010 (summary file 1) census data; we apply linear interpolation/extrapolation to estimate tract populations for non-census years. The interdecade (2000–2013) correlations for homicide and burglary are only .39 and .60, respectively, indicating considerable variability in changing crime patterns. We identified trajectories (see analytic strategy below) to create multicategory variables that serve as outcomes for our second set of analyses. These measures indicate the particular pattern of change in homicides and in burglaries that occurred within each census tract between 1999 and 2013. We analyze homicides and burglaries because they are the most serious forms of violent and property crime, respectively, and they are reliably collected by the police (Baumer et al., Reference Baumer, Vélez and Rosenfeld2018; Blumstein Reference Blumstein1974).
Independent Variables
We predict the form of change in homicide and burglary within tracts with initial levels (circa 2000) and changes in indicators of socioeconomic disadvantage, housing instability, and demographic composition. We calculate change as the difference in values between 2000 and 2008–2012 (with the exception of foreclosures, which are measured for 1999 and change between 1999 and 2013 due to data availability). Disadvantage is an index (average z-scores) combining joblessness (percentage of the population aged sixteen to sixty-four who are unemployed or out of work), professional workers (percentage of employed civilians age sixteen and over in management, professional, and related occupations; reverse coded), the percentage of adults (age twenty-five and over) who are high school graduates (reverse coded), the percentage of households that are female-headed families, secondary sector workers (percentage of employed persons age sixteen and over in the six occupations with the lowest average wages), and the poverty rate (α = .937 for 2000 and α =.915 for 2008–2012).Footnote 5 We measure housing instability with rates of foreclosure and housing vacancy. The foreclosure rate (logged for skewness) is the number of foreclosures per 1000 total housing units (Baumer et al., Reference Baumer, Wolff and Arnio2012).Footnote 6 Foreclosures include only completed transactions in which the bank repossessed, sold, or auctioned a property within the year.Footnote 7 We standardize foreclosures relative to all housing units to reflect its prevalence relative to overall housing availability. RealtyTrac, a widely used supplier of foreclosure data (Baumer et al., Reference Baumer, Wolff and Arnio2012), provided census tract locations for all foreclosures using 2010 census boundaries. The vacancy rate is the percentage of total housing units that are vacant. The percentage of the population that is non-Hispanic Black and the percentage that is Latino indicate neighborhood racial/ethnic composition. Recent immigration is the percentage of the population in 2000 (or 2008–2012) that is foreign-born and entered the United States between 1990 and 2000 (or between 2000 and 2012). Finally, we include total population size (logged) and control for the percentage of the population that is both male and aged fifteen to twenty-four.
Table 1 presents the means for all variables. On average, neighborhood murder and burglary rates declined by about 15% each between 1999 and 2013 following national patterns. Socioeconomic disadvantage and housing instability (foreclosures and vacancy) were notably higher at time two than time one. While the percentages of Blacks and recent immigrants declined slightly on average, the relative size of the Latino population and neighborhood population size increased.
Table 1. Descriptive Statistics for Crime and Independent Variables

a Time 1 is 1999 and Time 2 is 2013 for Murder, Burglary, and Foreclosure Rates, and 2000 and 2008/2012 for all other variables.
N = 2,693 tracts, across 18 cities
** p <. 000; * p < .05
Analytic Strategy
We investigate whether there are distinct patterns of change over time in crime levels using semiparametric group-based trajectory models, a widely used method for categorizing patterns of change (Apel Reference Apel, Bruinsma and Weisburd2014). Trajectory modeling allows us to determine whether multiple distinct subpopulations of census tracts follow unique trajectories of change that can vary in functional form (i.e., linear, quadratic or cubic) for each crime. This method is suited for addressing whether neighborhoods differ in their experiences of the crime decline. For homicides, which are rare events, we use a zero-inflated Poisson specification with yearly tract population as an exposure variable. Burglaries are modeled as logged rates using the censored normal distribution. We compare Bayesian Information Criterion (BIC) fit statistics between models to determine the best fitting number of groups and linear versus nonlinear patterns of change for each crime (Raftery Reference Raftery1995).Footnote 8 Models are estimated using the traj module in Stata 14 (Jones and Nagin, Reference Jones and Nagin2013).
After identifying neighborhood homicide and burglary trajectories, we predict trajectory group membership (a multicategory outcome) based on levels and changes in neighborhood conditions. We use multinomial logistic regression with random effects by city to estimate the effects of socioeconomic conditions, housing instability, and demographics on trajectory group membership. The random effects model specifies that errors within cities are correlated, thereby adjusting for clustering of tracts and accounting for random differences across cities affecting tract homicide and burglary rates. This model assumes that city errors are generated from a common distribution.Footnote 9
RESULTS
Patterns of Neighborhood Crime Change
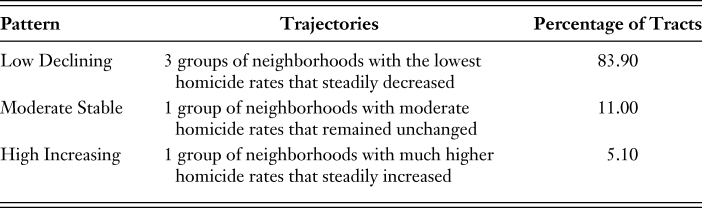
Have all neighborhoods experienced declining violent and property crime during the socioeconomically volatile period since 2000? We estimate group-based trajectory models to address this question. The best fitting model identifies six distinct homicide trajectories. To clarify substantive patterns, we further classify these into three categories of homicide change: low declining, moderate stable, and high increasing homicides.Footnote 10 Table 2 summarizes these substantive categories and the distribution of census tracts across them. Three groups of neighborhoods show significant decreases in homicide over the fifteen years; these groups also had relatively few murders in 1999 and differ mainly in how low levels were initially. This pattern of low and declining homicide is extremely common (84% of neighborhoods). Contrary to the crime drop, nearly three-hundred tracts, 11% of the sample, had relatively stable and moderate homicide levels over the fifteen years. An additional 5% of neighborhoods had high homicide in 1999 and witnessed murders climb significantly throughout this period (n = 140).
Table 2. Summary Patterns for Homicide Trajectories
For burglary, the best fitting model identifies twelve trajectories. We grouped these trajectories into four substantively meaningful patterns of change (Table 3). A substantial portion of our sample experienced declines in burglary (about 70%). There are, however, distinct types of burglary decline. The first includes two trajectories with low burglary rates that steadily decreased between 1999 and 2013. These 238 neighborhoods (about 9% of tracts) had the lowest rates of all areas in 1999 and in 2013. In the second and more common pattern (about 45% of tracts), burglary rates were moderate in 1999 and declined slowly over time. The three trajectories with this declining pattern have somewhat different rates throughout the period but the gap between them remains the same.
Table 3. Summary Patterns for Burglary Trajectories
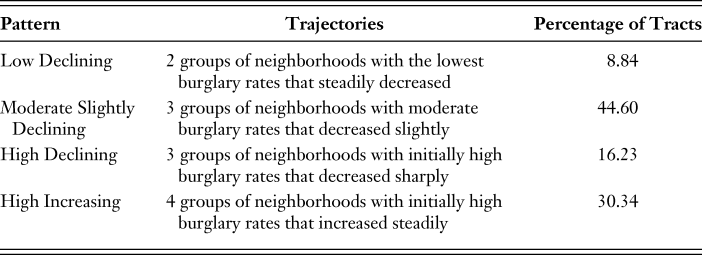
The last two types of burglary change are for the remaining nearly half of all neighborhoods where rates were high in 1999 but diverged subsequently.Footnote 11 Burglary rates declined from high levels in just over 16% of areas, while rates increased substantially in a striking 30% of neighborhoods. The high and increasing group of neighborhoods is noteworthy because it runs counter to an overall decline in the national burglary rate between 1999 and 2013 (Federal Bureau of Investigation 2016). It also suggests that neighborhoods with similar initial high rates may have experienced divergent fortunes that led to heightened, rather than reduced, property crime fifteen years later.
Race, Community Conditions, and Patterns of Neighborhood Crime Change
A central concern is whether changes in neighborhood crime in the 2000s are stratified by racial/ethnic composition. Figures 1 and 2 present the distributions of census tracts across five ethnoracial neighborhoods types for the substantive patterns of homicide and burglary change, respectively. Non-Latino White (n = 920), non-Latino Black (n = 500), and Latino neighborhoods (n = 177) have at least 70% of residents in 2000 in the respective populations. For Minority neighborhoods (n = 179), the population is 70% or more non-Latino Black or Latino, although neither group alone is that large. Integrated areas (n = 917) have any other ethnoracial mix.
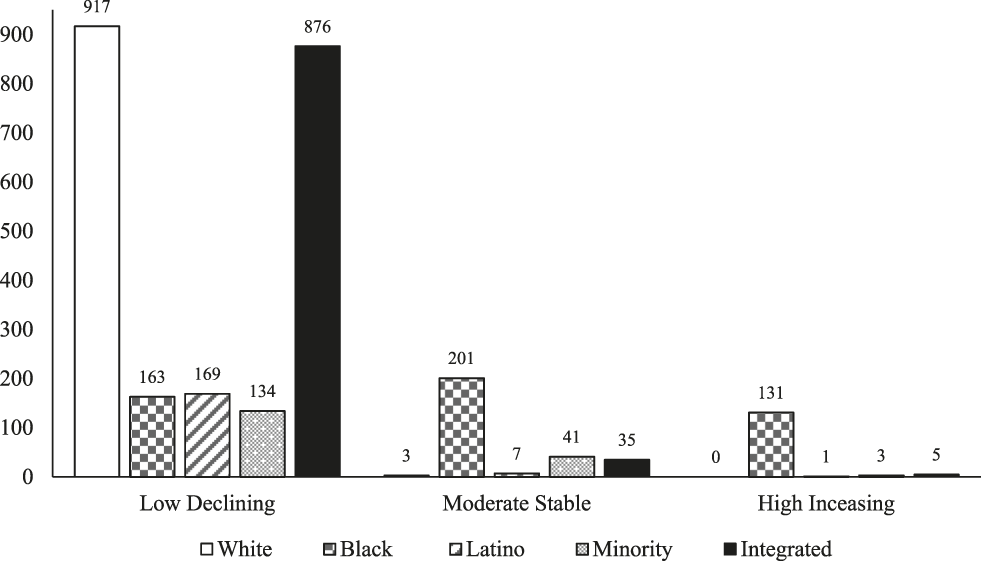
Fig. 1. Homicide Groups by Ethno-Racial Neighborhood Type
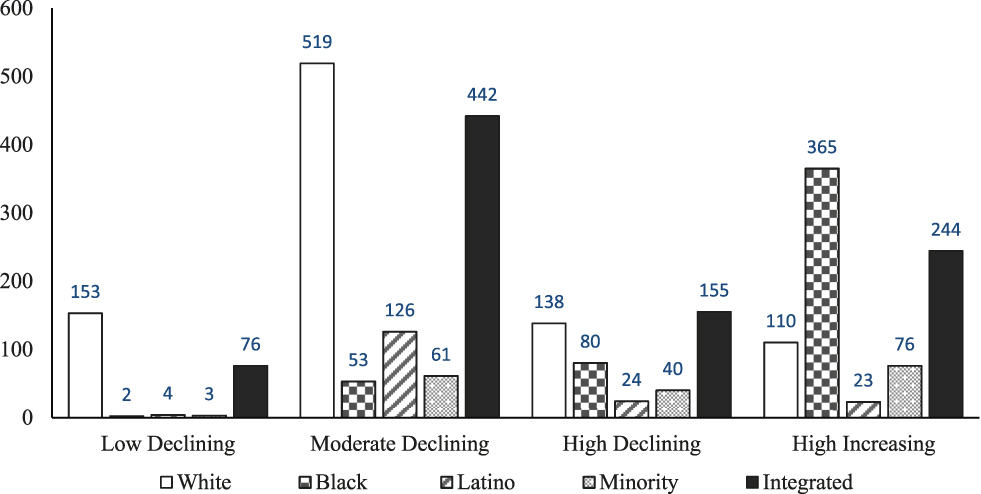
Fig. 2. Burglary Groups by Ethno-Racial Neighborhood Type
Ethnoracial neighborhood inequalities in homicide trends in Figure 1 are dramatic. Although homicide declined in most neighborhoods between 1999 and 2013, the drop is not evenly distributed across neighborhood ethnoracial types (Figure 1). Among low declining homicide trajectories, White (n = 917) and Integrated (n = 876) neighborhoods are most common. They represent 41% and 39%, respectively, of the 2259 tracts in the low and declining homicide group. Many fewer Black, Latino, and Minority neighborhoods enjoy low and declining levels of homicide. In contrast, areas where homicide rates were moderate and stable are overwhelmingly Black (70%, n = 201). Even more striking, 94% of neighborhoods that had high and rising homicide are predominantly Black (n = 131) while none are predominantly White. Other neighborhood types rarely show increases in homicides.
Figure 1 can also be read to provide information regarding the proportion of ethnoracial neighborhoods in each of the homicide groups. Virtually all White neighborhoods had declining homicide (n = 917); only three White neighborhoods had stable rates and none had increases in murder. Similarly, Integrated neighborhoods are mostly in the low declining group; only thirty-five Integrated neighborhoods (under 4%) experienced stability and just five had rising murder levels. Latino neighborhoods follow a similar pattern as White and Integrated areas as almost all (n = 169, or 95%) had declining homicide over time.
We find similar although less severe ethnoracial inequalities for burglary (Figure 2). Neighborhoods with low and declining burglary rates are typically White or Integrated. The larger group of areas with moderate levels of burglary that went down is also comprised mainly of White and Integrated neighborhoods along with many Latino areas (n = 126, 70% of all Latino tracts). The final important ethnoracial difference is between neighborhoods with high burglary rates in 1999 that went down (high declining; n = 437; 16% of all tracts) compared to the large group with high rates in 1999 that rose (high increasing; n = 817; almost one-third of all tracts). White and Integrated neighborhoods are most common in the high declining group, but all neighborhood types have similar proportions to their percentage in the overall sample. Black neighborhoods are dramatically overrepresented in the high increasing group, comprising 45% of such areas (n = 365) and nearly three-quarters of Black areas. Although these patterns are less stark than for homicide, deviation from declining burglaries is still much more common for Black neighborhoods.
The story painted above is sobering as it shows that increasing violent and property crime are disproportionately experienced by Black neighborhoods. Nonetheless, this is not the pattern for many Black areas. About 40% of Black communities (n = 201) had moderate homicide levels in 1999 that saw no significant change in subsequent years. Large numbers of Black communities also saw crime drop; about one-third (n = 163) experienced declines in homicide and 27% (n =135) had declining burglary rates. Descriptive data give us a hint as to the factors behind this heterogeneity. Black neighborhoods that saw increasing homicide or burglary rather than other patterns of change were more highly disadvantaged in 2000 and saw vacancies rise more dramatically in the subsequent ten years. Surges in foreclosures and population loss were uniquely linked with increasing homicides while rising disadvantage fueled increases in burglaries in Black neighborhoods.
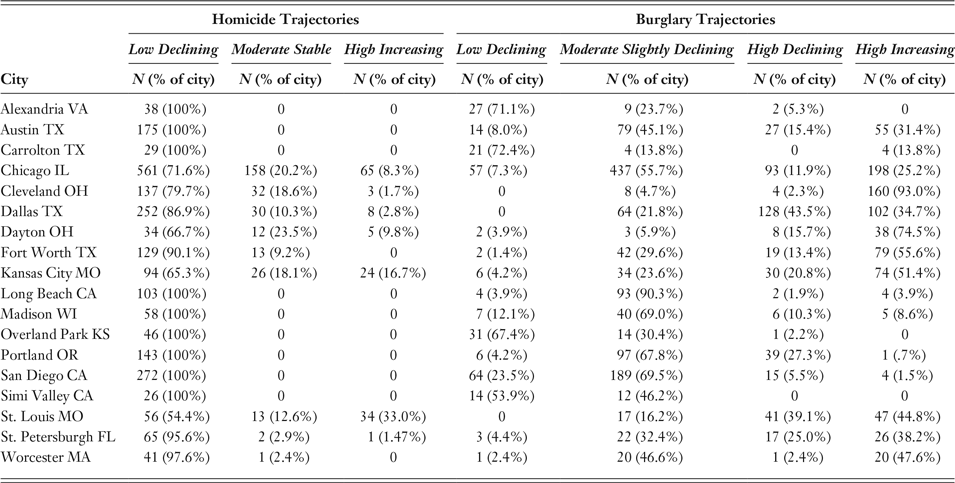
A strength of our sample is that we examine neighborhoods across more cities than prior research. Before predicting differences in trajectory group membership, we compare the distributions of homicide and burglary patterns across cities. Neighborhood crime trajectory groups vary notably over the eighteen places (Appendix A). Nine cities exclusively have neighborhoods with low and declining homicide rates. These cities tend to be smaller, although they include some moderate-to-large places (Austin, Long Beach, Portland [OR], and San Diego). Only seven cities have neighborhoods with high and increasing homicides, and Chicago, Kansas City, and St. Louis account for a staggering 88% (123/140) of such neighborhoods. Homicides rose in about 5% of all neighborhoods, but the percentages are much higher in Kansas City (17%) and St. Louis (33%). Compared to homicide, burglary trajectories are more evenly distributed across cities, but there is notable variation. In six cities, at least 45% of neighborhoods had high burglary rates that increased—much higher than the sample average of 30%. Dayton and Cleveland are the most striking with 75% and an astounding 93% of neighborhoods, respectively, having high and increasing burglary rates. The considerable variation across cities in neighborhood homicide and burglary trends reaffirms the need to go beyond single city analyses to document heterogeneity across place and better understand evolving patterns of neighborhood crime.
Predicting Patterns of Within-Neighborhood Crime Change
To explain the divergent crime trajectories while adjusting for substantial variation across cities, we estimate random effects multinomial logistic regression models. Table 4 presents odds ratios for all predictors from the homicide models. The first two columns compare the odds that neighborhoods had stable versus declining homicides (column 1) or increasing rather than declining homicides (column 2). Column 3 provides odd ratios for experiencing increasing murder rather than stable rates.
Table 4. Odds Ratios from Random Effects Multinomial Logistic Regression of Homicide Trajectory Groups

*** p < 001; ** p <.05; * p <.1
What sets some neighborhoods apart from the national crime decline? Neighborhoods with higher and more rapidly increasing disadvantage and housing vacancies had much greater relative risks of seeing homicide rates remain stable or increase than decline (Table 4, columns 1 and 2). Communities with more Blacks also had higher odds of either stability or increases in lethal violence than the dominant pattern of decline, even after controlling for other conditions. Foreclosures, the size of the Latino population, immigration trends, and population dynamics uniquely explain the rise in murders in some urban neighborhoods (see columns 2 and 3). Communities where foreclosure rates were higher and the Latino population was larger in 1999 had much greater odds of seeing homicide rise than fall or remain stable (columns 2 and 3). In contrast, high and rising immigration decreased these same odds. For example, neighborhoods with an increasing percentage of recent immigrants had 17% (OR = .83) and 18% (OR = .82) lower relative chances of having growing rather than declining or stable murder rates, respectively. Similarly, neighborhoods with larger and more rapidly growing populations had much lower odds of murder increasing than either remaining stable or declining. Local areas where the young male population grew more quickly had greater odds that homicides increased than stayed at moderate levels.
Table 5 shows the odds ratios from models predicting patterns of burglary change. In the first three columns, the pattern of low declining burglary rates is the reference category for contrasts with each other type of change. The last two columns compare odds for moderate declines (column 4) and high increases (column 5) to those with high burglary rates that declined sharply over time. Several findings stand out. First, disadvantage is crucial to changing burglary patterns. More highly disadvantaged neighborhoods have much greater odds of experiencing any type of change in burglary other than declining from the lowest levels (columns 1–3). The odds of having high rates that rose rather than declined (column 5) are also substantially heightened for neighborhoods where disadvantage was higher and increased more over time (OR = 1.57 and 2.25, respectively). Second, the housing crisis helps explain burglary change. Neighborhoods with higher and increasing rates of foreclosures had significantly greater risks of seeing burglaries that were already high rise than fall (column 5). Areas with high and rising vacancies generally have greater odds of patterns other than low and declining burglaries and of experiencing high rather than moderately declining rates. However, unexpectedly, among tracts that began with the highest rates of burglary, greater initial levels of vacancy actually reduce the odds of increasing rather than decreasing burglary rates.
Table 5. Odds Ratios from Random Effects Multinomial Logistic Regression of Burglary Trajectory Groups
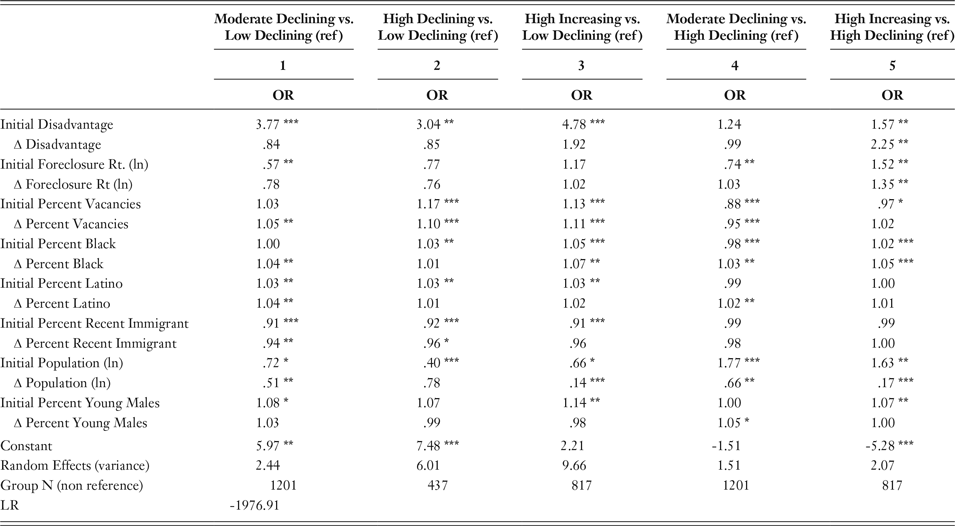
Notes: *** p < 001; ** p <.05; * p <.1
Third, the racial/ethnic composition of neighborhoods also shapes paths of neighborhood change. Neighborhoods where the concentration of Blacks was large and increased have higher relative chances of more troubling burglary trends. Communities with large Latino populations also have enhanced odds of all types of change in burglary other than low and steadily declining. In contrast, high initial levels of recent immigration reduce the odds of burglaries showing any pattern other than low levels that steadily decreased; immigrant growth is also linked with a trend of low declining burglary rates relative to either moderate or high rates that declined.
Lastly, as with homicide, neighborhood population change corresponds with changes in burglary. For example, neighborhood depopulation leads to much greater relative chances of having high rates that rose rather than high or low rates that declined (OR = 1/.17 = 5.8 and OR = 1/.14 = 7.3, respectively).
CONCLUSION
The pronounced racial-spatial divide in urban neighborhood crime in the United States is well documented in a host of cross-sectional studies. Serious crime is highly clustered in non-White neighborhoods due to ethnoracial inequality in the concentration of structural disadvantages (Peterson and Krivo, Reference Peterson and Krivo2010a; Shaw and McKay, Reference Shaw and McKay1942). But do inequalities in neighborhood crime change when the conditions that undergird these disparities shift in meaningful ways? Further, do changing urban neighborhood fortunes lead to divergent local crime trends despite the “Great American Crime Decline”? We addressed these questions with unique data for nearly 2700 neighborhoods across eighteen cities in the years leading up to and following the Great Recession when poverty concentration rose, a housing crisis distressed many communities, and racial and ethnic composition continued to shift. Our longitudinal analyses of violent and property crime trends between 1999 and 2013 highlight that while there is tremendous breadth in the crime decline locally, there are notable countertrends that are highly racialized.
Consistent with national patterns, most neighborhoods in our sample were safer in 2013 than fifteen years earlier. Homicides declined in 84% of neighborhoods, as did burglary rates in 70% of local areas. Yet, a notable portion of neighborhoods experienced a countertrend; homicide and burglary rates actually increased in 5% and 30% of neighborhoods, respectively. While the post-1990s crime decline is clear nationally (Baumer et al., Reference Baumer, Vélez and Rosenfeld2018), crime dynamics are more variable when we drill down to the smaller residential areas where crimes occur.
Of key concern is the way that differences in patterns of crime change are racialized across space. White, Integrated, and Latino neighborhoods commonly enjoyed the benefits of the crime decline. In contrast, increasing crime trends were largely the domain of Black neighborhoods. This is especially true for homicide, where Black neighborhoods represent a staggering 94% of neighborhoods that saw lethal violence increase over the period. Even for burglary, Black neighborhoods comprise the single largest collection (about 45%) of neighborhoods with increasing rates. Further, the relative size of the Black population, a variable that taps unmeasured structural disadvantages such as weakened community institutions and poor schools, is important in predicting increasing crime trajectories. This disproportionality does not mean that all Black neighborhoods suffered from problems of increasing crime; over 70% of Black areas had stable or declining murder rates and about one-quarter experienced decreases in burglaries of varying magnitudes. Yet, Black neighborhoods were unduly burdened by increasing crime even compared to other minority neighborhoods, consistent with arguments and findings that the U.S. social structure is organized along a Black-non-Black divide (e.g., Lee and Bean, Reference Lee and Bean2007). To the degree that such a divide in crime change holds across an even wider and more representative set of neighborhoods, we expect that over time violent and property crime rates in Latino, Minority, and Integrated areas will more closely approximate the low levels found in White neighborhoods. In contrast, crime could become even more concentrated in some Black neighborhoods. We encourage future research to investigate the conditions that might reinforce, potentially reduce, or reconfigure the ethnoracial divide in neighborhood crime while also carefully exploring the range of experiences with crime change for Black neighborhoods.
Not surprisingly, we show that disadvantaged and minority neighborhoods that were burdened by housing instability at the start of the new millennium were at substantial risk for increases in violent and property crime. Thus, the arrangement of neighborhood social and economic wellbeing at the beginning of the century helped sustain and predict the fall out for crime in the new century. But the upheaval brought about by the Great Recession had further criminogenic consequences. A deepening concentration of disadvantage and the spread of vacancies set the stage for crime. These conditions made neighborhoods particularly vulnerable to experiencing patterns of stable or even increasing homicide rates, rather than declining violence. Rising disadvantage and vacancies also led to unanticipated upticks in burglaries in many areas. Given that these neighborhoods are unlikely to bounce back quickly, future work should investigate how long-term exposure to economic and housing crises shapes the dynamic nature of crime.
In contrast to risk factors for increasing crime, we find compelling evidence that immigration helps generate neighborhood crime declines. The protective effect of immigration persists despite dramatic social and economic upheaval in the new millennium. This finding is particularly important for countering current nativist political rhetoric and supporting contentions that immigration has been and continues to be a force linked with decreasing, not increasing, crime within communities.
We discern considerably more variation in neighborhood crime trends, and less evidence of stability, than previous inquiries of single cities. Our wide ranging sample of neighborhoods within eighteen cities bolsters confidence in the generality of our findings. However, variability in the patterns of crime change identified provides a cautionary lesson. The crime decline has not occurred everywhere; socioeconomically disadvantaged and Black communities have a substantially higher risk of actually becoming less safe over time. But neither has the crime decline been limited to one or just a few cities. Thus, analysts must examine the dynamics of crime in its full social context and across as many places as possible if we are to understand when, where, and under what conditions crime in small areas remains stable, increases, or declines. The dearth of longitudinal and multilevel data, substantial heterogeneity across cities, and the importance of city contexts in shaping neighborhood fortunes call for research with larger samples of neighborhoods across multiple cities. Heeding this call, the second wave of the NNCS will provide data that is nationally representative of large cities for two time points to better gauge the dynamic nature of crime.
Scholars should consider how spatially embedded processes influence neighborhood crime trajectories. Non-White neighborhoods often are embedded in spatial proximity to areas with relatively high disadvantage. In contrast, White neighborhoods typically are surrounded by areas of relative advantage and are buffered from extreme criminogenic conditions (Peterson and Krivo, Reference Peterson and Krivo2010a). We encourage researchers to investigate both the degree of spatial clustering in crime trajectories (e.g., Wheeler et al., Reference Wheeler, Worden and McLean2016; Yang Reference Yang2010) and the role of spatial embeddedness in producing divergent crime paths.
Overall, our study speaks to the durability of ethnoracial inequality in crime during a tumultuous period. Whereas many neighborhoods of all colors were safer in 2013 than in 1999, not all were. Far from being random, the uneven pattern of crime change is highly racialized with heavily disadvantaged and Black communities suffering the most from rising, rather than declining, violent and property crime. This finding clarifies that the divergent social worlds in which highly resourced White neighborhoods and many other non-Black areas have low crime, while more disadvantaged and Black neighborhoods have relatively high crime, remains entrenched. Alarmingly, this racial-spatial divide may even be widening in some places despite a national crime decline.
ACKNOWLEDGMENT
This research was supported by grants to Lauren J. Krivo, Christopher J. Lyons, and María B. Vélez from the National Science Foundation (SES-1357207; SES-1356252). The authors would like to thank Robert Apel, Eric Baumer, Robert L. Kaufman, and Brian J. Stults for providing helpful comments. An earlier version of this paper was presented at the 2016 annual meeting of the American Society of Criminology, New Orleans, LA.
Appendix A. Trajectories by City