Population-level health risk assessments are a key element of public health emergency preparedness.Reference Nelson, Lurie and Wasserman1 Assessments can identify populations vulnerable to disasters and this knowledge can inform emergency planning. Identifying subpopulation differences in disaster preparedness is particularly important because different public health messages, programs, and distribution channels may be required to improve preparedness among different subgroups. People with chronic medical and mental illness or disability are at particular risk in disasters,Reference Bourque, Siegel and Kano2, Reference Norris3 and studies show the disproportionate impact that disasters have on physical morbidity in older adults, people with chronic illness, and people with disabilities.Reference Bourque, Siegel and Kano2,Reference Semenza, Rubin and Falter4–Reference Rath, Donato and Duggan6
Although the September 11, 2001, terrorist attacks produced a greater understanding of the disaster preparedness and response needs of chronically ill and disabled populations, it was not until Hurricane Katrina in 2005 that many health care and public health professionals fully embraced the importance of preparing people with chronic illness for disasters. Large numbers of people with chronic diseases or disability lived in the greater New Orleans metropolitan area and were directly affected by the evacuation from Hurricane Katrina. Reference Mokdad, Mensah and Posner7–Reference Brodie, Weltzien and Altman9 Chronic illnesses and physical disability prevented many from evacuating before Katrina made landfall, exposing them to greater harm. Other chronically ill residents evacuated from their homes without their medications, placing them at risk for illness exacerbations;Reference Wingate, Perry and Campbell10 more than 60% of all medications dispensed to Gulf Coast evacuees were for treatment of chronic diseases.Reference Jhung, Shehab and Rohr-Allegrini11, Reference Ghosh, Patnaik and Vogt12 In fact, much of the medical care delivered during the Katrina response phase was to people with exacerbation of chronic illnesses. Reference Edwards, Young and Lowe13–Reference Krol, Redlener and Shapiro15 For instance, surveillance data collected from 29 emergency treatment centers in and around New Orleans showed that 24.3% of 21,673 health care visits were for chronic disease–related conditions.Reference Sharma, Weiss and Young16 Chronic disease–related visits led to greater subsequent hospitalization: 28.7% of people presenting with chronic disease–related visits were hospitalized compared with 10.9% of those with nonchronic disease–related visits and 3.8% of those with injury. People with chronic physical or mental illness were disproportionately represented among Hurricane Katrina evacuees living in some shelters. Reference Rodriquez, Tocco Stone and Malloneee17–Reference Rogers, Guerra and Suchdev19
Multiple factors, acting at different phases of a disaster, may result in disproportionate harm to people with chronic illness. During and immediately after an event, people with limited mobility are at increased risk for adverse health outcomes. Chronic illnesses may worsen with the lack of food and clean water, temperature extremes, and physical and mental stress. Illnesses can decrease individuals' mobility, create social isolation, and exacerbate the risk for mental and physical health problems after the initial risk of an emergency ends.Reference Person and Fuller20–Reference Mori, Ugai and Nonami24 For instance, in the days after September 11 many frail elderly and people with disabilities who lived near the World Trade Center were confined to their apartments without electricity, supplies, a way to refill their medications, or means to communicate with the outside world.Reference Aldrich and Benson25 Home care workers could not visit their clients and community service providers could not enter their offices or access computers that stored client information. During the response and recovery phases, people with chronic illnesses may have greater difficulty accessing emergency supplies and health care. Reference Mudur26–Reference Fernandez, Byard and Lin28 Lack of access to routine health care may be a leading cause of mortality after disasters.Reference Spiegel, Sheik and Gotway-Crawford29
This study is concerned with one of the earliest disaster phases—the individual preparedness phase. Lower levels of preparation for disasters could lead to chronically ill or disabled people being less able to care for themselves in the disaster's aftermath. In the first days after a catastrophic disaster, electricity, gas, water, and telephones may not be working. In addition, public safety services such as police and fire departments will be busy handling serious crises. To be prepared for a disaster, individuals are advised to be prepared to live without running water, electricity and/or gas, and telephones for at least 7 days following a major disaster and to have on hand the supplies to be self-sufficient (disaster supplies). They are also told to formulate a plan for finding each other and knowing everyone is safe after a disaster (an emergency communication plan). Preparedness may also contribute to an individual's resilience against trauma. Reference Summerfield30–Reference Bravo, Rubio-Stipec and Canino32 For these reasons, increasing the level of individual preparedness for disasters is a significant concern to local government agencies, first responders, public health planners, and voluntary agencies. Although national efforts have focused on preparing disabled people,Reference Christensen33, Reference Rowland34 and studies find people with disabilities to be increasingly prepared,35 less is known about people with chronic mental and medical illnesses.
We examined the relation between health status (mental health, perceived health status, and disability) and disaster preparedness (home disaster supplies and family communication plan). We hypothesized that there would be a positive association between level of health and level of disaster preparedness and that the relation between health and preparedness would remain after controlling for the effects of other variables.
METHODS
Study Design and Population
We analyzed data from the Public Health Response to Emergent Threats Survey, a random-digit-dial telephone survey of the noninstitutionalized population in Los Angeles County. Adults age 18 years and older were surveyed during October 2004 through January 2005 in a 2-phase sample design. Phase one consisted of a random sampling of Los Angeles adults using an unrestricted random-digit-dial sample of households within Los Angeles County. Phase two augmented the number of Asian and African Americans included in the overall survey and was conducted by means of a random-digit-dial sample of households in high-density Asian and African American population areas of the county.
One adult from each randomly selected household was eligible for inclusion in the survey. In households with multiple adults, 1 adult was randomly selected for participation. Of 10,882 households contacted, 6426 people were successfully screened for a cooperation rate of 59.1% using the standards of the American Association for Public Opinion Research. There were 3838 people not eligible for study inclusion (no adult in household; no Asian or African Americans in household in phase two) and 2588 completed the interview. Telephone interviews, conducted by trained staff using a computer-assisted telephone interviewing system, offered participants the option of answering the survey items in English, Spanish, Mandarin, Cantonese, Korean, or Vietnamese. The survey was sponsored by the Los Angeles County Department of Health Services Public Health Division and conducted by the Field Research Corporation.
Study Variables
The theoretical framework for predicting personal preparedness was adapted from the Gelberg and Andersen Behavioral Model for Vulnerable Populations. Personal preparedness can be characterized within this model as a health behavior (personal health practice). This revision of the behavioral model of health services utilization includes the original predisposing variables, enabling variables, and need variables.Reference Andersen36 It also includes new factors within each category that public health officials, researchers, and policymakers understand influence the health behavior of vulnerable populations.Reference Gelberg, Andersen and Leake37 Factors thought to influence personal preparedness can be grouped into the model's domains. Predisposing factors such as age, sex, education, and race/ethnicity have been associated with individual preparedness for natural disasters.Reference Fothergill, Maestas and Darlington38, Reference Lindell and Perry39 Enabling factors such as income and preferred language may facilitate preparedness by providing the resources and capacity to obtain supplies and information about preparedness.Reference Turner, Nigg and Paz40 Need factors, such as vulnerability to a disaster, may influence people to prepare for a disaster.
The outcome variables were the responses to 2 measures of individual disaster preparedness. The first variable, having household disaster supplies, was assessed by asking whether respondents had any of the 5 following items “to prepare for a natural disaster such as an earthquake, or a terrorist attack”: 3-day supply of food and water, a battery-powered radio, a first aid kit, a flashlight, and extra or spare batteries. Response categories were yes, no, don't know, and refused to answer. Cronbach's α for the 5-item scale was 0.62. The second, having an emergency communication plan, was assessed with a dichotomous item asking, “Do you or does your household have a family emergency plan in which you and family members would meet or call after a disaster?”
We created dichotomous categories for having household disaster supplies for the following reason. In Los Angeles County, high proportions of the population report having each individual item (3-day supply of food/water, 77%; battery-powered radio, 76%; first aid kit, 71%; flashlight, 94%; extra batteries, 82%). However, being prepared requires having all 5 of the items inquired about in the survey (and probably additional items such as prescription medications, cash, important documents, extra clothing, and blankets). We assumed that people who had all 5 items are qualitatively different from people who do not have all 5 insofar as people with all 5 of the most frequently recommended supplies are more likely to have other aspects of preparedness completed that we did not include in the survey. Therefore, we created dichotomous categories for having household disaster supplies: “supplied” (people who had all 5 items) and “not supplied” (people who had 4 items or fewer).
Three measures of health were the main predictor variables of interest: probable serious mental illness, perceived general health, and disability. The definition of people with probable serious mental illness (SMI) was based on the Kessler-6 (K6) scale of psychological distress, developed for use in the US National Health Interview Survey.Reference Kessler, Andrews and Colpe41 The K6 measures nonspecific psychological distress and correlates with other measures of mental illness severe enough to cause moderate symptoms or moderate impairment in social, occupational, or school functioning. Specifically, the K6 defines SMI as any past year DSM-IV Axis I diagnosis with a global assessment of functioning score below 60. The K6 asks how frequently the recipient experienced symptoms of psychological distress during the past 30 days, including feeling depressed, nervous, restless or fidgety, hopeless, worthless, and that everything was an effort (eg, “During the past 30 days how often did you feel so depressed that nothing could cheer you up?”). Thus, it screens for the severity of psychological symptoms regardless of the specific DSM-IV Axis I diagnosis. Responses are scored using a 5-point Likert scale. Total scores can range from 6 to 30. Scores of 18 or less are consistent with probable serious mental illness. At this cutoff point, sensitivity is reported to be 36%, specificity 96%, and total classification accuracy 92%.Reference Kessler, Barker and Colpe42 Although a diagnosis of serious mental illness cannot be made using this instrument, for convenience we use the term SMI rather than probable SMI symptoms.
Perceived general health was assessed with a single item, “Would you say that in general your health is excellent, very good, good, fair, or poor?” This item predicts health outcomes and behaviors in diverse populations.Reference DeSalvo, Fan and McDonell43 Responses are scored on a 5-category Likert scale as excellent, very good, good, fair, and poor.Reference Ware and Sherbourne44 We combined the response categories fair and poor due to the low prevalence of people responding “poor.”
People were classified as having a disability if they answered “yes” to at least 1 of the following questions regarding any long-term impairment that lasted or was expected to last for at least 3 months: “Are you limited in any way in any activities because of a physical, mental, or emotional problem?” “Do you now have any health problems that require you to use special equipment such as a cane, a wheelchair, a special bed, or a special telephone?” “Do you consider yourself a person with a disability?”Reference Bancroft, Lightstone and Simon45
Race/ethnicity, a predisposing variable, was defined as non-Latino white (white), non-Latino African American (African American), Latino, and Asian/Pacific Islander. Other predisposing variables included in the analyses are age, sex, and education level. Enabling variables in this analysis included marital status, annual household income, and preferred language of interview. As in the vulnerable populations model, illness and perceived health status are need variables in our analyses. All predisposing, enabling, and need variables were selected because they were predictors of preparedness in previous studies or of health behaviors according to the Behavioral Model for Vulnerable Populations.
Statistical Analyses
Participants with responses to any of the variables of “don't know” or “refused” (n = 381) were excluded from analyses. We performed univariate analysis to characterize the sample and bivariate analyses to determine the relation between the dependent variables and the health variables and covariates. We performed 3 sets of multivariate logistic regression analyses with the 2 dependent variables of household disaster supplies and emergency communication plan. The multivariate models independently examined the association of the 3 health variables with the 2 dependent variables of household disaster supplies and emergency communication plan. All multivariate regression models generated adjusted odds ratios (AORs) and 95% confidence intervals (CIs) that measured the independent relation of each health variable to the dependent variables, adjusting for confounding by the sociodemographic covariates. Finally, we performed 2 separate multivariate logistic regression analyses in which all 3 health variables and all of the sociodemographic covariates were regressed against the 2 dependent variables of household disaster supplies and emergency communication plan. Data analyses were conducted using SAS version 9.1.3 (SAS Institute, Cary, NC). All P values are based on 2-tailed tests.
We constructed an analytical weight for each participant comprising 2 component weight fields. The first weight field is a sampling weight to adjust for the number of telephone lines in the household and the probability of selection of an individual within a household. To reduce the bias derived from excluding county residents currently without telephone service and cell phone only service from the sample, the responses of those who reported being without landline telephone service for a time in the past 3 years were given a greater weight. The second weight field is a population-level adjustment and converts the random sample data to projections of the overall population of all adults in the county (sex, age, education, race/ethnicity, and geographical location of households). A comparison of the weighted study sample to the census data revealed that the study results could be used to generate population estimates of Los Angeles County. Weighted data are presented here as a reasonable approximation of the responses of all of the adult residents of Los Angeles County.
RESULTS
Table 1 describes the sample from this analysis. Consistent with the national prevalence of serious mental illness, 6.6% of the sample had a probable serious mental illness.Reference Kessler, Chiu and Demler46, Reference Kessler, Berglund and Zhao47 Rates of people with disabilities in the survey were consistent with rates reported among the population of Los Angeles County in other California-wide and Los Angeles population surveys.Reference Bancroft, Lightstone and Simon45
TABLE 1 Descriptive Sample Profile of the Public Health Response to Emergent Threats Survey: Los Angeles, CA, 2004 (n = 2207)

As shown in Table 2, people with worse general health are less prepared. Only 40.7% of people who rated their health as fair/poor have all 5 items compared with 53.1% of those who rate their health as excellent and 51.4% of those who rate their health as very good (P < 0.001). Similarly, as perceived health declines people are less likely to report having an emergency communication plan. Only 34.8% of people who rated their health as fair/poor have an emergency plan compared with 44.8% of those who rate their health as excellent (P < 0.01). People with serious mental illness are also less prepared. Only 29.5% of people who have a serious mental illness have all 5 items compared with 49.2% of those who do not have a serious mental illness (P < 0.001). Disability status was not associated with lower rates of disaster supplies or emergency communication plans in bivariate analyses.
TABLE 2 Proportion of Los Angeles County Population Reporting Having All 5 Preparedness Items and Emergency Communication Plan by Sample Characteristics (n = 2207)
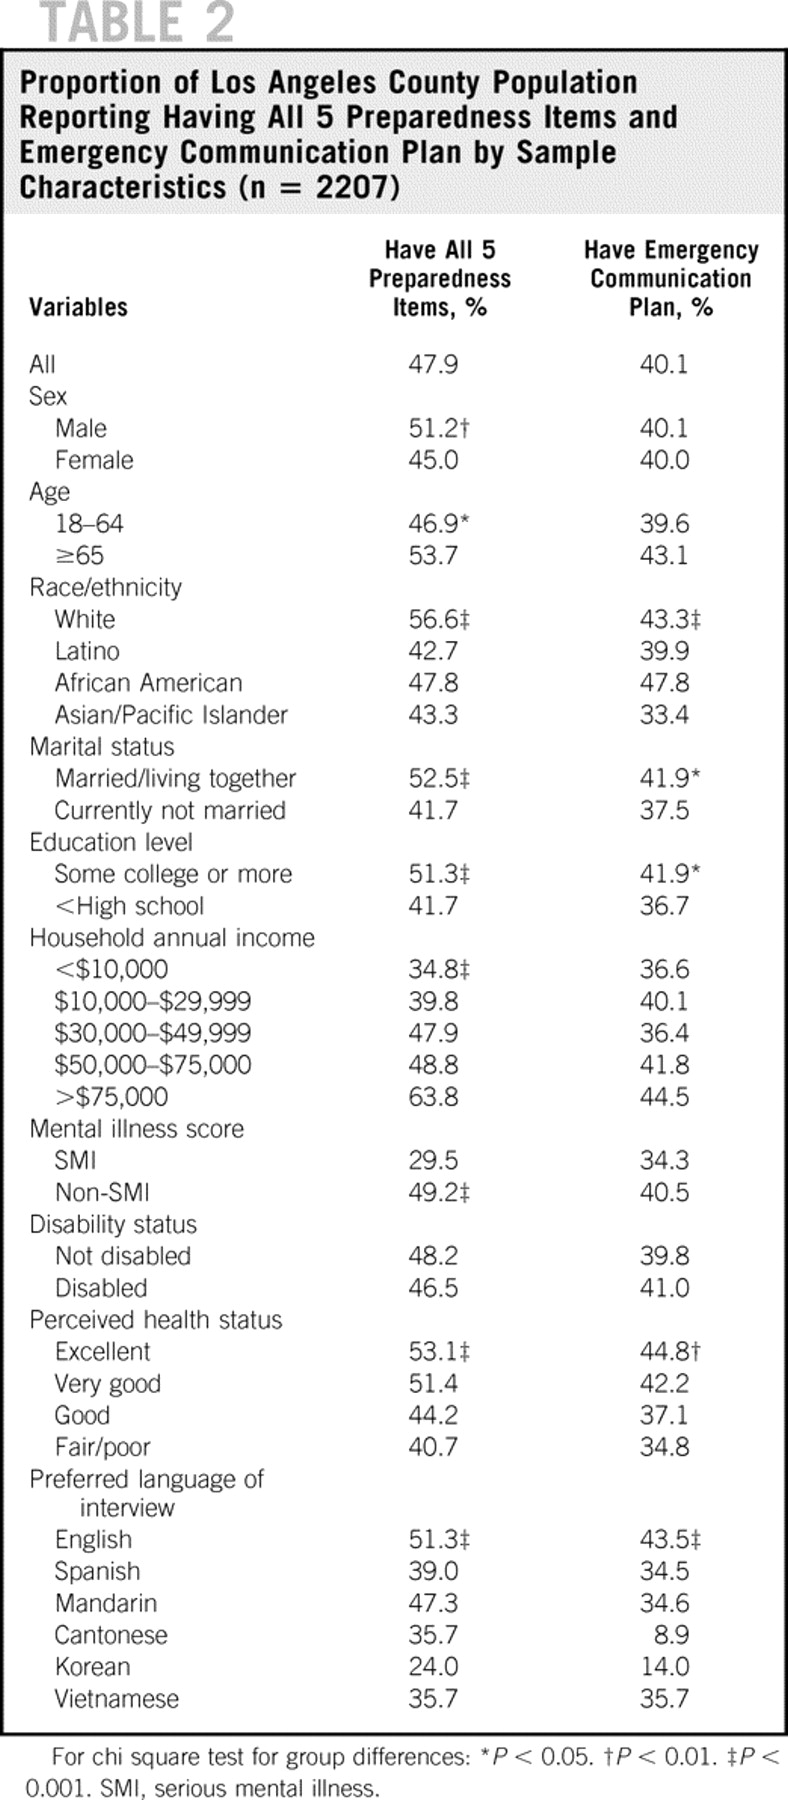
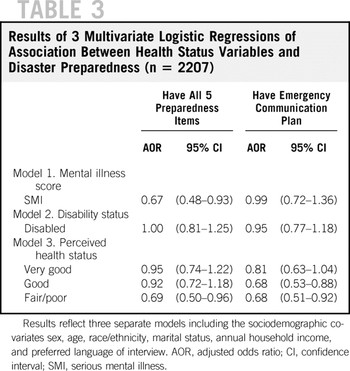
Table 3 shows the AOR and 95% CI for each of the health variables from the multivariate models that independently examined their associations with household disaster supplies and emergency communication plan adjusting for the sociodemographic covariates. People with fair/poor health remained less likely to have all 5 items (AOR 0.69, 95% CI 0.50–0.96) and less likely to have an emergency plan (AOR 0.68, 95% CI 0.51–0.92) compared with those who rate their health as excellent, after adjusting for the sociodemographic covariates. People with serious mental illness remained less likely to have all 5 items controlling for the sociodemographic covariates (AOR 0.67, 95% CI 0.48–0.93).
TABLE 3 Results of 3 Multivariate Logistic Regressions of Association Between Health Status Variables and Disaster Preparedness (n = 2207)

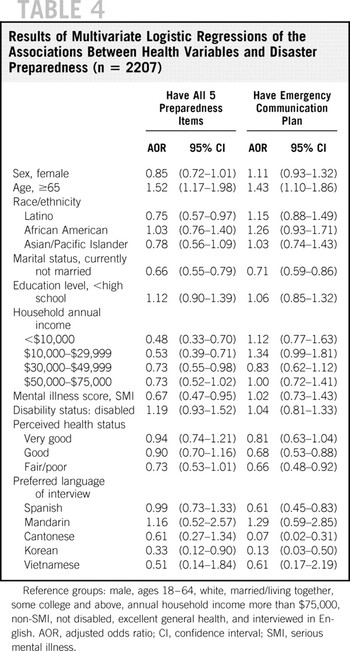
Finally, in the full models shown in Table 4, adjusting for the sociodemographic and health variables, people with serious mental illness remained less likely to have all 5 items (AOR 0.67, 95% CI 0.47–0.95) and people with fair/poor health remained less likely to have an emergency plan (AOR 0.66, 95% CI 0.48–0.92). Other factors were associated with lower preparedness in the fully adjusted multivariate model. People who reported lower household incomes, not being currently married, or Latino ethnicity, or whose preferred language of interview was Korean, were less likely to report having all 5 of the items. People whose preferred language of interview was Spanish, Cantonese, or Korean were less likely to report communication plans. Finally, people ages 65 and older were more likely to report having all 5 of the items and to report having communication plans.
TABLE 4 Results of Multivariate Logistic Regressions of the Associations Between Health Variables and Disaster Preparedness (n = 2207)

DISCUSSION
We found significant negative relations between the independent variables of perceived health status and probable SMI and the outcome variables of household disaster preparedness and an emergency communication plan. The relations were robust despite controlling for multiple factors. Consistent with the study model, predisposing and enabling variables also were associated with this health promotion behavior. The associated predisposing variables were Latino ethnicity and age. The enabling variables of marital status, income, and preferred language of interview were associated with preparedness. These results are consistent with prior studies. Reference Fothergill, Maestas and Darlington38–Reference Turner, Nigg and Paz40
There are several implications to our study. First, our results may add to our understanding of why people with preexisting health problems suffer disproportionately from disasters. Unfortunately, the people most likely to be harmed during a disaster and the people least resilient to the service disruptions that will accompany a large disaster may be the least prepared to provide for themselves in the days after the disaster. The relative absence of disaster supplies and communication plans increases their vulnerability. People without necessary supplies may experience dehydration or exposure that exacerbates their illnesses. Those without a plan to communicate with family members may become isolated or fearful and suffer from greater stress. Second, these results may extend our understanding of the factors related to disaster preparedness. Although some models include disability/ability as a characteristic that may influence disaster preparedness, no model of preparedness includes general and mental health as factors and we found no prior studies examining the associations of perceived general health and mental health with preparedness.
Disaster supplies are qualitatively different from communication plans. First, disaster supplies and communication plans serve different purposes. Second, they require different activities and different levels of involvement from members of the family. Purchasing and assembling disaster supplies such as food, water, flashlights, first aid kits, and batteries can be done by a single member of the family. However, developing an emergency communication plan requires communication and involvement among multiple family members. It requires discussion about a disaster, which some may find psychologically stressful. Not surprisingly, many surveys separate these out and report that fewer people have plans than supplies both nationally and locally. Studies need to examine these separately, especially for people who are ill who may be concentrated among older adults and socially isolated individuals, or may need help with activities of daily living. Because fewer people have an emergency communication plan than have adequate disaster supplies, public health efforts to improve preparedness must particularly address the need for emergency plans. Because rates and predictors of emergency supplies and plans differed (almost all groups were less likely to have a plan than supplies), interventions must distinguish between increasing adoption of supplies and plans.
The absence of previous research on the association between health status and disaster preparedness limits our ability to compare our results to previous studies. However, health status has shown an association in other areas of injury prevention. For instance, maternal postnatal depression has been linked to lower rates of accident prevention practices such as child car seatsReference McLennan and Kotelchuck48, Reference Leiferman49 and electrical plug coversReference McLennan and Kotelchuck48 and higher rates of child injuries.Reference O'Connor, Davies and Dunn50 Although the cross-sectional nature of the data prevents us from determining causality, it is similarly plausible that lower general and mental health status may hinder disaster preparedness. For instance, people with poor general health and mental health (eg, major depression) may experience fatigue and low energy that hamper their capacity to take on the added work of obtaining, checking, and replacing emergency supplies. The equivalent frequency of preparedness among disabled and nondisabled people that we found is consistent with prior research. National studies of people with disabilities report increasing rates of personal preparedness (possibly due to campaigns to improve preparedness in this community since the terrorist attacks of September 11, 2001), such that there appears to be diminishing or no difference in personal preparedness between disabled and nondisabled people.35
There are limitations to this study. A 59% response rate means that 41% of eligible respondents are not represented in the sample. The direction this bias had on the results is unclear. For instance, people with mental illness may be underrepresented in community surveys.Reference Eaton, Anthony and Tepper51 However, this cooperation rate is comparable to that of other telephonic health surveys of the overall population, including the California-wide rate (59.9%) in the 2004 Behavioral Risk Factor Surveillance System.52 Also, our survey was conducted in Los Angeles County, a region where earthquakes and wildfires are a constant concern, and Los Angeles is cited frequently as a potential terrorist target, although it was not directly affected by the September 11 attacks. Our results need to be investigated in other regions.
Another set of limitations is our dependence on the disaster preparedness measures and health status measures available in this survey. The disaster preparedness measures were limited to 5 items measuring household disaster supplies and 1 item measuring emergency communication plan. Medication supply was not among the disaster supply items. A major issue in disaster preparedness is maintaining access to medications for chronic illnesses. People with chronic medical or psychiatric disorders are at risk for exacerbation or relapse if a disaster interrupts their access to medications—an issue this study could not address. Although the household supplies do not form a complete disaster supply list, they are still the most common and some of the most important items recommended for disaster preparedness among general populations.
As for the health status measures, our measure of perceived health status is a predictor of important health outcomes, including mortality, but it does not substitute for an inventory of chronic illnesses or other measure of actual physical health status. Our definition of disability was also broad. This allowed us to understand disability as including sensory, physical, mental, self-care, going outside home or work limitations. Narrower definitions, for instance focusing on activity limitations only, would not capture individuals using an aid, who may not report activity limitations but may be more vulnerable to a disaster because of their dependence on an aid. A consequence of using these broad health measures is that this study cannot assess which underlying conditions are related to preparedness.
The K6 measures probable SMI and is not a screen for specific disorders nor is it a diagnostic instrument. This study cannot assess which underlying mental illnesses are related to preparedness. Future research may investigate whether the type of disorder (eg, major depression, schizophrenia) is related to preparedness. Also, people with a major psychiatric disorder who were asymptomatic in the 4 weeks before the study would not be detected by the K6. The preparedness of this group cannot be determined from this study. This population may be particularly vulnerable during a disaster and future studies should assess their level of preparedness.
Analyzing data from this survey provides notable strengths. By analyzing the data from a single region we were able to control for racial/ethnic variations and language differences in more detail than is often possible in national surveys. Surveys conducted in urban settings face a potential sampling bias to the extent that significant segments of the populations of interest do not speak English well. In Los Angeles County, omitting large segments of the non–English-speaking population threatens the representativeness of a population survey because of the heavy multiethnic makeup of the population and the relatively high proportion of residents born outside the United States. The Public Health Response to Emergent Threats Survey minimizes this threat by using versions professionally translated and pretested in Spanish and 4 Asian languages. Including these languages allows for 98% of Los Angeles adults to be embraced in the sampling frame.
These findings set the stage for a progressive agenda of research on disparities in disaster preparedness among people who are ill.Reference Kilbourne, Switzer and Hyman53 First, other municipalities and jurisdictions should investigate their own populations. Subpopulation data should be analyzed to determine whether these findings are replicable, to further measure the magnitude of the disparity, and to consider selection effects and confounding factors that may have limited this study. Second, if these findings are replicated, future research can focus on understanding why these disparities exist by identifying the factors that explain the differences in behavior. Lower levels of preparedness among ill people in this study should be investigated further to understand the motivators and facilitators of preparedness in these groups. For instance, do issues of social isolation or poor self-efficacy explain the disparities among people who are mentally ill or do competing needs explain the disparities among those with poorer general health?
Third, research can focus on developing, implementing, and evaluating interventions that reduce these disparities. Finding that people of poor health are less prepared for disasters provides evidence for engaging public health and health professionals groups in targeting this population for disaster preparedness. One mechanism for this may be through their access to health services delivery systems (eg, ambulatory care clinics, medical offices, retail pharmacies) and their professional association with community health professionals, hospitals, and health agencies. Public health agencies also may consider collaborating with community partners such as insurance carriers and nonprofit organizations (eg, National Alliance on Mental Illness) to improve the preparedness of people who are chronically ill. In the world of disaster and public health planning, “vulnerable” groups often are also designated as “difficult to reach.” It is by no means clear that they are difficult to reach if public health takes a targeted approach to its work. Such groups may not be difficult to reach at all if targeting becomes the norm.
Acknowledgments
Supported by Centers for Disease Control grants U90/CCU917012-06 (to Los Angeles County Department of Public Health) and 1 K01 CD000049-01 (D.P.E., principal investigator).
Authors' Disclosures The authors report no conflicts of interest.