


Volunteers make up an important part of any disaster response, yet little is known about their work-related safety and health. The American Red Cross (ARC) and networks of volunteer organizations, such as the Medical Reserve Corps (MRC), are equipped to deploy numerous volunteers across the United States. According to the ARC, more than 57 000 volunteers are listed on the roster nationwide.Reference Head 1 The MRC reports that close to 207 000 volunteers from a wide range of medical professions are ready to deploy when necessary (Tracey Smith, MSc, MPH, e-mail communication, February 19, 2014). It is imperative that volunteer organizations collaborate with one another to fully understand the magnitude of injuries and illnesses that occur among volunteers. The National Voluntary Organizations Active in Disaster (VOAD) serves as a forum for groups such as the ARC and MRC to share such knowledge and resources. 2 This report focuses on an analysis of data from the ARC.
The ARC is a network of paid staff and volunteers (hereafter referred to as responders) whose mission is the prevention and alleviation of human suffering in the face of emergencies. The ARC offers help, not only in the United States and its territories but also in other countries around the world as a member of the International Red Crescent Society. Each year in the United States, the ARC responds to approximately 70 000 disasters, ranging from small house fires to large disasters. 3 The organization assists in meeting basic needs such as shelter, food, supplies, and support to help individuals return to a life of routine.
Due to concerns about the health of the ARC responders in the aftermath of the World Trade Center terrorist attack on September 11, 2001, it became increasingly clear to the ARC that it needed to focus more energy on the health and welfare of its responders (Rena Penney, oral communication, July 3, 2006). In 2005, the ARC initiated a staff wellness program and created a medical group of physicians and nurses to oversee it. A health status record (HSR), which identifies responders’ medical conditions, was generated for responders every year. Based on the HSR, the ARC identified jobs that a responder should not perform. In 2013, the ARC changed from yearly completion of the HSR to completion only once, when an individual becomes a responder, with modifications made when self-reported significant changes in health status occur (William Marfara, oral communication, January 22, 2012).
In addition to the HSR, responders complete a preassignment health questionnaire before deployment, usually within 24 to 48 hours of a response, to ensure wellness. The medical group then conducts a predeployment briefing to review special circumstances and potential health risks to the responder. After an orientation on responder roles and the operation (eg, population demographics and conditions pertinent to the geographic location), responders receive instruction on how to contact the staff wellness program during the response. 4
The ARC’s corporate safety policy ensures that responders receive training to minimize their risk of injuries. However, if a responder becomes hurt or ill on the job, then the staff wellness medical group documents this occurrence in an injury and illness record. Some of the more commonly reported injuries include lacerations/abrasions, strains/sprains, and falls, while illnesses are often classified as respiratory or gastrointestinal in nature. On the basis of a recommendation from the staff wellness medical group, the director of the relief operation determines whether the member can remain deployed or whether forms should be processed to relieve the member from that deployment (out-processing for medical reasons, or OPMR). OPMR is the withdrawal of a responder from deployment because of a medical condition. Assessment of these health events and development of recommendations for their prevention will depend on the collection of accurate and timely surveillance data for calculating rates of occupational injury and illness among responders.
Oftentimes, injury and illness rates for responders have been difficult to compare with rates for full-time workers. According to data from the Survey of Occupational Injuries and Illnesses (SOII) compiled by the Bureau of Labor Statistics (BLS), the incidence rate of occupational injuries and illnesses for all industries reached 3.4 cases per 100 full-time equivalent workers in 2012. 5 This survey, however, did not include volunteers,Reference Reichard and Jackson 6 so it can be difficult to extrapolate these rates to all groups of responders. Because rates for full-time workers are difficult to compare with those for volunteers, we recognized the need to analyze data specific to the ARC responders. The goal of this study was to determine injury, illness, and OPMR rates and associated risk factors for injuries and illnesses among the ARC responders.
Methods
We retrospectively reviewed data collected from the staff wellness program between the years 2008 and 2012. Rates of injuries, illnesses, and OPMR were calculated as the number of health events per 1000 responders. Furthermore, we sought to identify which disaster factors were associated with occupational injuries and illnesses during a deployment. We focused on characteristics available from the ARC national data: disaster category, region, year, and type of disaster. Analyzing specific types of injuries and illnesses was outside the scope of this analysis. This study was considered exempt by the National Institute for Occupational Safety and Health (NIOSH) Institutional Review Board.
The ARC uses 7 levels to categorize disasters and estimate the total cost of an operation. Table 1 shows disaster relief operation (DRO) levels 1 through 7 and their associated costs. Our analysis was limited to categories 3 through 7 because the data were provided by the ARC national headquarters, and information about DRO levels 1 and 2 were kept by local chapters and regions. Because few disasters were categorized for levels 6 and 7, we grouped them with level 5 and created a DRO level we called 5+.
TABLE 1 Costs Associated with American Red Cross Disaster Relief Operations (DRO), by DRO Level

a Because few disasters were categorized for levels 6 and 7, they were grouped with level 5 and called level 5+.
In addition to differentiating the cost of disasters by DRO level, the ARC groups the states and US territories into regions in which disasters occur (Figure 1). The majority of states are shown in Figure 1, but the Pacific region also includes Alaska, Hawaii, and American Samoa, and the Southeast region also includes Puerto Rico and the US Virgin Islands. Furthermore, the different categories of disaster types in our analysis include hurricanes, tropical storms, and typhoons; tornados and cyclones; floods such as flash floods, dam breaks, and landslides or mudslides; and forest fires, consisting of wild fires as well as range and grass fires.
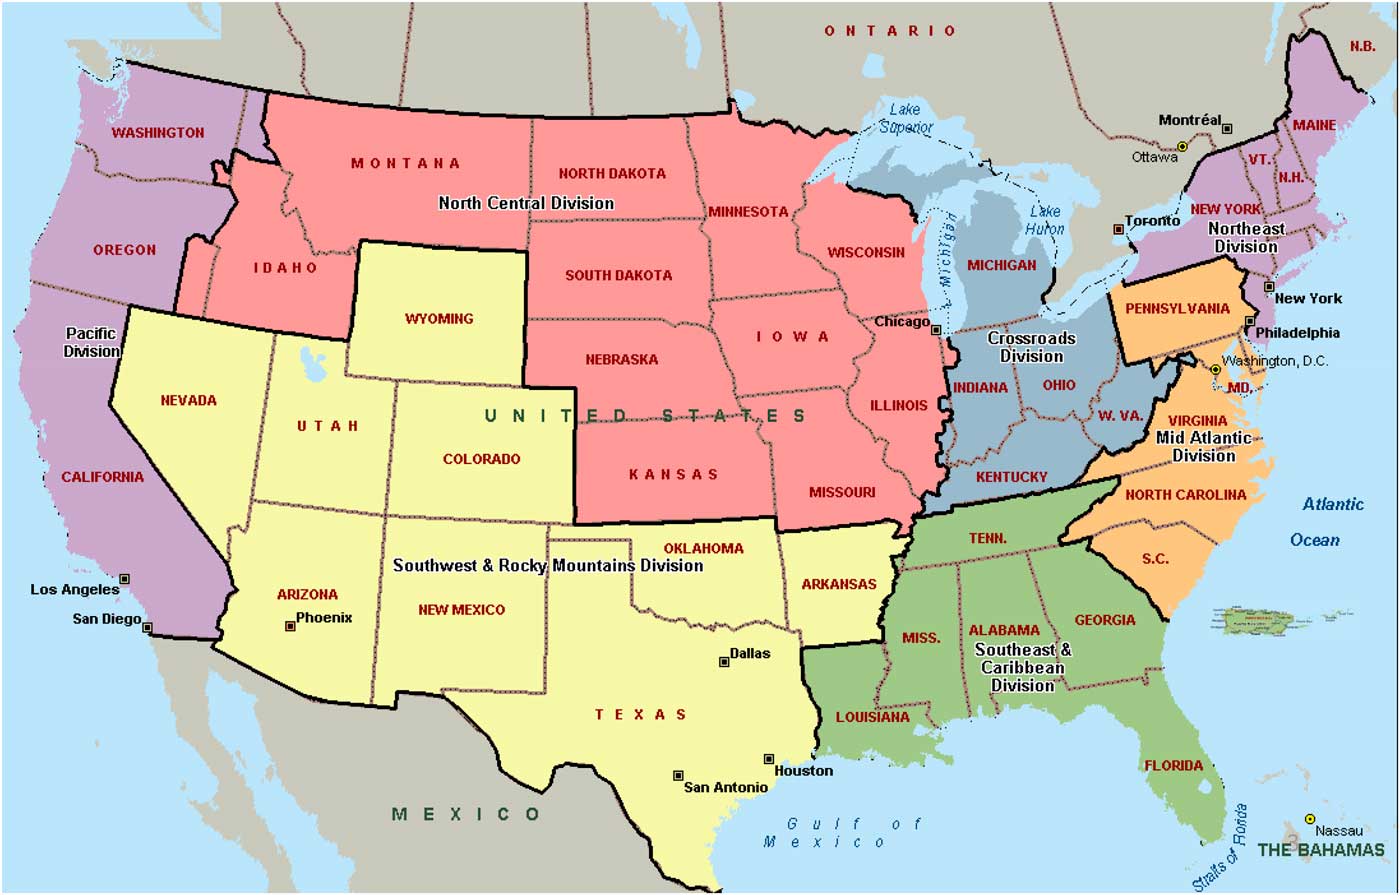
FIGURE 1 American Red Cross Regions. The Pacific region includes Alaska, Hawaii, and American Samoa, and the Southeast region includes Puerto Rico and the US Virgin Islands.
Two datasets were provided by the ARC national headquarters. The first dataset, used to conduct a descriptive analysis, included overall staff injury; illness; and OPMR counts. Rates were calculated by dividing the number of health events (injuries, illnesses, and OPMR) by the number of staff. The second dataset, used to conduct statistical modeling, included a unique identifier associating a particular disaster with its corresponding DRO level; disaster type; region; and year. A negative binomial regression, using maximum likelihood estimates, was conducted in SAS version 9.3. Rate ratios, with 95% CI, were calculated, and backward elimination was conducted with a P value of less than or equal to .05 for inclusion of variables into the final predictive model. No information about individual responder characteristics was available.
Results
The first dataset includes a total of 73 099 staff, 923 injuries, 2022 illnesses, and 385 OPMR cases. Figure 2 shows injury, illness, and OPMR rates per thousand responders by year. The highest rates occur in 2009, with an injury rate of 36.7/1000 responders, an illness rate of 72.9/1000 responders, and an OPMR rate of 11.1/1000 responders. The median rates by DRO level, disaster type, region, and year are shown in descending order in Table 2.
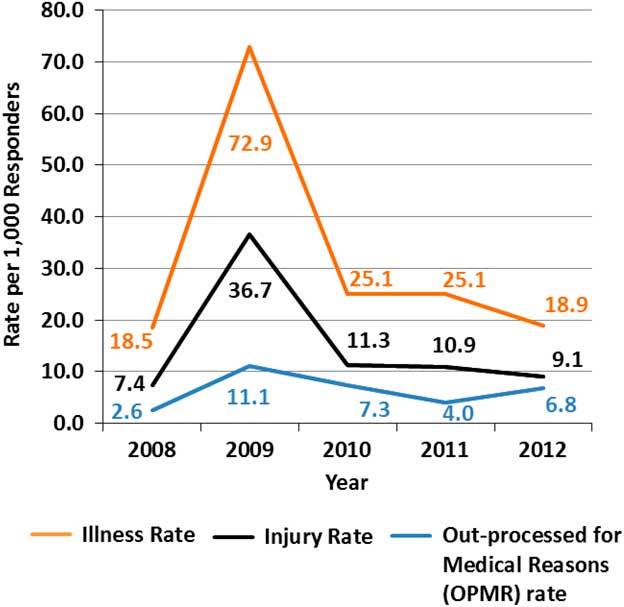
FIGURE 2 Injury and Illness Incidence Rates per 1000 Responders by Year.
TABLE 2 Median Rate and Range of Health Events by DRO Level, Disaster Type, Region, and YearFootnote a

a DRO indicates disaster relief operations; OPMR, out-processed for medical reasons.
b Rate and range are number of health events per 1000 responders.
c Other disaster types include blizzards, snow, hail, ice storms, earthquakes, and explosions.
The majority of disasters were of DRO level 3, followed by DRO level 4, then DRO level 5+. DRO level 5+ had the highest median rates of injuries (18/1000 responders), illness (36/1000 responders), and OPMR (15/1000 responders). Floods were the most frequent disaster, followed by tornados, yet hurricanes had the highest median rates of injuries (14/1000 responders) and illnesses (18/1000 responders). Disasters in the “Other” group, which included blizzards, snow, hail, ice storms, earthquakes, and explosions, had the greatest rate of OPMR (14/1000 responders).
The highest number of disasters occurred in the Southwest and Southeast regions of the United States. The Crossroads region, which includes Michigan, Indiana, Ohio, West Virginia, and Kentucky, had the highest median rate of injuries (17/1000 responders). The Southeast region had the highest rates of illnesses (21/1000 responders) and OPMR (2/1000 responders). As illustrated in Figure 2, the injury and illness rate per 1000 responders peaked in 2009.
The second dataset included a total of 113 disasters. The results for the total injuries-, illnesses-, and OPMR-adjusted models have been shown in Tables 3 through 5. The disaster type and region variables yielded P values greater than .05 and, therefore, were eliminated from the final models. The adjusted model for total injuries included the variables DRO level and year, of which the latter showed that years 2009 and 2011 were significant predictors for injury. In the adjusted models for total illnesses and OPMR, DRO level and year, once again, were the only significant variables. However, 2009 was the only year identified as a significant predictor for illness and OPMR.
TABLE 3 Rate Ratios (RR) and 95% CI for Total Injuries-Adjusted Model, by Select Characteristics

a Because few disasters were categorized for levels 6 and 7, they were grouped with level 5 and called level 5+.
b Other disaster types include blizzards, snow, hail, ice storms, earthquakes, and explosions.
TABLE 4 Rate Ratios (RR) and 95% CI for Total Illnesses-Adjusted Model by Select Characteristics

a Because few disasters were categorized for levels 6 and 7, they were grouped with level 5 and called level 5+.
b Other disaster types include blizzards, snow, hail, ice storms, earthquakes, and explosions.
TABLE 5 Rate Ratios (RR) and 95% CI for Out-Processed for Medical Reasons-Adjusted Model by Select Characteristics

a Because few disasters were categorized for levels 6 and 7, they were grouped with level 5 and called level 5+.
b Other disaster types include blizzards, snow, hail, ice storms, earthquakes, and explosions.
Discussion
It is important to note that the ARC is not the only organization that responds during a disaster. Support from other organizations for certain functions may impact cost and the data collected. In this analysis of the ARC data, DRO level is a significant predictor for injuries, illnesses, and OPMR. DRO level could be a proxy for other factors such as lengthy or multiple deployments, as well as austere conditions. We have had no information on the length of deployments, whether responders deployed multiple times, or the austerity of conditions. A DRO level 5+ may have required a longer period of deployment than DRO levels 3 or 4. This finding underscores the importance of collecting medical histories and carefully selecting and training responders for anticipated deployments to disasters with higher DRO levels. The ARC may reconsider collecting an HSR for all responders annually so that changes in health status are documented.
In the United States, the estimated occupational injury and illness expense for both medical costs and lost earnings has been estimated as $177 billion annually.Reference Leigh 7 It has been proposed that employers with strong safety programs experience a $3:1 return on investment. 8 Therefore, factors that contribute to injuries, illnesses, and OPMR among responders may be further assessed. Response organizations are often in need of volunteers, particularly when a severe disaster occurs. The potential costs of an injury or illness will need to be weighed against deploying higher numbers of volunteers into the field. In other words, deploying a greater number of less medically suitable responders to large or severe disasters may result in an increased risk of injuries and illnesses.
Flooding was the most commonly occurring disaster in our analysis, which is consistent with previous reports in the literature.Reference Jones 9 Hurricanes occurred less frequently but were associated with the highest rates of both injuries and illnesses, which may be attributable to the total land area covered by hurricanes relative to other disaster types. Initially, it was unclear why injury rates were highest in the Crossroads area, because hurricanes, which are associated with the highest injury rates, do not typically occur in that region. After further review of the data, we noted that the crossroads region had the lowest proportion of DRO level 3 disasters. Therefore, the Crossroads region tended to have more severe disasters that were not hurricanes, which could account for the high injury rate.
When median rates for injuries, illnesses, and OPMR were calculated by year, the highest rates occurred in 2009 (Figure 2). One possible explanation for this sharp rise was the 2009 H1N1 pandemic. Because of the pandemic, surveillance was heightened to monitor responders for symptoms of influenza-like illness, which may have increased awareness about reporting procedures for illnesses and, therefore, injuries in 2009. To some extent, this could have explained why 2009 was found to be a significant predictor of injury, illness, and OPMR in the adjusted models. In addition, 2011 was found to be significant predictor in the adjusted model for injuries, which may be attributable to a high number of DRO level 4 disasters that occurred that particular year.
Another outcome of interest from this analysis was the overall percentage of injuries compared with that of illnesses. The NIOSH worker health chartbook indicated that, among occupational injuries and illnesses for private industry captured by the BLS SOII in 2001, about 94% were injuries and 6% were illnesses. 10 In our analysis, 31% of recorded health events were injuries and 69% were illnesses. Several reasons may have accounted for the discrepancy. The data in the NIOSH worker health chartbook were collected from BLS SOII. Because BLS SOII relies on OSHA recordable information for work-related injuries and illnesses, these health events may have been under-reported.Reference Ruser 11 However, some responders may have reported mild symptoms that are not typically reportable to OSHA, thereby inflating the number of illnesses in the ARC dataset. Furthermore, the 2009 H1N1 pandemic may have generated some over-reporting of illnesses, as previously mentioned. Because organizations sometimes classify injuries and illnesses differently, some injuries could have been classified as illnesses. For example, heat stress may be classified as an injury or an illness, depending on how an organization has defined each and historically has recorded the information. Finally, the ARC tracked injuries and illnesses that do not necessarily meet the OSHA definition of work related (eg, a hypoglycemic episode in a person with diabetes).
The US National Response Team, an organization of 15 federal departments and agencies responsible for coordinating emergency preparedness and response to oil and hazardous substance pollution incidents, 12 has developed a system for protecting responders. Emergency responder health monitoring and surveillance (ERHMS) is a framework that includes tools specific to responders during all phases of a response, including predeployment, deployment, and postdeployment. During the predeployment phase, responders are placed on the roster and their credentials are verified, health screenings are performed, and health and safety trainings are provided. During the deployment phase, onsite in-processing of responders takes place, and health and exposure monitoring and documentation occur throughout the response. Finally, the postdeployment phase includes out-processing assessment of responders; postevent tracking of responder health and function; documentation of lessons learned; and after-action assessments. 13 ARC’s staff wellness program partially meets the requirements of ERHMS, but full implementation of this system may be valuable.
Our recommendations, consistent with those of EHRMS, may assist in the collection of accurate, timely surveillance data. During a response, data are often collected rapidly and on paper, which could result in missing, incomplete, or incorrect information and untimely analysis due to slow data entry. The limited variables available from the national data allowed us to identify some factors associated with injury and illness rates; however, more detailed information is needed before specific recommendations for injury and illness prevention can be made. For example, data about safety training and use of personal protective equipment might also be collected to assess whether responders may benefit from targeted training about risk factors for occupational injuries and illnesses specific to that disaster. It also would be valuable to examine individual responder risk factors, such as co-morbidities and job functions.
In addition, the ARC may consider conducting a thorough follow-up assessment with responders after an injury or illness to learn more about the circumstances of the health event. The ARC documents new medical restrictions in an individual’s record for review before future deployments, but this information may also be useful in identifying interventions that are immediately necessary for the prevention of other injuries or illnesses among responders still conducting similar activities. An electronic injury and illness surveillance structure may be useful in implementing a more flexible and detailed system to document occupational health events.
Limitations
A few study limitations were noted. Because data on DRO levels 1and 2 were not available to compare with levels 3 through 7, we were unable to investigate determinants of injury and illness in local ARC disaster responses. Some disasters crossed state lines, but because each state kept its own records, they were counted as independent events. Estimates of rates or rate ratios would likely not have been affected by this, but confidence intervals might narrow, increasing the probability of finding false-positive associations. Also, injury and illness rates for 2009 may not have been comparable to other years because of increased reporting throughout the H1N1 pandemic. We analyzed results with 2009 data included and excluded, and results remained unchanged (data not shown). Furthermore, our models did not allow for the inclusion of all disaster data because the secondary dataset was the only one with a disaster unique identifier. Finally, data about individual responder characteristics (eg, comorbidities and job functions) were lacking.
Our study had several strengths as well. To our knowledge, this analysis has been the first to include several years of the ARC disaster data for determining rates of work-related injury and illness. Disaster information was collected from all regions of the United States, which increased the reliability of our findings. Finally, our analysis accounted for volunteer responders, which other sources of data on occupational injuries and illnesses may not have included.
Conclusions
The ARC is an organization that offers support and assists in meeting basic needs to help individuals return to a life of routine after a disaster. Our findings have shown that DRO level is a significant predictor for injuries, illnesses, and OPMR. To ensure responders are healthy before deployment and to minimize their risk of injuries and illnesses once they are deployed, the organization may consider revisiting the policy of collecting an HSR on each responder annually so that changes in health status are documented. The ARC may also consider fully implementing the ERHMS system and developing an electronic surveillance system to document and collect information that can be used for future analyses.
Acknowledgments
Marie De Perio, MD; Sara Luckhaupt, MD, MPH; and Nancy Smith reviewed the manuscript.
Disclaimer
The findings and conclusions in this report are those of the authors and do not necessarily represent the official position of the Centers for Disease Control and Prevention, National Institute for Occupational Safety and Health.


