


Burn disaster (also known as Burn Mass Casualty Incident BMCI) is defined as a condition in which the influx of patients exceeds the capacity and capability at which a burn center can cope. 1 Although burn disasters are uncommon, they can be devastating to a system if they occur. The rising tension all over the globe and increases in terrorist-related operations make burn disaster an expected consequence in any country. This places burn centers in the face of the reality that they might be confronted with a staggering number of patients. Thus, ensuring the proper functionality of the system is the key element to face such challenging incidents.
Belgium is an industrial country that has many installations known as Seveso. (Seveso is named for a region in Italy that suffered a chemical disaster from which several European legislations have emerged to control hazards in industrial factories.) Currently, there are around 350 Seveso factories; more than half of these Seveso plants are located in the Flemish region. The term Seveso refers to factories that are vulnerable to the risk of disasters. According to European standards, Seveso factories are classified into high- and low-risk groups. To the high-risk one belongs the categories of chemical, petrochemical, and nuclear factories, which are more prone to the risk of burn disaster. Reference Mortelmans, Van Boxstael and De Cauwer2 Add to this the fact that it is a densely populated country and this makes the next burn disaster with a considerable number of casualties likely. Several burn disasters have happened worldwide, and Belgium was not immune. Reference Saffle3,Reference Cassuto and Tarnow4 In the past 30 years, major disasters affected the country, including the terrorist attack on the Catholic University of Louvain (UCL) in Brussels, Switel hotel fire in Antwerpen, Cockerill factory disaster in Liège, Ghislenghien gas pipeline explosion in Hainaut province, and finally the terrorist attacks in the City of Brussels. The ideal geographic location of burn centers has long been debated in studies. Reference Klein, Kramer and Nelson5 The objective of this study is to examine the coverage area of each burn center in Belgium as well as determine the accessibility of the population in disaster-prone areas to these centers, taking into consideration a burn disaster scenario.
METHODS
The role of the Geographic Information System (GIS) is well-known in planning for disasters and humanitarian emergencies. Reference Kaiser, Spiegel and Henderson6 The ArcGIS is an online tool that allows allocation of points based on its entry in the comma separated value (CSV) sheet. In this study, we performed a cross-sectional analysis of the secondary data using ArcGIS. 7 The exact location of each burn center was obtained from the Belgian Association of Burn Injury website (www.brulures.be) and entered into a CSV file sheet (2012 Microsoft Corporation by Impressa Systems, Santa Rosa, CA). Currently, there are 6 burn centers in Belgium. Each center assigned to the exact location on the online map tool. We obtained the last Belgian census of 2011 as CSV sheet from the Department of Belgian Statistic (Statbel). Belgium consists of 3 main regions, namely Walloon, Flemish, and the capital Brussels. Totally, there are 10 provinces divided into 44 districts/municipalities (also known as Arrondissement) and 589 communities (Figure 1). Additionally, we considered the Seveso facilities that are vulnerable to risk of burn disasters; therefore, the locations of the Seveso factories were retrieved from the Seveso Belgium website (www.seveso.be).

FIGURE 1 Map of Belgium.
Maximum Coverage of the Burn Centers
To improve burn disaster planning and comprehend challenges faced by the burn centers in a better way, it is important to know the optimum area that could be served by each center. Because this study was a part of a study investigating the capacity and capability of burn centers in Belgium, we obtained information on how the system responds to burn disasters in Belgium. The Belgian Association of Burn Injury plan (BABI plan) is a special plan for Burn Disasters. Upon the activation of the BABI plan, the Central Coordination Office in Brussels city would collect all information on the available resources, including bed capacity from all burn centers. This is followed by direct instructions to ambulance stations that are attached to the burn centers to dispatch ambulance units to a disaster scene. Subsequently, burn victims would be transported to the nearest burn center that has both the capacity and capability to accept further patients. Once the number of burn victims exceeds the local capacity, the decision is made to transfer patients to neighbor countries. However, this point is beyond the scope of this study, and we only focused on the local capacity of the burn centers (Figure 2).

FIGURE 2 Communication and Transfer Hierarchy in the Event of a Disaster. Abbreviations: BABI, Belgian Association of Burn Injuries; EMS, Emergency Medical Services.
Each center assigned to its exact location based on the region, province, postal code, and finally the street address. ArcGIS tool has an interactive map that makes the allocation of the exact site based on the online street map tool. The population data from the census were summarized and entered into the GIS tool. In each district, we used the GIS tool to calculate the centroid (the point that represents the mean of the center) of the population in that district. A similar maneuver was applied to calculate the cluster of Seveso factories.
It is assumed, based on previous studies, that the best driving time would be 30 min, taking into consideration the time lag from the first alarm call to the moment of dispatching an ambulance to a disaster scene. Reference Branas, MacKenzie and ReVelle8 , Reference Branas9 The proximity tool in ArcGIS is a convenient tool that allows calculation of maximal coverage of an institution based on its location in relation to the surrounding area. Because small ambulance trucks are used in Belgium, it is assumed that these trucks would travel at speed close to normal driving speed. Reference Kolesar, Walker and Hausner10 Therefore, the normal driving time option was checked, but it was assumed not to be constant between different burn centers. The traffic option was checked, and it was assumed that a burn disaster happens during mid-working day (typically Monday, 12 pm). Because the area that each center could cover within 30 min needed to be known, the split mode was used. The split mode causes areas from different input locations that would overlap each other to split in the middle, so they abut one another instead. Then the analysis was run using map layer extent, where the GIS tool chooses the best possible route in which an ambulance could drive to reach the maximum point within a half an hour driving time.
Accessibility to Burn Centers
Transport issues are one of the well-known challenges faced in a massive casualty burn incidence. Reference Welling, Van Harten and Patka11 , Reference Cairns, Stiffler and Price12 This section aims to explore how many minutes are required by ground transport to access each burn center in Belgium from its corresponding districts and a Seveso factory cluster. A unique identification number (ID) for each of the 6 burn centers had been assigned. At the same time, the best possible distance for each of the districts to the closest burn center was calculated using the GIS tool. Then the ID of the burn center was matched to the ID of the closest district in the CSV sheet. For example, the cluster of the population who live near or around the province of Hainaut was connected to the Charleroi Burn Center because it is the closest one to each of the districts of the province.
However, some of the provinces consist of many communities that are close to the burn center in another province (mainly at the borders). In this occasions, the communities that belong to a similar province were connected to the closest center in another province and they were coded accordingly. For instance, the same Hainaut province has communities that are close to both Ghent and Charleroi burn centers. Therefore, these communities were coded differently depending on the closest possible distance to those burn centers. This process was applied also to the cluster of Seveso plants.
Then the analysis was run individually for each burn center using the point to origin-destination connection tool in ArcGIS. It was assumed that the point of origin is the district/Seveso centroid point and the point of destination is a burn center. The driving time mode was used assuming that both normal car and ambulance trucks would travel at a normal route with almost the same speed limit. Reference Kolesar, Walker and Hausner10 This is because in massive casualty incidence not all patients would be transferred by ambulance, but rather by other means include private cars and taxis. Reference Welling, Van Harten and Patka11 , Reference Harrington, Biffl and Cioffi13 The ArcGIS tool calculates the best possible route that ambulances and/or cars could travel with the best possible distance.
Additionally, to have a better idea over the hierarchical flow of the patients potentially overwhelming a center, we have calculated the distance between the individual burn centers based on the bed capacity using proximity tool. Basically, once a burn center is overwhelmed, a transfer is carried out to the Brussel burn center because of its central location and ease of accessibility from other burn centers. Moreover, it is the largest and the most capable center in Belgium (Figure 3).

FIGURE 3 Average Distance and Driving Time Between Different Burn Centers.
RESULTS
Maximum Coverage Area of the Individual Burn Centers
There are 6 burn centers in Belgium located in 6 different cities: Brussels, Antwerpen, Ghent, Leuven, Liège, and Charleroi. These centers cover burn care in the entire Belgian state (Table 1 and Figure 4). The total bed capacity for the entire Belgian center is around 70 beds, and the average bed occupancy is around 65%. This leaves a crude percent of around 6.5 beds per 1 million compared with the neighbors of Belgium, such as Germany that has around 2 per million, 14 the Netherland that has around 3 per million, Reference Welling, Van Harten and Patka11 France around 5 per million, Reference Bargues and Fall15 and even to small countries like Switzerland. Reference Potin, Sénéchaud and Carsin16
TABLE 1 Maximum Area Covered Within 30 Min Driving Time by Each Burn Center in Relation to Population


FIGURE 4 Coverage of the Burn Centers in Relation to the Populations’ Cluster Within 30 Min Travel Time.
The Flemish region in the north of Belgium is mainly covered by the 2 burn centers located in Ghent and Antwerpen cities. The districts that obtained maximum coverage by ground transport within 30 min are some of the districts of the East Flanders province, including the municipalities of Ghent, Termonde, Aalst, Oudenaarde, and the West Flanders province including the Kortrijk municipality. These provinces are covered by the Ghent burn center. In a similar manner, Antwerpen and Mechelen districts of Antwerpen province are covered by the burn center that is located in Antwerpen city. This holds to be true for the majority of the Seveso factories that are located in both of these provinces (Figure 5). The Turnhout district in Antwerpen province, parts of Flemish Brabant province, and the Brussels region are all covered by the major military burn center that is attached to the Queen Astrid hospital in Brussels city. The rest of the Flemish Brabant province is the Leuven district, which is covered by the Leuven burn center. Of the around 15 Seveso classified factories located in Brussel and Leuven, all of them are covered by the half an hour driving window.
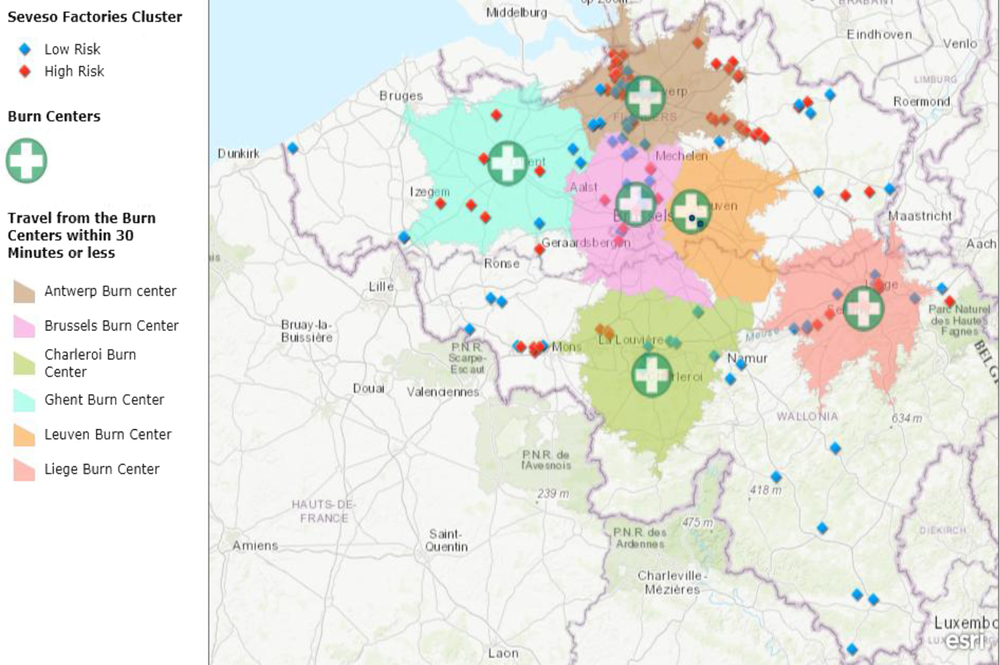
FIGURE 5 Coverage of the Burn Centers in Relation to the Seveso Factories Cluster Within 30 Min Driving Time.
The Walloon region is located in the south of Belgium, and it is covered by 2 burn centers located in the cities of Charleroi and Liège. The Charleroi burn center covers some but not all parts of the Hainaut and Namur provinces with the majority of the Seveso locations in these provinces, respectively. Finally, the Liège burn center covers the whole province of Liège and some parts of Limburg province. Totally, around 7.3 million people in Belgium are covered within the 30 min driving time from the burn centers. This could be converted to a percentage of approximately 65% percent of the total population.
However, the analysis showed that some of the Belgian provinces with its corresponding Seveso facilities are not reachable within the 30-min time interval, particularly in the southern parts of Belgium. According to the analysis, the province of Luxembourg does not obtain cover within the 30-min drive of ground transport. In the north, the province of West Flanders has the same issue, despite the presence of the Ghent burn center in that area. In the same manner, Seveso factories located in the province of Hainaut and Limburg on the west and east, respectively, have no cover within this 30-min window. Finally, the district of Dinant in Namur province also is not accessible within 30-min drive from Charleroi burn center.
Accessibility of the Population to the Individual Burn Centers
Population accessibility is defined as the percentage of people that could reach a healthcare facility within a certain time. Reference Branas, MacKenzie and Williams17 In this section, every burn center has been matched with districts and communities that are close to it. Then the distance in kilometers, time in minutes, and the number of people that could access a burn center were calculated accordingly. This method was also used to calculate the distance from the clusters of Seveso factories to the corresponding burn centers (Tables 2 and 3).
TABLE 2 Accessibility From the Individual Districts to the Corresponding Burn Centers

TABLE 3 Accessibility From the Seveso Clusters to the Individual Burn Centers

Brussels Burn Center
Fifty-four communities were assigned to the military burn center in Brussels city. The provinces that are covered by Brussels burn center are the capital Brussels and part of Flemish Brabant province represented by the Hal-Vilvorde district. According to the previous analysis, the Brussels burn center covers all parts of Brussels city within the 30-min driving window. The average distance that ambulances in those areas drive to reach the burn center is approximately 10.5 kilometers, corresponding to an average time of 19.11 min. This concludes that approximately 1.7 million people who live in Brussels and Flemish Brabant have accessibility within an average 19-min driving time to the Brussels burn center. The Seveso plants in the region access the burn center within a 30-min driving window, but the analysis showed that it is located slightly farther than the calculated population’s centroid with an average distance of 13 kilometers.
Leuven Burn Center
People living in the Flemish Brabant province are covered by 2 close burn centers, which are Brussels and Leuven, respectively. All of the 31 communities that are situated in the Leuven district are covered by Leuven burn center. The average driving time is approximately 12 min by ground transport, giving an average distance of approximately 8 kilometers. Around 0.5 million people have accessibility within this time to the Leuven burn center. The 5 Seveso plants in Leuven province have average accessibility time of 11 min from its corresponding location.
Antwerpen Burn Center
The Antwerpen burn center covers all of the province of Antwerpen with its territories within the Flemish region. A total of 70 communities are assigned to this center, according to the analysis. The average time to access the burn center is around 22 min within an average distance of approximately 24 kilometers. The farthest district in this region is the Turnhout district with its communities reaching to a maximum driving time of 36 min. A total 1.8 million people have accessibility to the Antwerpen burn center. The bulk of the high-risk Seveso factories situated in the Flemish region, including Antwerpen province, obtain enough coverage within an average 25-min driving time, except those that are situated in the Turnhout and Massik districts; these districts require an average of 35 min to access the burn center from the Seveso plants.
Ghent Burn Center
The Ghent burn center covers the majority of the Flanders area, including both the East and West Flanders provinces. In addition to this, it covers part of Hainaut province. Totally, our analysis revealed that 150 communities are close to the Ghent burn center. The average driving time to reach the Ghent burn center from West Flanders communities is around 26 min, giving an average distance of 28 kilometers. However, people living in the East Flanders district need slightly more time to reach the Ghent burn center than do those living in the West district, reaching an average time of up to 42 min and a driving distance of 62 kilometers.
On the other hand, the Mouscron, Ath, and Tournai districts of Hainaut province in the Walloon region had an average distance of 65 kilometers and driving time of 48 min. The farthest driving distance is for some of the districts located in the north borders, reaching distance up to 80 kilometers and driving time up to 55 min. The total population that has accessibility to the Ghent burn center is 2.9 million. The rest of the Seveso plants in the Flemish region that are not covered by Antwerpen burn center have good accessibility to the Ghent burn center, except those located in Tournai and Soignies districts of Hainaut province as well as the Verune district. More than 45 min is needed to access the closest burn center in these areas.
Charleroi Burn Center
The Charleroi burn center, attached to the Grand hospital of Charleroi, covers the majority of the Walloon region, including the provinces of Namur, Walloon Brabant, Luxembourg, and a large part of Hainaut province. A total of 156 communities are covered by the Charleroi burn center. The average travel time from the districts of Namur province is 33 min, while it is 26 min for Walloon Brabant. The rest of the districts of Hainaut province are located on average 48 kilometers away, giving a driving time of 36 min to the Charleroi burn center. It is obvious from the previous analysis that the province with poor coverage is Luxembourg in the south of Belgium, which is an average distance of 140 kilometers away from the nearest burn center in Charleroi. People living in Luxembourg need an average driving time of approximately 84 min to reach the closest burn center of Charleroi. The Charleroi burn center covers 2.4 million people. This also applies to Seveso factories that are installed in the Vitron, Luxembourg, Marche-en-Famenne, and Neufchateau districts of Luxemburg province. Should a burn disaster happen in these areas, the mobile service needs an average time of 74 min to transport victims to the nearest burn center.
Liège Burn Center
The Liège burn center covers the rest of the Walloon region, in addition to the province of Limburg in the Flemish region. A total of 130 communities have an average accessibility time of approximately 24 min by ground transport with an average distance of 39 kilometers. The farthest point in this analysis is the district of Maaseik in Limbourg province, which is 70 kilometers away from Liège burn center with a maximum driving time of 50 min. A total of 1.9 million people living in these provinces are covered by the Liège burn center. Although the Seveso factories in Limburg province are situated between the Liège and Antwerpen burn centers, respectively, they have very limited access to both burn centers.
DISCUSSION
Population accessibility is defined as a percentage of the population that could reach a burn center at any given time, while land accessibility is the percentage of land area that a burn center could cover within a certain time. Reference Branas, MacKenzie and Williams17 History proved that Belgium is not immune to burn disasters; 5 major burn disasters happened in the past 30 years. It is well-known that transportation is one of the impeding factors in response to burn disasters even in a small country that has an accessible transportation network. Reference Welling, Van Harten and Patka11 Sudden massive scale disaster requires the mobilization of maximal transportation resources. Reference Cassuto and Tarnow4 Therefore, it is crucial to plan exactly how transportation paths would be carried out. Determining accurate coverage and accessibility would help in better planning and response to burn catastrophe in the future. Moreover, accurate triage and timely transportation of burned victims is the ultimate goal of any successful disaster response. Reference Kearns, Hubble and Holmes18
The distribution of burn centers relative to the population in Belgium has not been studied before. According to our knowledge, this is the first article that targets this subject. Because Belgium has an excellent road network, the usual way of transportation is done by ground ambulances. In addition to this, aeromedical transport is not immediately available in Belgium, and it takes time to be activated. Reference Pirson and Degrave19 Therefore, this study focused mainly on the ground means of the transfer. Disaster transportation is often carried out by emergency medical service teams with ambulance trucks. This might be limited to some extent, particularly in a situation where massive casualty applied. This point is crucial because the analysis shows that large areas in the south and north parts of the country are not adequately covered by a half an hour mobile transport window. Therefore, maximizing coverage and accessibility of the population living in these areas are important components for planning for disaster responses in the future.
In the event of a disaster, the Belgian disaster plan activates a protocol that sends at least 3 medical teams and 5 ambulances to a scene. This would be sufficient for small scale disasters that produce around 10 to 15 casualties, but it might not be the case for the massive one. The Ambulance Strike Team in the United States involves multiple ambulances with its full team that is activated to transfer patients should disaster prevail, and this leads to shortening transfer time. Reference Goss20 This is essentially difficult to apply to the Belgian situation, taking into consideration the availability of resources and burn specialists. Thus, planners have the option of allocation to different health facilities to obtain the best possible response to a massive burn disaster.
Regarding accessibility, the analysis shows variation in the time that people could reach the burn units. The areas with poor accessibility are those located at the borders of the country, and basically near neighboring countries. A massive disaster that distroys the infrastructures might restrict the movement of vehicles and impede the transportation of patients. One of the successful ways to achieve a better medical outcome in a disaster setting is by having well organized and accessible transportation routes and resources. Reference Diaz, Hendey and Bivins21 It has been proven that up to 40% of trauma-related death could be decreased just by improving the accessibility to an appropriate healthcare facility within the appropriate time. Reference Diaz, Hendey and Bivins21 Additionally, surviving severe trauma depends essentially on the time that it takes to receive primary care. Reference Sheridan, Weber and Prelack22 Although there is no golden hour in burn management, delay in providing definitive measures, such as intubation, would affect the outcome of survivals. As a result, improving accessibility and reducing transport time would improve survival drastically. Reference Branas, ReVelle and Mackenzie23
We believe that it is crucial to know the distance and the time that it takes to reach burn centers from each of corresponding districts, because in large scale burn disasters it is expected that not all patients would reach burn centers by ambulances. Therefore, by having an idea of the accessibility, policy-makers could have a better insight on the best possible positioning of burn centers as a part of disaster planning. Last but not least, this model and results not only are beneficial during times of disaster, but also during normal daily care. This reflects maximizing the use of available resources and, thus, an improvement in the healthcare system and service delivery.
Strength and Limitation of the Study
To our knowledge, this is the first study in Belgium that considers burn centers’ coverage and accessibility in relation to populations, taking into consideration a disaster scenario. Therefore, this study could serve as a prototype model for stakeholders in Belgium as well as other neighboring countries that have suffered previously from burn disasters, such as The Netherlands, to enhance the coverage and accessibility to burn units. Reference Welling, Van Harten and Patka11
However, there are several limitations to this study. First, we calculated the centroid of districts based on where the population and Seveso factories clusters are concentrated, but this does not necessarily mean that burn disasters would happen at the same point of the centroid; rather, it might happen in different locations. This means different routes and different driving times would be calculated by the ArcGIS tool. Second, The GIS tool automatically calculated the best possible driving time within the best possible distance based on the normal speed entry, but we did not have control over that. Therefore, there might be a better way and a shorter duration considering the terrain, rural roads, and the speed limits. Third, in this study, the GIS tool combined the urban, suburban, and rural routes together; however, it has been proven that the driving time between these 3 routes is different. Reference Klein, Kramer and Nelson5,Reference Kolesar, Walker and Hausner10
Finally, we assumed that the ambulances would move only from hospitals with a burn center. Although this might hold true in some situations, because most of the burn centers in Belgium are part of a large university hospital, in a disaster setting, it is normal that ambulances from other hospitals would be dispatched to a disaster scene to transfer patients and thus compensate with deficiency of coverage. Moreover, even though the districts located near the borders are not fully covered by Belgian burn centers, it is possible for the population living there to obtain care from close burn centers in neighboring countries, should a burn disaster happened. This is because there is an agreement signed by European insurance companies that makes it possible for European citizens to receive care in any European countries, in this case, France, Germany, and the Netherlands.
CONCLUSION
The objective of this article is to determine the coverage of each burn center within a half an hour driving time using ground transport in Belgium as well as to determine the accessibility of both population and disaster-prone areas to those centers. The analysis shows that the 6 burn centers in Belgium cover a population of approximately 7.3 million (65%) within a half an hour driving time by the ground transport. Areas with poor coverage are particularly the south and north parts of the country, followed by east and northwest provinces. It is concluded that there is a slight over-supply of burn centers in the mid-part of the country contrasted by a deficient supply in the districts that are situated near the borders, particularly the provinces of Luxemburg and Limburg in the south and western parts of the country, respectively. Nevertheless, the majority of the Seveso factories, particularly in the Flemish region, have good accessibility to the burn centers. This study might be taken into consideration when policy-makers decide on the positioning of burn centers as a part of preparation for massive-scale burn disasters.
Additionally, the stakeholders might use it as a benchmark to allocate better scarce resources. This article is not only important for Belgium, but also to other neighboring countries because it happened in the past that Belgium responded to burn disaster from the neighboring countries. Reference Pirson and Degrave19 We recommend a more in-depth analytic study using an advance mapping system and population demography to determine the best allocation of burn centers in relation to response to disaster components. This study serves also as a model for placement of burn facilities in other industrial countries, which are vulnerable to the risk of burn disasters, in particular, the large industrial European countries such as Germany and France.
ACKNOWLEDGMENTS
This study was prepared as a part of dissertation entitled as Assessment of Capacity & Capability of Burn Centers to Respond to Burn Disasters in Belgium submitted to fulfill a degree of Public Health in Disaster (Epidemiology & Research). We thank Ms. Pascaline Wallemacq (geographer) for providing guidance and help in this study.


