


The public health challenges of the 21st century, such as emerging infectious diseases, biological threats, climate change, unhealthy lifestyles, and living conditions,1-Reference Dunbar, Pillai and Wunschel4 require local and global readiness to respond to the population’s needs by strengthening human resources, quality, and safety.Reference Health Organization5 According to European Centre for Disease Prevention and Control (ECDC), the level of public health microbiology system capabilities and capacities in 30 Europe Union countries measured by the aggregated EULabCap index varies from the low and moderate to high level,6 while only a few countries in the Western Balkan report full public health microbiology system capacity for rare and emerging diseases, such as smallpox, severe acute respiratory syndrome (SARS), and yellow fever.Reference Bajoriniene, Leitmeyer and Struelens7 Although a capable infrastructure of public laboratories for supporting investigations of public health problems, hazards, and emergencies at their disposal may be in place in many countries,Reference Health Organization5,6 by a reform, induced budget cuts and outbreaks indicate that appraisal of their capacity and actual performance are considered necessary.Reference Bajoriniene, Leitmeyer and Struelens7,Reference Aluttis, Chiotan and Michelsen8
In the past 5 y, a series of legal measures in the Republic of Serbia have resulted in the banning of employment and rationalization of the number of employees in the public sector,9 despite obvious and enduring inequities in public health workers supply.Reference Santric Milicevic, Vasic and Edwards10 Such policies present a challenge to the effective management of public health laboratories in emergencies as well as to changing conditions in the labor market. Due to under-investment in technology and organization, and with a lack of health workforce, public health laboratories will not be able to support rapid and effective crisis management, as it can be a long wait for test results, during the epidemic.
Despite the fact that public health laboratory workers play a key role in management and preparedness in disasters and emergencies, many countries,11 like Serbia,12 traditionally lean on simple methods to determine number and composition of workers using density rates (ie, ratio of staff to population method)13 in the health-care sector, including public health laboratories. This method does not provide various necessary information on their performance level particularly important in disaster management and emergency preparedness (eg, organization of work processes, standard operating procedures, workload and activity standards, supply and competence of workers, equipment and infrastructure, etc.), and is not effective in Serbia given the high shortage of key public health specialists in the country, impeding the quality and accessibility of public health service.Reference Santric Milicevic, Vasic and Edwards10 The timely response to public health threats requires a sufficient number of skilled laboratory workers to monitor the health of humans and animals and the environment and accurately and reliably test a wide range of samples.14 The WHO has developed a method for determining how many health professionals of a particular profile are required to perform a certain amount of services in a health facility considering the contextual conditions, the so-called Workload Indicators of Staffing Need (WISN).15 The WISN method has been successfully applied many times in various clinical settings but is less represented in the field of public health.16-Reference Doosty, Maleki and Yarmohammadian25
This study aimed at identifying the needs for the health workforce in 16 public health laboratories in Belgrade, the capital of Serbia, by assessing the workforce activities, workload and activity standards, and workload pressure, using the WHO-WISN method.
METHODS
In 2017, we systematically applied the WISN method15 in 16 laboratories of the City Institute of Public Health, Belgrade. Eleven of 16 laboratories are within the Department of Hygiene and Human Ecology Laboratories (HHE-Labs) and 5 laboratories within the Department of Microbiology Laboratories (MB-Labs). The HHE-Labs is accredited according to ISO 17025 and ISO 9001 standards, and the MB-Labs according to ISO 9001 standards. In line with the decision of top management and WISN method (Supplemental File A, which is available online), we included in the study all analysts and laboratory technicians in both laboratories. In total, there were 99 workers, 27 analysts, and 38 laboratory technicians from HHE-Labs, and 9 analysts, and 25 laboratory technicians from MB-Labs. In HHE-Labs, analysts (with a master’s degree in chemistry, technology, or specialists in sanitary chemistry, sanitary microbiology and medical biochemistry, bachelor’s degrees in chemistry, biochemistry, biology and technology, pharmacy, and veterinary medicine) and technicians (chemical and medical laboratory technicians) and in the MB-Labs analysts (medical doctors, specialists in microbiology with parasitology) and technicians (medical laboratory technicians) surveil and monitor the safety and quality of health (humans and animals), the living and working environment, and the products for general use.
The WISN method was applied to consider the possible workload and personnel changes over the 2014-2016 period. The 3-y data provided insights into the true capability of laboratory capacity and capability for productivity and, indirectly, the demand for laboratory services, and allowed us to avoid potential biases related to the analysis of 1-y data. The available working time (AWT) is calculated as the number of weeks in a year multiplied by the number of working days a week of a laboratory worker, deducting the number of days for absences including annual leave, public holidays, sick leave, and other reasons (Supplemental File A). The AWT in the study presents the average AWT for each workforce category over the 2014-2016 period.
Data on workload components, activities, and their time duration were collected through the semi-structured interviews with managers and key laboratory respondents of all categories (all laboratory analysts and technicians who were present during the interview), by observations of work processes (shown in e- Supplemental File B1-4), and through the review of laboratory legislation, regulations, reports, and records (daily and annual). The interview had 2 rounds; first to collect information and then to review interpretation and clarifications. Interviews appraised the impact of changes in the laboratory policies, management, training and equipment maintenance, financing, workforce supply, the supply chain with equipment and recurrent material and technologies on the laboratory performance, organization, and standard operating procedures, and we requested for real-time necessary for performing each workload activity.
Data on the type and number of samples analysed were collected from daily records and official statistical reports for the past 3-y reporting period, ie, from 2014 to 2016.26-28
By reviewing the regulatory framework (legislation, job descriptions, standard operating procedures, reporting schemes, etc.), we procured the information necessary to understand the functions and activities of the laboratory, standards of laboratory practice, and operating procedures. After observing workflows in all laboratories, we asked laboratory workers to describe their roles and responsibilities. By illustrating the processes in the workflow charts (Supplemental File B1-4), we were all able to identify possible overlaps in roles and responsibilities and duplication of activities and reasons for changing productivity over the observed period (eg, the introduction of new policies, regulations, work technology and equipment, long-lasting maintaining problems, supplier delays, higher demand, etc.).
The laboratory management and staff decided to analyze workload core activities for handling the samples instead of the substantial number and types of parameters and tests per sample. We have identified core and additional (category and individual) activities, along with the time standards per activity, that is activity standards. The time standards for core activities are expressed as the average time it takes a laboratory worker of a particular profile to perform activities, all together related to the analysis of a sample in local circumstances. Workers determined by consensus the minimum and maximum time required for each activity, taking into account the local circumstances and capacity of the laboratories to operate during 2014-2016. Minimum time reflects performance in circumstances where laboratories had better capacity and capability, and maximum time refers to performance in worse circumstances. The average time was obtained as the mean of the minimum and maximum time. Although we applied WISN to model the demands of the laboratory workforce to ensure the preparedness of the laboratory in better and worse scenarios, only the workforce requirements according to the average time were presented in this study.
The category allowance standards represent the percentage of the AWT for each category additional activity, and individual allowance standards express the unit time in a year for each individual additional activity. These estimations were checked with both the head of the HHE Labs and the head of the MB Labs.
Furthermore, a standard workload of each core activity was obtained by dividing the AWT by the time standard for a particular core activity (Supplemental File A). This information was necessary to assess the needs of laboratory workers in terms of the total number of full-time equivalents (FTEs). The number of FTEs workers required to perform core activities was calculated by dividing the annual workload (taken from annual laboratory records) by the standard workload.
Standard workload for additional activities, ie, category and individual allowance standards (CAS and IAS) were estimated using WISN formulas.15 These were necessary to determine the number of FTE laboratory workers needed to perform additional workload for category (category allowance factor, CAF) and individual activities (individual allowance factor, IAF) (Supplemental File A).
The number of FTE laboratory workers required to accomplish core, category, and individual additional activities is obtained when the product of the number of FTE workers that perform the core activities and the CAF is summed up by the IAF.
The WISN difference between the current and the required FTE laboratory workers indicated a workforce surplus, shortage, or balance per laboratory. Workload pressure is displayed as the WISN ratio of the current and FTE required number of laboratory workers.
In addition, we estimated the density of laboratory workers per 100,000 inhabitants given that these laboratories were set up to meet public health needs in Belgrade (Supplemental File A).
Direct observation of the laboratory processes and review of the records were measures to ensure the reliability of the information obtained by interview. Interviews with participants and observations were conducted with their consent and strict respect for privacy and confidentiality. The study was approved by the Ethical Board of the City Institute of Public Health Belgrade, Serbia (No: 102/2 from May 5, 2017).29
RESULTS
Average Available Working Time
The working time directives in Serbia are 8 working h a d with 30 min for a break and the 5 working d a wk.30 Therefore, the working time over the period 2014-2016 was 52 wk a y, which is 260 d a y (52 × 5 = 260). According to the Labor Law,30 a worker is entitled to annual leave and leave from work due to public holidays and other reasons (personal and family reasons, etc.). Over the 3-y period, the management of the Belgrade City Institute of Public Health reported on average 40 d off, including an average of 27 d of annual leave (ranging from 20 to 35 d), 8 d for public holidays, and 5 d for other reasons. After deduction for absence from work, the average AWT was estimated at 220 d a y (260-27-8-5 = 220), ie, 1650 h or 99,000 min per y for each laboratory worker at HHE-Labs and MB-Labs.
Workload Components, Annual Workload, and Activity Standards
Supplemental File C presents core, category, and individual additional activities of laboratory analysts and technicians.
The annual records show that the annual workload of 16 laboratories varied over the period 2014-2016. The 3-y annual workload was on average 116,856 samples in all HHE-Labs and 902,319 samples in all MB-Labs (Table 1).
TABLE 1 Annual Workload and Time Standards for Core and Additional Category and Individual Activities of Laboratory Workers of the City Institute of Public Health, Belgrade (the Average for 2014-2016) in the (a) Laboratories for Hygiene and Human Ecology, and (b) Laboratories for Microbiology
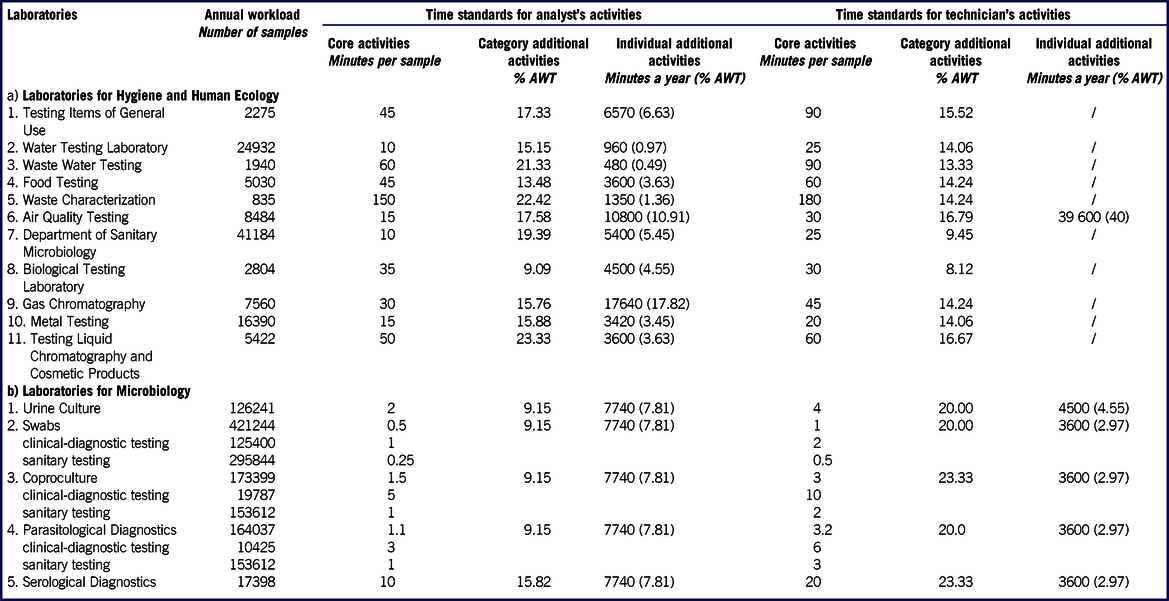
Notes: AWT – Available Working Time; / - additional activities of technicians were not identified; Minutes per sample is the average length of time for sample processing.
In general, laboratory workers spend almost 70% of their available working time in undertaking core activities, and for the remaining time carry out additional activities, categorical or individual. Core activities can last from 0.25 to 180 min per sample, while additional activities vary greatly across different categories of laboratory workers. Table 1 shows more of this information per type of laboratory.
In the HHE-Lab, activity standards for core activities range from 10 to 150 min per sample for analysts and 20-180 min for technicians (Table 1). Category additional activities for analysts and technicians take at most 23.33% and 16.79% of AWT, respectively. Some analysist (in Gas Chromatography Laboratory) spend a further 17.82% of AWT to perform individual additional activities.
In the MB-Lab, activity standards for core activities range from 0.25 to10 min per sample for analysts and 0.5-20 min for technicians (Table 1). Category additional activities for analysts and technicians take at most 15.82% and 23.33% of AWT, respectively. To perform individual additional activities, analysist spends 7.8% of AWT, while technicians 2.97-4.55% of AWT.
Standard Annual Workloads for Core Activities, Category and Individual Allowance Factors, and Staff Required Based on WISN
For analysts in HHE-Labs, the standard annual workload for core activities has ranged from 660 samples (in the Waste Characterization Laboratory) to 9900 samples (in the Water Testing Laboratory and the Department of Sanitary Microbiology). The CAF has been relatively uniform in all units and ranged from 1.10 (in the Biological Testing Laboratory) to 1.30 (in the Liquid Chromatography and Cosmetic Products Testing Laboratory). The minimum IAF was 0.005 (in the Waste Water Testing Laboratory) and the maximum was 0.18 (in the Gas Chromatography Laboratory).
For technicians in the HHE-Labs, the highest standard annual workload for core activities was 3960 samples (in the Water Testing Laboratory and the Department of Sanitary Microbiology), and the lowest was 550 samples (in the Waste Characterization Laboratory). The CAF ranged from 1.09 (in the Biological Testing Laboratory) to 1.20 (in the Air Quality Testing Laboratory and Liquid Chromatography and Cosmetic Products Testing Laboratory).
For analysts in MB-Labs, the standard annual workload for core activities, such as sanitary examinations, ranged from 99,000 samples (in the Laboratory for Coproculture and the Laboratory for Parasitological Diagnostics) to 396,000 samples (in the Laboratory for Swabs). For other core activities, the standard annual workload ranged from 9900 samples (in the Laboratory for Serological Diagnostics) to 99,000 samples (in the Laboratory for Swabs). The CAF was 1.10 in all MB-Labs except in the Laboratory for Serological Diagnostics where it was 1.19. The IAF was 0.08 in all MB-Labs.
For technicians in MB-Lab, the standard annual workload for core activities, such as sanitary examinations, ranged from 33,000 samples (in the Laboratory for Parasitological Diagnostics) to 198,000 samples (in the Laboratory for Swabs), while for other core activities it ranged from 4950 samples (in the Laboratory for Serological Diagnostics) to 49,500 samples (in the Laboratory for Swabs). The CAF was 1.25 in all MB-Labs, except in the Laboratory for Coproculture and the Laboratory for Serological Diagnostics, where it was 1.30. The IAF was 0.04 in all MB-Labs, except in the Laboratory for Urine Culture where it was 0.05.
Laboratory workers are under moderate or high-pressure (depicted by the WISN ratio from 0.86 to 0.50) in HHE-Labs and MB-Labs (Table 2). The WISN difference indicates that Belgrade City Institute of Public Health needs an additional 22.22% of analysts and 20.63% of technicians to perform high-quality standard annual workload of laboratory services. A shortage of 14.81% of FTE analysts (6,600 additional working hours or 4 FTE analysts) and 18.42% of FTE technicians (11,550 additional working hours or 7 FTE tecnicians) exists in HHE-Labs, and a shortage of 44.44% of FTE analysts (6600 additional working hours or 4 FTE analysts) and 24.0% of FTE technicians (9900 additional working hours or 6 FTE technicians) in MB-Labs.To balance the staffing to workload, HHE laboratories need 31 FTE analysts and 45 FTE technicians (Table 2), while MB laboratories need 13 FTE analysts and 31 FTE technicians (Table 2). The time for additional activities greatly varies among analysts (13.64-33.70% of AWT in HHE-Labs and 16.98-23.61% of AWT) and technicians (8.12-16.79% of AWT, and 22.97-26.30% of AWT in MB-Labs).
TABLE 2 WISN Results for Laboratory Workers of the City Institute of Public Health, Belgrade, (the Average 2014-2016) for (a) Laboratories of Hygiene and Human Ecology and (b) Laboratories for Microbiology

Abbreviations: FTE - full time equivalents; WISN – Workload indicators of staffing needs; WISN difference – difference between the current staff number and the number of staff requrements based on WISN method; WISN ratio – ratio of the current staff number and the number of staff requrements based on WISN method
These results can be interpreted as the required coverage of laboratory public health workforce per 100,000 population in Belgrade City Institute of Public Health: 3 analysts and 5.1 technicians per 100,000 population. More precisely, to meet the standard annual workload as in 2014-2016 period and to perform quality activities to current professional national and international standards, Belgrade City Institute of Public Health needs in HHE-Labs 2.1 analysts and 3 technicians per 100,000 (instead of current ratio of 1.8 analysts and 2.5 technicians per 100,000), and in MB-Labs, 0.9 analysts and 2.1 technicians per 100,000 (instead of current ratio of 0.6 analysts and 1.7 technicians per 100,000).
DISCUSSION
Application of the WISN method in public health laboratories revealed that laboratory workers spend almost 70% of their available working time in undertaking core activities. Core activities per sample can take from 0.25 to 180 min. Because the standard annual workload differs, laboratory workers are under moderate or high-pressure (the WISN pressure from 0.86 to 0.50). The WISN difference indicates a shortage of 22.22% of FTE laboratory analysts and 20.63% of FTE laboratory technicians. These results indicate that maintaining the quality of laboratory work and timely availability of their services will be almost impossible without recruiting new staff, minimizing staff fluctuations, standardizing work procedures, and reallocating staff and activities. To balance the staffing to workload, these laboratories need an additional 8 FTE analysts and 13 FTE technicians. They could also consider combination of ousorcing and selective reduction of workload pressure by automating some of the additional activities, while maintaining the competence of laboratory workers and opportunities for professional development and staff motivation.
The Belgrade City Institute of Public Health should have 3 analysts and 5.1 technicians per 100,000 inhabitants to maintain the same volume of work as in 2014-2016. Other WISN studies also found a high shortage and workload pressure in nursing care,16,17,Reference McQuide, Kolehmainen-Aitken and Forster19-Reference Ravhengani and Mtshali22 in midwifery,17,Reference Gialama, Saridi and Prezerakos23 as well as physicians16,17,Reference McQuide, Kolehmainen-Aitken and Forster19 and clinical laboratories staffReference Napirah and Sulistiani24 due to inequalities in the distribution of health workers17,Reference Sousa, Dal Poz and Carvalho18,Reference Ravhengani and Mtshali22 , devoting more of their available working time to support activities,16,17 and performing tasks for which they had not been properly trained.17 Ours and other studies findings strongly support the need for staffing policies that take into account work processes, activity standards, and workload pressure to adequately meet services needs in the local context.
The study results are also in line with recommendations for investment in the health workforce for economic and population growth, as suggested in the WHO 5-y action plan for health employment and inclusive economic growth.31 The role of public health laboratories, as well as the scope of their responsibilities, is likely to grow in the future,1,Reference Health Organization5,14 and to successfully meet the challenges and successfully perform their roles, each public health laboratory should have sufficient competent staff in balance with the workload, because a small workload, as well as a large workload, deteriorates the competencies and attitude toward the job. The results of this study reinforce ECDC observers’ recommendations for financial investments in public health laboratories, including planning and management to obtain a sufficient number of skilled laboratory workforce, laboratory supplies, new methods and techniques, and technologies.Reference Bajoriniene, Leitmeyer and Struelens7
As this study shows, the WISN method is useful to identify workforce needs and workload pressure in a regular situation, but it can also be used to assess workforce needs in various emergencies situations. In the emergencies situations, the number of laboratory tests required from day to day has exponential increases, along with the multiplied working time for performing core activities; thus, the need for staff and equipment increases as well. It also warns that workforce planning and management should be based on various scenarios of the demand for public health laboratory services and capacities, which calls for HRH planners’ expert involvement.
As in other cases,16,17,Reference McQuide, Kolehmainen-Aitken and Forster19 staff and managers involved in the WISN method were able to systematically think about work processes and the need to improve the organization of work activities, recording, and reporting. After initial mistrust, they critically reviewed the workforce planning approach in their laboratory units and became aware of the benefits of a new way of identifying staffing needs by assessing the workload. Participating in this study in a very effective way has helped senior managers understand the changes needed to better position themselves in the lab services market. The biggest challenge in the analysis was the establishment of time standards for each activity, as most employees perceive their work as a continuous operation that depends on several factors (for example, the type and number of parameters being tested). Employees usually analyze a large number of samples simultaneously using mostly automated processes, with some activities representing “machine servicing.” Some respondents were inclined to report a shortened duration, while others “ideal” time of the activity. Using data for a 3-y period, we avoid the potential impact of 1-off events (such as the introduction of new technologies, new policies, lack of resources, epidemics, or environmental threats, such as floods, etc.). Options such as a minimum, average, and maximum of time standard helped solve the problem, as well as direct observation of workflows, although it was limited to 2 wk.
A qualitative and quantitative analysis of the collected data (review of regulations and records, task analysis and direct observation, and creating workflow charts) helped overcome potential shortcomings of interview as a qualitative data collection instrument (eg, subjective perceptions of respondents depending on the circumstances, unnecessary information).Reference Alshenqeeti32
As there are no specific standards in Serbia for staffing public health laboratories,9,12 the study evidence can also be used to negotiate new employment and formulate specific standards for laboratory staff and workload. The results of the study should not be used for direct comparison and generalization with other laboratory settings, as they are specific to the Serbian context. Evidence from this study could contribute to decision-making in the planning process for strengthening laboratory capacity and quality.
As in other countries, in Serbia, labor shortages and distribution in public health laboratories must be addressed by an intersectoral strategic plan for managing and developing the laboratory service, including alignment with International Health Regulation.14 In the future, planning the laboratory workforce for public health goals achievement and return on investment in Serbia should account for the productivity and quality of work aspects. The study showed that WISN can contribute to these endeavors by setting the workload and staff standards in public health laboratories through systematic analysis of working processes, standard operating procedures, activity standards, workload standards, supply, and demand for laboratory services, the competence of workers, equipment and infrastructure, etc.
CONCLUSIONS
Public health laboratories in the Serbian capital have moderate-to-high workload pressures and staff shortages up to one-fifth. To balance the staffing to workload, these laboratories need to employ analysts and technicians and automate some of the additional activities but maintain opportunities for professional development.
Public health laboratories should develop staffing policies and standards based on the laboratory workload, work processes, activity standards, and workload pressure to adequately meet the growing services need in the local context.
Authors’ Contributions
Authors Tripković and Šantrić Milićević contributed equally to this manuscript and are the first authors.
Acknowledgments
The authors thank the management and staff of the City Institute of Public Health of Belgrade (Serbia) for their participation in the interview. The manuscript is part of the results of the master thesis, which was defended in 2017 by Dr. Katica Tripković (mentor, Prof. Dr. Milena Šantrić Milićević), at the Faculty of Medicine, University of Belgrade. Study results were presented at the 11th EPH Conference in Slovenia.
Funding
We acknowledge the support of the Ministry of Education, Science and Technological Development of the Republic of Serbia (Contract No. 175087).
Conflict of Interest
The Authors declare that there is no conflict of interest.
Ethical Approval
The study was approved by the Ethical Board of the Belgrade City Institute of Public Health, Belgrade, Serbia (No: 102/2 from May 5th 2017).29
Supplementary material
To view supplementary material for this article, please visit https://doi.org/10.1017/dmp.2020.133


