

Hurricane Ike was the ninth named storm and fifth hurricane of the 2008 Atlantic hurricane season. After it passed over Cuba and entered the Gulf of Mexico, projections increasingly indicated that the hurricane would probably make landfall somewhere along the Texas coast. As a result, on September 11, 2008, a mandatory evacuation was ordered for all or part of at least 8 Texas counties (Brazoria, Chambers, Galveston, Harris, Jackson, Jefferson, Matagorda, Orange).1 Although as many as 2.2 million Texans evacuated before the storm made landfall, thousands ignored the mandatory evacuation order.2, 3
Hurricane Ike came onshore at Galveston on September 13, 2008, at 2:10 am CDT as a category 2 hurricane with sustained winds of 110 mph (178 kph). The storm resulted in a 13.5-ft (4-m) storm surge and widespread coastal flooding. Power was lost by as many as 4.5 million people. 3–5 On September 13, 2008, President George W. Bush declared 29 Texas counties disaster areas (Angelina, Austin, Brazoria, Chambers, Cherokee, Fort Bend, Galveston, Grimes, Hardin, Harris, Houston, Jasper, Jefferson, Liberty, Madison, Matagorda, Montgomery, Nacogdoches, Newton, Orange, Polk, Sabine, San Augustine, San Jacinto, Trinity, Tyler, Walker, Waller, Washington).6 Government officials and private insurers initially estimated damage in Texas due to Hurricane Ike at $27 to $52 billion.7 As of October 8, 2008, the death toll was at least 37 in Texas and 72 nationwide.8 Around 200 people in Texas remained missing 1 month after the storm’s landfall.9
According to the 2000 US Census, the population of the counties under mandatory evacuation was 4,307,899 and the population of the counties later declared disaster areas was 5,622,128. The population of the 7 counties that were both under mandatory evacuation and later declared disaster areas was 4,293,508, or 99.7% of the population of the counties under mandatory evacuation and 76.4% of the population of counties later declared disaster areas.
Poison centers in the United States receive calls from the public, law enforcement, and health care providers regarding the management of exposures to a variety of substances. Many poison centers also provide pill identification and general information on a variety of topics.Reference Bronstein, Spyker and Cantilena10 Investigations have indicated that poison center operations and call patterns may be affected by events such as earthquakes,Reference Nathan, Olson and Everson11 power outages,Reference Klein, Herzog and Smolinske12, Reference Lumsden, Gallo and Thompson13 snowstorms,Reference Banerji, May and Wruk14 hazardous substance releases,Reference Forrester15 and hurricanes.Reference Forrester16–Reference Schauben, Kay and Schulte20 The present study sought to determine whether the pattern of calls received by Texas poison centers changed due to Hurricane Ike.
METHODS
The Texas Poison Center Network (TPCN) consists of 6 poison centers that together service the entire state. All 6 poison centers use the same telecommunications system and database to answer calls and record demographic and clinical information on the calls. For this study, all of the records involving calls received by the TPCN during September 2008 originating from a known Texas county were identified. Calls from outside the state and from Texas in which the caller’s county was not identified were excluded. The Texas counties were grouped into those declared disaster areas and the rest of Texas.
The daily call volume was determined for the 2 geographic areas and graphed. This was performed for total calls, all exposure calls, and exposure calls involving gasoline, carbon monoxide, food poisoning, and animal bites and stings. Although instances of contaminated water exposures may be expected to increase after hurricanes, preliminary analysis indicated that few such exposures are reported to Texas poison centers.
To further evaluate any perceived changes in the various call volumes during September 11 to 30, 2008, the mean daily call volume was calculated for the following 3 time periods: August 12 to September 10 (the 30 days immediately preceding the mandatory evacuations), September 11 to 13 (the 3 days during mandatory evacuation and hurricane landfall), and September 14 to 30 (the 17 days after hurricane landfall) and the means compared. Other investigations using poison center data outline a methodology for identifying whether the number of calls received by poison centers during a given time period differs from what would be expected.Reference Bronstein, Seroka and Wruk21–Reference Mrvos and Krenzelok25 In brief, the number of calls received during the time period of interest is compared with a baseline range derived from the number of calls received immediately preceding the time period of interest or in a corresponding time period during ≥1 previous year. For example, the time period September 14 to 30, 2008, could be compared with August 12 to September 10, 2008, or to September 14 to 30 during 2005, 2006, and 2007. Because Texas poison center call patterns were affected in September 2005 by Hurricane Katrina and Hurricane RitaReference Forrester16, Reference Jaramillo, Forrester and Winter19 and in September 2007 by Hurricane Humberto, no effort was made to compare call volumes during September 2008 with the same month in preceding years. Thus, a baseline range was calculated according to the following formula:
baseline range = (mean daily call volume during August 12 to September10, 2008) ± 3 standard deviations
If the mean daily call volume during September 11 to 13, 2008, or September 14 to 30, 2008, fell outside the baseline range, then the number of calls was considered to be higher or lower than expected. The Texas Department of State Health Services institutional review board considered this research exempt from review.
RESULTS
Figure 1 shows the total daily call volume during September 2008. For those counties that were declared disaster areas, the call volume declined during the evacuation and landfall period to the lowest level for the entire month then increased once more to preevacuation levels or higher afterward. No such temporary dip in call volume was clearly observed in the rest of Texas. A similar pattern was found with the daily volume of all exposure calls (Fig. 2).

FIGURE 1 Total calls received by the Texas Poison Center Network during Hurricane Ike, September 1–30, 2008.

FIGURE 2 Total exposure calls received by the Texas Poison Center Network during Hurricane Ike, September 1–30, 2008.
Figure 3 presents the daily call volume for gasoline exposures. Compared with the preevacuation period, the number of calls from the disaster area counties was higher during the evacuation and landfall period and even higher during the first days after landfall. By the end of September 2008, the daily gasoline exposure call volume was still higher than that at the start of the month. When the daily call volume for carbon monoxide exposures was examined (Fig. 4), the number of calls from disaster area counties increased greatly on the day after landfall (September 14, 2008) and remained at elevated levels for much of the rest of the month. Comparable patterns were not seen for calls from the rest of Texas. Of the 51 carbon monoxide exposures reported during September 11 to 30, 2008, 18 were managed on site; 32 were at, en route to, or referred to a health care facility; and for 1 the management site was unknown. None were known to have resulted in death.

FIGURE 3 Total gasoline exposure calls received by the Texas Poison Center Network during Hurricane Ike, September 1–30, 2008.

FIGURE 4 Total carbon monoxide exposure calls received by the Texas Poison Center Network during Hurricane Ike, September 1–30, 2008.
No obvious trend was observed in the daily number of food poisoning calls (Fig. 5). The daily call volume for bites and stings for the disaster area counties was generally higher on the date Hurricane Ike made landfall and succeeding days than in much of the earlier part of the month, a pattern not observed in the rest of Texas (Fig. 6).

FIGURE 5 Total food poisoning exposure calls received by the Texas Poison Center Network during Hurricane Ike, September 1–30, 2008.

FIGURE 6 Total bites and stings exposure calls received by the Texas Poison Center Network during Hurricane Ike, September 1–30, 2008.
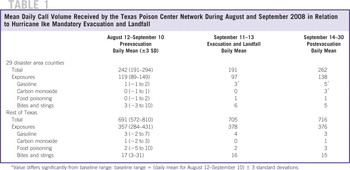
Table 1 compares the mean daily call volume during the preevacuation period to the latter 2 time periods. For those counties declared disaster areas, the total call volume and total exposure call volume during evacuation and landfall were lower than the preevacuation period. The elevations in mean daily call volume for gasoline exposures after evacuation and after hurricane landfall were statistically significant, as was the elevation in carbon monoxide exposures after hurricane landfall. The increase in animal bite and sting calls was not found to be statistically significant. No statistically significant changes in mean daily call volumes were observed for the rest of Texas.
TABLE 1 Mean Daily Call Volume Received by the Texas Poison Center Network During August and September 2008 in Relation to Hurricane Ike Mandatory Evacuation and Landfall
DISCUSSION
The pattern of calls received by Texas poison centers during September 2008 was affected by Hurricane Ike, particularly with respect to calls received from those counties later designated disaster areas. Both the total number of calls and all exposure calls received from the disaster area counties declined during the evacuation and day of hurricane landfall but increased back to a normal, or perhaps higher, volume in the days afterward. In contrast, the daily number of gasoline exposures increased during the evacuation and remained elevated after hurricane landfall. Reported carbon monoxide exposures likewise increased, but not until after hurricane landfall. Although animal bites and stings were more frequently reported after Hurricane Ike made landfall, the rise in call volume was not statistically significant, nor was there a substantial change in reported food poisonings. This call pattern was similar to that observed with Hurricane Rita.Reference Forrester16
The decline in total calls and all exposure calls during evacuation and hurricane landfall likely occurred because a large portion of the population would have left the area, leaving fewer people to have exposures that would result in poison center calls. In addition, if such exposures did occur, the individuals may not have contacted poison centers because they did not have telephone access. The poison center primarily responsible for the counties that were evacuated and declared disaster areas is the Southeast Texas Poison Center based in Galveston. Although this poison center was closed due to the mandatory evacuation and none of its staff could answer calls until September 20, 2008, the telecommunications system operated by the TPCN permitted the 5 other Texas poison centers to answer calls from the affected counties. Thus, the closure of the Southeast Texas Poison Center is not likely to account for the decline in calls.
The total call volume quickly returned to a normal, or possibly a slightly higher, level after the hurricane made landfall. This likely occurred because evacuees began to return home and many of the people in the affected areas started to clean up after the hurricane and attempt to restore their typical routines. In contrast, the Mississippi poison center reported that the number of calls received was lower than usual in the months after Hurricane Katrina in those areas experiencing severe damage.Reference Cox, Amundson and Brackin18
As in the present investigation, other poison center studies had found that gasoline exposures rose after hurricanes.Reference Cox, Amundson and Brackin18, Reference Schauben, Kay and Schulte20 People may run out of gasoline in their automobiles during evacuations, and in cases of power outages, people may have to use gasoline-powered generators. In both of these situations, people may have to resort to siphoning gasoline, thus resulting in potentially hazardous exposures.
The elevation in carbon monoxide exposures reported to Texas poison centers after hurricane landfall was consistent with media reports of dozens of individuals suffering from carbon monoxide poisoning seen at area hospitals in the days after Hurricane Ike landfall,26 and at least 5 deaths were attributed to carbon monoxide poisoning.27 The increase in carbon monoxide calls to poison centers after hurricanes has been documented previously,17, Reference Schauben, Kay and Schulte20 although the Mississippi poison center found no such increase after Hurricane Katrina.Reference Cox, Amundson and Brackin18 Many of these exposures occur as people resort to portable generators as a result of power outages in the wake of hurricanes.17 As a result, people in the affected areas were warned about the hazards of portable generators and how to avoid carbon monoxide poisoning. 26,28,29 Warnings about carbon monoxide dangers were published in newspapers and in press releases produced by the state health department. Moreover, regional health department staff distributed carbon monoxide poisoning prevention materials at ice and water distribution centers. Nevertheless, carbon monoxide exposures occurred. A more detailed study of carbon monoxide exposures in Texas reported to poison control centers and other facilities is being performed and will be reported elsewhere.
The potential increase in animal bites and stings reported to Texas poison centers is to be expected. The flooding and destruction resulting from a hurricane would drive animals from their natural habitat. In addition to people clearing debris, this means that people are more likely to come into contact with wild animals.
The lack of a clear increase in food poisoning calls after Hurricane Ike made landfall may be surprising because the lack of power that frequently follows hurricanes would be expected to lead to food spoilage. The Mississippi poison center likewise observed no obvious change in food poisoning calls after Hurricane Katrina.Reference Cox, Amundson and Brackin18 One potential explanation is that people may be unlikely to report food poisonings to poison centers.
That poison center call patterns for some exposures change whereas others do not in the aftermath of hurricanes has implications for the utility of poison center calls in surveillance. Poison centers are only useful as surveillance tools for particular exposures if those exposures are likely to be reported to the poison centers, such as carbon monoxide and gasoline exposures. If exposures are less likely to be reported to poison centers, such as may be the case with water contamination and food poisoning, then poison centers are of limited use in surveillance. As a consequence, those who consider using poison centers as a surveillance tool should make certain that the exposures they are interested in are frequently reported to poison centers.
This study is subject to several limitations. Hurricane Katrina and Hurricane Rita in 2005 and Hurricane Humberto in 2007 prevented any comparison between the Texas poison center call pattern right after Hurricane Ike made landfall to a “typical” call pattern during comparable time periods in previous years. Moreover, this investigation focused on those Texas counties that were declared disaster areas. All of the counties that underwent mandatory evacuation were not later declared disaster areas, and all of the counties declared disaster areas had not undergone mandatory evacuation. The majority of the population affected by the mandatory evacuation was also affected by the disaster area declaration, however. Furthermore, contacting Texas poison centers is in most instances not mandatory. Thus, any differences or changes in call patterns may reflect changes in the likelihood of people to call the poison centers and not actual changes in the underlying exposures.
Conclusions
In conclusion, during an evacuation in advance of hurricane landfall, total poison center call volume in the affected area may be expected to decline. Certain calls such as those involving gasoline exposures may increase, however. After a hurricane, the total call volume may quickly return to normal, but certain calls such as those involving carbon monoxide, gasoline, and bites and stings may increase. This information allows for poison centers and public health providers to prepare their response to hurricanes and to educate the population before such events.
Author's Disclosures
The author reports no conflicts of interest.
Acknowledgments
Funding for this research was provided by a contract with the Commission on State Emergency Communications in Texas.
The author thanks the staff of the 6 poison centers (Central Texas Poison Center, North Texas Poison Center, Texas Panhandle Poison Center, South Texas Poison Center, Southeast Texas Poison Center, West Texas Regional Poison Center) of the Texas Poison Center Network, who collected the data.


