


Disaster preparedness reduces the impact of disasters and shortens recovery times after significant events. Accordingly, the federal government has undertaken a long-term campaign to promote household and community preparedness.1 Within the preparedness literature, individuals who consistently yielded higher levels of predisaster preparedness included: older adults, those with higher levels of education, higher income, homeowners, those of specific religious affiliations, those with higher levels of social support, and military veterans.Reference Eisenman, Zhou and Ong2-Reference Nukpezah and Soujaa12 Conversely, individuals identified as least prepared within the literature included: racial/ethnic minorities, the medically fragile, the disabled, those with inadequate social support, the mental ill, those with low literacy levels, and those responsible for extended family members.Reference Eisenman, Zhou and Ong2,Reference Murphy, Cody and Frank3,Reference Edwards6,Reference Gargano, Caramanica and Sisco11,Reference Enarson and Walsh13-Reference Levac, Toal-Sullivan and O’Sullivan21 However, past studies showed inconsistent results on how gender, the presence of children, and prior disaster experience influenced levels of preparedness.Reference Boscarino, Adams and Figley22-Reference Baker29
Previous Disaster Experience and Preparedness in Studies
Gargano et al. (2015) found that increases in the level of exposure to the September 11th terrorist attack of 2001 increased the odds of being prepared for Hurricane Sandy in 2012.Reference Gargano, Caramanica and Sisco11 In a 300-person survey, Mulilis et al. (2003) found that individuals who had experienced past tornados were more likely to be prepared.Reference Mulilis, Duval and Rogers24 Similarly, McCormick et al. (2014) found increases in the presence of household disaster preparedness kits 9 to 11 months after the April 2011 Alabama tornado outbreaks.Reference McCormick and Pevear30 In focusing on adults 50 years and older, Killian et al. (2017) found that individuals who had helped or offered to help others during a disaster were more likely to have an emergency plan.Reference Killian, Moon and McNeill31 However, Chen et al. (2012) found that residents in Houston, Texas, had no significant changes in self-reported preparedness 1 y after Hurricane Ike.Reference Chen, Banerjee and Liu25 Howe (2018) assessed whether a disaster history over 30 years was associated with preparedness at the state level and core-based statistical area (CBSA) level.Reference Howe32 The study found no association between disaster history and preparedness at the state level and only weak correlation at the CBSA level.Reference Howe32 Finally, Levac et al. (2012) identified that how researchers framed the notion of preparedness created variability in preparedness findings. The study also noted that more research was needed to further understand the barriers to preparedness.Reference Levac, Toal-Sullivan and O’Sullivan21
Preparedness Measures in Studies
Preparedness within the academic literature varied in form. One form viewed preparedness as a cumulative/iterative process in which preparedness was measured as a count of supplies present within a household. This preparedness “score” was traditionally a nonweighted summed score of diverse preparedness supply elements.Reference Eisenman, Zhou and Ong2,Reference Murphy, Cody and Frank3,Reference Edwards6,Reference Smith and Notaro16 More specifically, supply elements were defined as: the presence of food, a 3-d supply of water, first aid kit, battery-operated radio, needed medications, and evacuation plans.Reference Gargano, Caramanica and Sisco11
Other studies constructed preparedness using either self-reported preparedness levels or score thresholds reached within multi-scale indices.Reference Gargano, Caramanica and Sisco11,Reference Levac, Toal-Sullivan and O’Sullivan21,Reference Howe32 In assessing preparedness to Hurricane Sandy, Gargano et al. (2015) defined preparedness as having at least 7 items within an 8-item checklist.Reference Gargano, Caramanica and Sisco11 When evaluating geographic variations, Howe (2018) asked respondents to self-report whether or not they had supplies available specifically for use during disasters.Reference Howe32 While multi-item scores and thresholds helped to operationalize preparedness as an iterative process, these constructs of preparedness still only relied on unweighted summed scores.
A nonweighted summed score of preparedness could be problematic as not all preparedness items are equally important. For instance, the lack of a flashlight would be less detrimental to a household’s resiliency efforts than the lack of food or access to a vehicle. The view of nonweighted preparedness would become particularly challenging if households were under an official notification to shelter-in-place or evacuate during a disaster. This study sought to assess whether exposure to a disaster within recent memory impacted household preparedness. The study also aimed to elucidate how the relationships between prior disaster exposure and preparedness changed across different operationalizations of preparedness. Lastly, this study explored whether the impact of historical disaster exposure on preparedness varied by race/ethnicity and disability status.
METHODS
Household Preparedness Data
A large housing survey dataset was used to assess disaster preparedness at the household level. The US Department of Housing and Urban Development provided financial support for the biennial collection of the American Housing Survey (AHS) by the US Census Bureau (Census). The survey included information on occupied and vacant housing units, mobile homes, and assisted living facilities. The Census surveyed household members at least 16 years of age. For vacant properties, survey respondents included individuals like neighbors or landlords who could provide information on the property. The AHS consisted of core unchanged survey questions to assess the country’s housing stock, mortgages, and demographic characteristics at the national and metropolitan levels. The AHS also incorporated rotating topical questionnaires such as food insecurity and public transportation-related supplements.
In 2013, the AHS included a topical questionnaire on disaster preparedness.Footnote a The Census collected the 2013 AHS Metropolitan Sample between May and September 2013. The sample survey included 3500 to 5000 housing units for 25 metropolitan statistical areas (MSAs) as defined by the Office of Management and Budget. The AHS, however, included the 5 largest MSAsFootnote b within the national sample, while leaving the remaining 20 MSAs in the metropolitan survey. To implement the disaster planning topical module, the AHS randomly split the metropolitan survey, with half of the survey respondents receiving the disaster planning questionnaire. In addition to the split-sample format, the Census created a sample weight to accompany the disaster planning module.Footnote c This study assessed household preparedness within the 20 MSAs located in the 2013 AHS metropolitan survey.
Regional Disaster Exposure Data
Data on financial assistance provided by the federal government after large scale disasters were used to assess disaster exposure. Through the Robert T. Stafford Disaster Relief and Emergency Assistance Act, the federal government distributed disaster assistance to individuals after a federally declared disaster. The mechanisms of aid distribution occurred by means of the Federal Emergency Management Agency (FEMA) and the Small Business Administration (SBA). FEMA provided household assistance in the form of individual assistance grants. FEMA based grant eligibility on damage densities within communities, emergency and trauma needs, the presence of vulnerable populations, and the mandate not to duplicate insurance coverage, among other factors.33 The SBA also provided direct financial assistance to households in times of disasters through low-interest long-term loans.34 Physical disaster loans were available to homeowners and renters to assist in the recovery of uninsured or underinsured disaster-damaged properties. FEMA provided a database of households which received either SBA loans or FEMA individual assistance grants aggregated to the county level by year and federal disaster declaration. The study sample was restricted to federally declared disasters that occurred between 2008 and 2012 for counties overlapping with the 2013 AHS MSA boundaries.
Preparedness Measures
Three separate measures of preparedness were created from the 2013 AHS disaster preparedness topical module: cumulative preparedness, adequate preparedness, and minimal preparedness (Table 1). Cumulative preparedness was the sum of disaster preparedness elements present in each household. Standardized Cronbach’s alpha was calculated to estimate the internal reliability of the additive, unweighted cumulative preparedness construct. Adequate preparedness was coded as 1 if a household had at least 5 of the 8 preparedness elements; otherwise, adequate preparedness was coded 0.Footnote d The last measure was a newly created binary measure of minimal preparedness. Households that had a 72-h supply of food and water, funds to evacuate, and a vehicle to do so were coded as 1; those without a minimum of these 4 items were coded as 0. Minimal preparedness measured the capacity of households to shelter-in-place for 3 d or to immediately evacuate.
TABLE 1 2013 AHS Disaster Preparedness Supply Elements
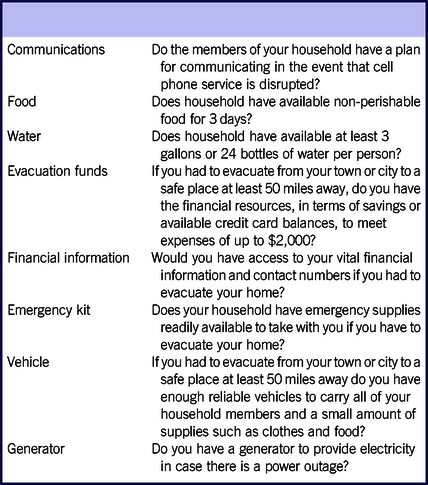
All variables were dichotomous with 1 = present in household and 0 = not present in household. Source: U.S. Census Bureau and U.S. Department of Housing and Urban Development, 2013 American Housing Survey.
Historical Disaster Exposure Measure
A binary measure of historical disaster exposure was created. The variable identified whether counties within the AHS MSA boundaries received disaster assistance either through FEMA or SBA within recent memory.Footnote e A recent memory disaster event was defined as an event occurring within 5 years before the implementation of the 2013 AHS housing survey. For households that resided in MSAs where at least 1 county in the MSA received disaster assistance between 2008 and 2012, historical disaster exposures were coded as 1. For a household that resided in an MSA that had no county receive disaster assistance between 2008 and 2012, a code 0 was used.
Control Variables
Various factors influencing preparedness were controlled for in the study. Household race/ethnicity measures included African-American, Latino, non-Hispanic Whites, and Other. The binary educational attainment variable measured whether or not a person within the household had a bachelor’s degree or higher. Similarly, houses with the presence of at least 1 person at or above 65 years of age were classified as 1 within an elderly variable. Households without a person at or above the age of 65 were coded as 0 for the elderly variable. The 2013 AHS presented both income and the number of children within the household as continuous/count data. The original children variable was maintained for the analysis, while income was logarithmically transformed to achieve some normality. Lastly, the 2013 AHS presented disability status, marital status, and citizenship as binary measures. The study retained the previous variable types as such in the models.
Statistical Analysis
Descriptive statistics around cumulative, adequate, and minimal preparedness were calculated. Pearson correlation between cumulative preparedness scores and historical disaster exposures within a 5-year window was calculated. A Gamma correlation test was used to measure the association between historical disaster exposure and that of adequate and minimal preparedness. The study used a survey-weighted linear regression analysis to analyze the relationship between cumulative preparedness and historical disaster exposure. Given the binary nature of the second and third preparedness models, survey-weighted logistic regressions were used to examine how adequate and minimal preparedness varied with historical disaster exposures. Tests for the interaction between race/ethnicity (Latino and African-American households) and historical disaster exposure on the 3 preparedness models were also performed. All statistical analyses were performed using STATA 10.0. Statistical significance was set at a P-value ≤ 0.05 level.
RESULTS
The mean cumulative preparedness score was 5.37 (SD = 1.90; n = 16,068), with 66.98% (n = 10,763) of households reporting being adequately prepared and 41.06% (n = 6598) reporting being minimally prepared. There were statistically significant positive associations between higher preparedness scores and households located in areas which experienced disasters in recent memory (r = 0.064; P-value < 0.05).When testing measures of association between the 2 dichotomous preparedness measures and historical disaster exposures, both pairs exhibited concordant associations (adequate preparedness gamma =0.14; minimal preparedness gamma = 0.16) with statistically significant asymptotic P-values.
Cumulative Preparedness
Households located in communities that experienced disasters within recent memory had a 0.55 higher expected cumulative preparedness score (P-value < 0.01) than households in areas without recent experiences of disasters, holding all else constant (Table 2). Households most vulnerable (i.e., lower cumulative preparedness scores) included Asian households and households where children or the disabled were present. More resilient households included households with US citizens, the married, higher income, and the elderly present. In addition, there were no statistically significant differences between how African-American households’ recent disaster experience related to cumulative preparedness scores relative to white households (Table 2). The lack of statistically significant interactions between race and disaster experiences on cumulative preparedness scores also extended to Latino headed households. Similarly, there were no statistically significant interactions between disability status and experiencing historical disasters as it related to cumulative preparedness.
TABLE 2 Linear Regression of Cumulative Preparedness

Abbreviation: SE, standard error.
* P-value < 0.05.
a Elderly, binary variable: household with the presence of at least 1 person at or above 65 years of age = 1; households without a person at or above the age of 65 = 0.
Adequate Preparedness
Adequate preparedness measured whether or not households had at least 5 of the 8 preparedness indicators. The odds of a household within a community that had experienced a disaster within recent memory being prepared was 1.66 times as high as a comparable household not situated in a community with a recent disaster memory (P-value < 0.01) (Table 3). Households that lacked relative adequate preparedness included those with children and the disabled present. Households with higher odds of relative adequate preparedness included those with US citizens, the married, those with higher income, and the elderly present. There were no statistically significant interactions between race and experiencing disasters within recent memory on being adequately prepared (Table 4). In addition, there were no significant differences between past disaster impacts and disability status on adequate preparedness.
TABLE 3 Logistic Regressions of Adequate and Minimal Preparedness

Abbreviation: SE, standard error.
* P-value < 0.05.
a Elderly, binary variable: household with the presence of at least 1 person at or above 65 years of age = 1; households without a person at or above the age of 65 = 0. In assessing race/ethnicity, non-Hispanic Whites served as the reference group.
TABLE 4 Logistic Regressions of Adequate and Minimal Preparedness with Interaction Terms

Abbreviation: SE, standard error. The models controlled for education, citizenship status, marriage, children, income, and age. In assessing race/ethnicity, non-Hispanic Whites served as the reference group.
* P-value < 0.05.
Minimal Preparedness
Minimal preparedness measured whether a household had 4 crucial elements—food, water, access to a vehicle, and evacuation funds. The odds of a household within a disaster-exposed community being minimally prepared was 1.72 times as high as a comparable household not situated in a community with a recent disaster history (P-value < 0.01) (Table 3). Households less likely to be minimally prepared included those with children, the disabled, and African-American households. African-American households had a 76.2% as high odds of being minimally prepared relative to comparable White households (P-value < 0.01) (Table 3). Conversely, households with a higher likelihood of being minimally prepared included households with US citizens, the married, higher income, and the elderly present. The influence of past disasters on minimal preparedness did not vary by race or disability status (Table 4).
DISCUSSION
Disasters have negative impacts on households in the form of injury, lives lost, and economic/community displacement. However, preparedness efforts mitigate the consequences associated with catastrophic events and facilitate shorter recovery times after the event. In better understanding preparedness and its various operational forms, this study assessed whether prior disaster exposure influenced different levels of preparedness. The study identified 3 forms of preparedness: cumulative, adequate, and minimal preparedness. Cumulative preparedness was a nonweighted summed index of the presence of 8 household elements traditionally associated with preparedness. Adequate preparedness was a binary measure of whether or not households had 5 or more of the household elements in any order. Minimal preparedness measured whether or not households had 4 required elements, specifically food, water, vehicle, and evacuation funds, to shelter-in-place or evacuate.
Across 3 operationalized measures of preparedness, prior disaster exposures were statistically significant predictors of being prepared. The findings of this study were similar to Onuma et al. (2017), which found increased household preparedness associated with disaster experience in Japan. Households which experienced damages during the 2011 Great East Japan Earthquake were more likely to have emergency supplies for basic preparedness 2 years later.Reference Onuma, Shin and Managi35 In addition, the presence of children and the disabled consistently represented sources of vulnerabilities across all 3 measures of preparedness. Race, however, played a different role depending on the definition preparedness, with African-American households less likely to have the ability to shelter-in-place or evacuate.
LIMITATIONS AND CONCLUSIONS
This study had several limitations. The study relied on the 2013 AHS topical questionnaire, which did not assess household access to preparedness information, a factor that may have influenced one’s preparedness outcome. Measures of disaster exposure were based within urban areas, with the unit of analysis being MSAs. Impacts of disaster exposures on preparedness may have differed within rural households. In addition, the study defined disaster exposure based on federal disaster declarations. There may have been localized disasters, such as small-scale floods, which impacted communities but did not rise to the level of requested federal intervention. In addition, the study did not differentiate between types of disasters such as large forest fires or major hurricanes. Despite these limitations, this study defined different measures of preparedness and elucidated variations in vulnerability. Households situated in communities that experienced disasters within a 5-year time window were more likely to be prepared across different definitions of preparedness. Race did not play a statistically significant vulnerability factor under a traditional cumulative or binary measure of preparedness. However, when preparedness was narrowly defined as the capacity to follow an emergency policy directive of sheltering-in-place or evacuating, African-American households were at a statistically significant disadvantage.
The implications of these findings are important given the pattern of disasters within recent memory. Hurricane Harvey produced the largest amount of rainfall in Texas history, with many residents unable to leave their homes for days due to severe flooding.36,Reference Murphy37 Texas state and local officials issued conflicting guidance on evacuation, further exacerbating the dire situation during the storm.36 Hurricane Irma impacted 6.3 million Florida residents and triggered one of the largest mandatory evacuations in US history.38 As disasters become more frequent and costly, officials issuing policy directives must have a clear understanding of what it means to be prepared in the face of a changing disaster landscape. Most importantly, policy directives aimed at saving lives, reducing costs, and furthering resiliency must reflect the true capacity of communities to benefit rather than face additional burdens from such policies.
Acknowledgements
The author wishes to thank the Bill Anderson Fund which seeks to promote historically underrepresented scholars within the field of disaster research. Special thanks must also be given to Ms. Elizabeth Parker, Ms. Helen Etya’ale, Mr. Jonathan Malmin, Dr. Linda Baffo and LCDR Candis Hunter for their thorough review and insight in the manuscript.


