


Over the past decade, disasters including Hurricane Katrina, Cyclone Nargis, and Typhoon Haiyan have gripped national and global consciousness. Despite improvements in forecasting, planning, and response, such storms remain extremely deadly. Atlantic hurricanes and their meteorological equivalents in other ocean basins, cyclones and typhoons, killed at least 170,053 individuals worldwide from 2003 to 2012, many of them in the developing world. 1
Although our understanding of the dynamics that govern health outcomes during such disasters remains incomplete, the 2002 Guidelines for Evaluation and Research set forth by the World Association for Disaster and Emergency Medicine (WADEM) postulated a relevant conceptual model of relationships among determinants of disaster outcomes. 2 , Reference Debacker, Hubloue and Dhondt 3 In this model, absorbing capacity is defined as the ability to withstand a disaster without sustaining extensive damage and is one of the many factors that determine overall societal vulnerability to disasters. Absorbing capacity may be increased by activities such as disaster planning, improving building codes, stockpiling of equipment, and training of responders. Because absorbing capacity requires a surplus of available goods and services, it is especially sensitive to local economic conditions. It is thus plausible that poverty could contribute to reduced absorbing capacity and a commensurate increase in vulnerability during disaster events.
While existing studies do not directly address hurricane disaster outcome determinants within the WADEM framework, they do suggest that there is cause for concern. An association between poverty and risk of death during disasters has been observed,Reference Kahn 4 and poverty has been found to be one of several determinants of risk of death in Latin American climate disasters.Reference Rubin and Rossing 5 A parish-level analysis of fatalities during Hurricane Katrina also associated poverty with increased risk of death.Reference Price 6
Although these reports linking poverty with worse outcomes from natural disasters are concerning, there is reason to believe that the situation will worsen with time. Strong scientific consensus holds that future anthropogenic climate change will lead to a higher proportion of powerful hurricanes without changing overall hurricane frequency. 7 Retrospective analyses of storm surgeReference Grinsted, Moore and Jevrejeva 8 and wind speedReference Holland and Bruyere 9 data indicate that this trend is already present; more intense hurricanes are already becoming more common. Many nations commonly impacted by hurricanes are in the developing world.
Therefore, this study sought to examine the degree to which hurricane wind speed and national economic conditions were associated with mortality. More specifically, we investigated the variable association of storm amplitude with mortality by economic status. In contrast to low-amplitude storms, we postulated that the mortality impact of high-amplitude storms would vary greatly across level of economic development. Although previous studies have documented a relationship between poverty and worse disaster outcomes, no specific study to date has examined the interaction of hurricane amplitude and economic conditions as we proposed. An additional goal was to demonstrate the feasibility of conducting quantitative analyses using currently collected and publicly available data to provide data-driven information for policy-makers.
METHODS
Study Design
A database of hurricane events and associated meteorological, socioeconomic, and mortality data was assembled from publicly available records and analyzed via multivariable modeling to evaluate the relations between per capita gross domestic product (GDP), wind speed (as an indicator of storm amplitude), and mortality rate.
The data set included all hurricanes from 1958 to 2010 that occurred in the North Atlantic basin and achieved at least category 4 on the Saffir-Simpson scale, a commonly used metric based on hurricane wind speed. 10 The data set included storm systems achieving category 4 at some point in their development and then tracked them throughout their development and dissipation, producing a sample of storms in each amplitude category.
Assessment of typical hurricane effect areas in comparison to land surface areas for nations of various sizes was performed prior to assembling the data set. Nations and territories in the Caribbean and Central America of less than 50,000 square kilometers surface area for which United Nations and World Bank socioeconomic data were available were included. Larger nations such as Cuba and most Central American countries were excluded because their large land area relative to the size of typical Atlantic hurricanes led to uneven population exposure to hurricane hazards during any given storm event. 10 , 11
Passage of a hurricane that met the study criteria within 200 km of a nation’s reference location constituted a hurricane event. Reference locations (Table 1) in each nation were selected from the geographic database of the National Oceanic and Atmospheric Administration (NOAA) Coastal Services Center Historical Hurricane Tracks mapping tool on the basis of central location and population concentration. By use of this methodology, a hurricane passing near a series of nations generated several discrete events in the database, each with its own associated data. Individual nations often experienced multiple events during the 52-year study time frame. The wind speed of a particular event was conservatively assessed as the lower bound of the highest Saffir-Simpson category while the storm was within the radius of interest. For example, if the highest Saffir-Simpson category while a storm was within 200 km of a given country was 3 (defined as a storm with sustained wind speeds 178–208 km/h), the wind speed would be taken to be 178 km/h. 10 Data on population in the year of the event, per capita GDP in the year of the event adjusted to year 2000 US dollars, and total fatalities were associated with each event. This study was considered exempt by the University of Massachusetts Medical School IRB.
Table 1 Summary of Nation and Storm Characteristics, September 1958 Through September 2010

a Selected from the geographic place-name dataset in the Historical Hurricane Tracks mapping tool produced by the National Oceanic and Atmospheric Administration Coastal Services Center, available at http://csc.noaa.gov/hurricanes/#.
b Per capita gross domestic product (GDP) was presented in adjusted year 2000 US dollars. Year-specific per-capita GDP was utilized in actual data analysis.
c Based on lower bound of wind speed (km/h) from Saffir-Simpson classification system.
d Death rates are unadjusted, per 100,000 population.
Data Sources
All data on fatalities were obtained from National Weather Bureau, National Weather Service, and NOAA National Hurricane Center Hurricane Reports and Annual Summaries for the years 1958 to 2011. 12 Information on specific mechanism of death was not uniformly available. All per capita GDP and population data were obtained from “The World Bank: GDP per capita (constant 2000 US$)” and “The World Bank: Population, total” data sets, which were accessed remotely via the World Bank website between September 2012 and February 2013. 13 , 14 Per capita GDP values for events in Haiti prior to 1974 were unavailable; 4 data points in this range were assigned values equal to the Haiti 1974 per capita GDP in year 2000 US dollars. Geospatial and meteorological data on each storm’s position and Saffir-Simpson rating were obtained from the Coastal Services Center of the NOAA by using the Historical Hurricane Tracks mapping tool, accessed remotely between September 2012 and February 2013. 11 Hurricane category (Saffir-Simpson rating), rather than exact wind speed, was used because historical records of geographically linked exact wind speeds were not available for all hurricanes in the database. Reliable historical records relating storm conditions, population density, and detailed topography across the entire nation data set were unavailable and therefore analysis of these factors was not attempted.
Statistical Analysis
The outcome of mortality rate was defined as the number of deaths per 100,000 population at risk. The main exposures for this analysis were wind speed and per capita GDP. Islands were classified into tertiles on the basis of their per capita GDP. Storm amplitude was classified as follows: lowest, ≤ Saffir-Simpson category 1; mid-level, Saffir-Simpson category 2, 3; highest, Saffir-Simpson category 4, 5. These classification approaches allowed possible nonlinear associations with each exposure and the outcome.
Bivariate comparisons separately examined mortality rate across category of per capita GDP and category of storm amplitude, with statistical significance derived from a nonparametric trend test.Reference Cuzick 15 Appropriate statistical methodology was used to model the complex relationships captured in the data. First, the data set spanned multiple years, with a single storm affecting more than one island and a single island being affected by more than one storm. In addition, the main outcome of death was represented by a count variable with a variance exceeding that expected for a Poisson distribution. We accounted for population exposure, which varied from island to island, so that models reflected death rates rather than simple counts. Therefore, multivariable modeling of mortality rates was accomplished with generalized estimating equations, taking a negative binomial family to account for observed over-dispersion, a logametric link, and an exchangeable correlation matrix to account for correlation from repeated storm events striking the same islands over time. A logametric offset accounted for variable population exposure. Selection of model covariates was guided by the quasi-likelihood under independence criterion (QIC), an adaption of the Akaike Information Criterion developed by Pan and implemented in Stata by Cui.Reference Pan 16 , Reference Cui 17 The final model included these covariates: indicator variables for category of GDP, category of storm amplitude, the interaction of GDP and storm amplitude, and storm decade. An array of regression diagnostics evaluated model quality.
Predicted mortality rates per 100,000 exposed population were calculated for the lowest, mid-level, and highest categories of storm amplitude and GDP on the basis of a multivariable model parameterized as above. For the predicted mortality rates, standard errors and confidence intervals were approximated by the “delta method,” which relies on Taylor linearization.Reference Xu and Long 18 All analyses were conducted with Stata 13.1 (StataCorp, College Station, TX).
RESULTS
The study included 149 storm events that involved 16 nations from September 1960 to September 2011 (Table 1). Each nation experienced an average of 11 storms, with a range of from 1 to 15. The mean storm wind speed was 136.3 kilometers per hour (SD: 72.1), ranging from 32 to 252. The mean fatality count per event was 67.2 (SD: 445.2), with a range of from 0 to 5000. The mean mortality rate (deaths per 100,000 population) was 4.58 (SD: 26.5), with a range of from 0 to 288.
The relationships of death rate with per capita GDP and with wind speed are graphically presented in Figure 1 and Figure 2, respectively. These figures reveal a nonlinear association of decreasing per capita GDP and increasing wind speed with greater mortality. As presented in Table 2, bivariate analysis revealed decreasing mortality rates across increasing category of per capita GDP (nonparametric trend test P<0.019) and increasing mortality rates across increasing category of storm amplitude (nonparametric trend test P<0.001). Based on the multivariable model (which accounted for population exposure, sequence of storm events, exposure of multiple islands to the same storm, and year of storm) the association of storm amplitude and mortality varied substantially by GDP tertile (Table 3). For islands with the lowest tertile of GDP, expected mortality rates varied from 0.15 (95% CI: 0.06–0.24) to 25.93 (95% CI: 13.30–38.55), moving from lowest to highest storm amplitude category. In contrast, for islands with the highest tertile of GDP, expected mortality rates remained below 1.2 regardless of storm amplitude. There was no significant difference in mean storm amplitude across categories of per capita GDP. Re-modeling following removal of 13 outlier events identified via the Cook’s distance test did not substantively change the main results of the study.
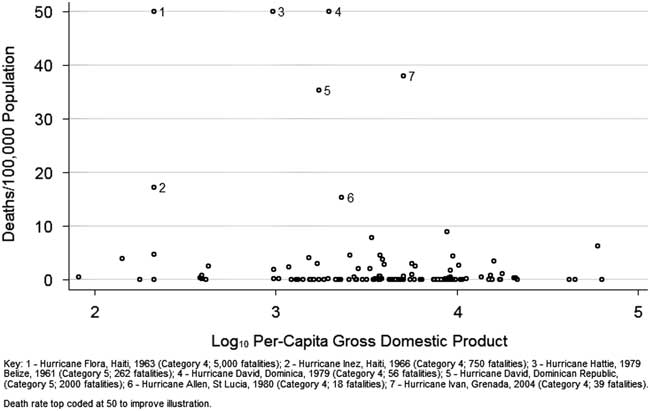
Figure 1 Death Rate by Per Capita Gross Domestic Product, 1958–2011.
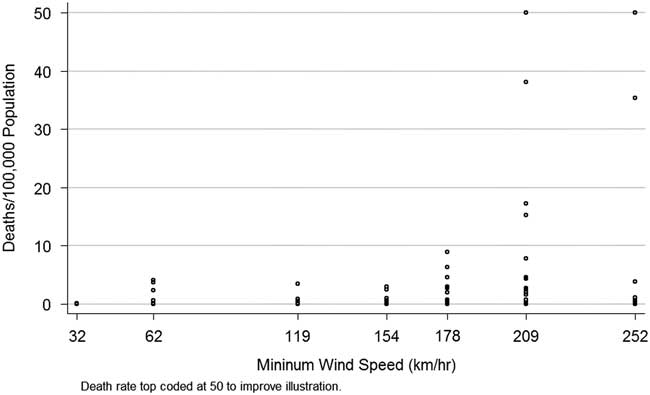
Figure 2 Death Rate by Wind Speed Category, 1958–2011.
Table 2 Unadjusted Death Rates Across Category of Storm Amplitude and Per Capita Gross Domestic Product (GDP)Footnote a

a Death rates are per 100,000 population. GDP levels represent tertiles. Storm amplitude was classified as follows: lowest, ≤ Saffir-Simpson Category 1; mid-level, Saffir-Simpson Category 2,3; highest, Saffir-Simpson Category 4,5. Per capita GDP was presented in 2000 US dollars. Death rate is unadjusted, per 100,000 population.
b Nonparametric P-value for trend =0.019.
c Nonparametric P-value for trend <0.001.
Table 3 Adjusted Storm Fatality Rates and 95% Confidence Intervals by Category of Storm Amplitude and Per Capita Gross Domestic Product (GDP)Footnote a

a Abbreviation: CI, confidence interval. Predicted mortality rates were based on a negative binomial model accounting for clustering of storm events within island, adjusting for category of GDP, category storm amplitude, the interaction of GDP category and storm amplitude, and year of storm; 95% CIs were calculated from linearized Taylor variance estimates. GDP levels represent tertiles. Storm amplitude was classified as follows: lowest, ≤Saffir-Simpson Category 1; mid-level, Saffir-Simpson Category 2,3; highest, Saffir-Simpson Category 4,5. Per capita GDP was presented in 2000 US dollars.
DISCUSSION
In this study of 149 storm events impacting 16 islands over a 52-year period, we identified concerning mortality patterns related to storm amplitude and economic status. Low-amplitude storms caused little mortality, regardless of economic status. However, the impact of high-amplitude storms varied more than 80-fold with economic status. According to our model, the brunt of hurricane mortality is borne by poor islands that are subjected to high-amplitude storms. Thus, we demonstrated a strong connection between economic well-being and the human impact of hurricanes. Although we did not analyze specific microeconomic elements, our findings are consistent with the WADEM conceptual model in which the human-influenced determinants of disaster outcome, such as absorbing capacity, are substantially affected by economic prosperity.
These results are extremely concerning given our current understanding of future hurricane activity. According to the Intergovernmental Panel on Climate Change, in coming decades “average tropical cyclone maximum wind speed is likely to increase” while the total number of storms remains constant. 7 Taken in conjunction with our modeling results, the Panel’s findings raise concern that hurricane fatalities may increase in coming decades because of higher-amplitude storms and that a disproportionate amount of the increased mortality may be borne by developing nations.
Although we did not examine the potential intermediate links between economic prosperity and disaster preparedness, our findings have important implications for resource-poor settings that are frequently exposed to high-amplitude hurricanes. While this study demonstrates associations rather than causative relationships, prudent policy decisions must recognize the intuitively reasonable possibility that the postulated factors are in fact causative. As resources will continue to be limited in the low per capita GDP settings that are most at risk, national, international, and nonprofit efforts to reduce the impact of hurricanes must focus on creative and parsimonious solutions to disaster preparedness.
Well-run disaster management efforts in low-income settings have enormous potential to affect outcomes, as evidenced by the Indian experience during Cyclone Phailin, in which large-scale evacuation and sheltering efforts led to a death toll that was a fraction of that sustained during Cyclone Orissa, a similar storm that struck the same region a decade earlier.Reference Thomalla and Schmuck 19 As demonstrated by this and other experiences, simple interventions such as improved sheltering facilities can have an enormous effect.Reference Bern, Sniezek and Mathbor 20 Deployment of resources toward such activities, especially in the pre-event phase, and effective coordination of national and international response efforts may be more prevalent in resource-rich nations, providing an additional possible mechanism for the observed disparity in mortality rates between poor and wealthy nations. Given the potential for successes such as that seen in the evacuation of Orissa and the likelihood that future gains in per capita GDP will be offset by increasingly intense hurricanes as the result of a changing climate, our findings suggest the need for increased effort to develop creative approaches that can be applied in resource-limited settings.
It should be noted that hurricane events also have a notable effect on economic functioning.Reference Bern, Sniezek and Mathbor 20 It is probable that causality flows in multiple directions, with devastating events disrupting economic growth and leading to societal stagnation,Reference Xiao and Nilawar 21 even as lower levels of economic prosperity simultaneously predispose toward increased fatality rates. Nonetheless, even if there is partial “reverse causality,” our findings warrant serious consideration and suggest that the strategic deployment of preparedness resources and changes in international policy will be required to prevent widening disparities from storm-related deaths in the context of future climate change.
Limitations
Important limitations of this investigation warrant discussion. First, mortality reports may be inaccurate or incomplete, especially in low-resource settings. However, the possibility of underreporting suggests that the effect of poverty observed in this study might have been understated. Second, terrain, population distribution, and population size relative to disaster effect area can make assessment of population hazard exposure extremely complex; historical records regarding population distribution and exposure were not uniformly available. As a result, study nations were limited to those of less than 50,000 km2 land surface area, ensuring that the bulk of a nation’s population was exposed to any hurricane passing within a 200-km radius of the predefined reference location. Utilization of predefined inclusion criteria minimized selection bias.
Third, the 200-km radius was based on NOAA descriptions of hurricane effect profiles 10 and represents a compromise between the goals of sensitivity and specificity. An increase in radius would increase sensitivity and include many storms that posed no threat, whereas decreasing the radius would increase specificity but exclude some storms that caused damage. While the retrospective storm data utilized in this study did not permit detailed spatial analysis, future studies focusing on hurricanes that have been the subject of modern meteorological observation in regions with accurate census records may be able to conduct finer-scale analysis of the dynamics observed in this study.
Fourth, while widely used, per capita GDP does not capture income distribution, infrastructure, institutions, or cost of goods and services. More specific indicators such as inequality index, poverty gap, and poverty index were unavailable for many events in this study. Likewise, we were not able to characterize the specific infrastructure and available resources for disaster response.
Some historical data were unavailable. St Maarten, St Croix, St Thomas, and St John were not included in this study owing to territorial status. Per capita GDP values in Haiti prior to 1974 were unavailable, and 4 data points were assigned the 1974 value. However, given Haiti’s extremely low per capita GDP, even several-fold underestimation of these values would not substantially affect the results.
CONCLUSION
Higher GDP was associated with lower mortality rates, whereas increased wind speed was associated with increased mortality rates. Most fatalities in our data set occurred when powerful storms struck resource-poor nations. This study demonstrates that quantitative and policy-relevant studies of disaster dynamics can be conducted using currently available and publicly reported data. Considered in the context of climate change, our results suggest that policy efforts should promote creative, cost-effective disaster planning initiatives and economic development in poor nations that are exposed to excessive risk from hurricanes.


