Community preparedness, which is a community’s ability to prepare for, manage, and recover from public health emergencies, is one of the public health preparedness capabilities for state and local health departments identified by the Centers for Disease Control and Prevention.1 Individual household readiness for a public health emergency or disaster is an important component of community preparedness, as how the general public responds to an emergency could greatly impact disaster outcomes such as mortality and morbidity.
Various theoretical frameworks have been applied to describe behavior change related to disaster and emergency preparedness.Reference Ejeta, Ardalan and Paton2 Two of these models, the theory of planned behavior and the extended parallel process model, describe the role of an individual’s perceived ability to respond in an emergency in engagement with preparedness behaviors.Reference Najafi, Ardalan and Akbarisari3-Reference Witte5 By improving self-efficacy, individuals may be more likely to engage in behaviors that make them more prepared to effectively respond to an emergency.
One technique that can be used to assess perceived preparedness and self-reported preparedness behaviors is the Community Assessment for Public Health Emergency Response (CASPER). CASPER employs established epidemiologic methods to rapidly assess household-level information about health status and needs using a questionnaire delivered in person.6, 7 Originally intended to support community assessment needs following a disaster in fulfilling the community recovery capability at the state and local level, CASPER has also been used in many non-disaster settings.1, Reference Schnall, Nakata and Talbert8 Between fiscal years 2012 and 2016, 99 CASPERs were conducted in the United States, of which 53 were related to preparedness.Reference Schnall, Nakata and Talbert8
Preparedness CASPERs can provide weighted estimates of the proportion of the community engaged with behaviors related to preparedness, such as having emergency contact information, evacuation plans, and family meeting points, as well as supplies of water, nonperishable food, and medication. These surveys can also assess intent to perform certain behaviors during an emergency. Finally, valuable data can be collected about a community’s concerns related to disasters and emergencies, as well as perceived readiness to cope with an emergency on a household level.
We report on an analysis of data collected through a preparedness CASPER conducted in Fairfax Health District, Virginia, in 2016, to describe self-reported preparedness behaviors in a community and to explore the relationship between perceived preparedness and preparedness behaviors.
METHODS
Data were collected from June 4 to 16, 2016, from households in Fairfax Health District, which includes Fairfax County, Fairfax City, and Falls Church City, using a 2-stage sampling methodology.Reference Kiernan, Barbiere and Habourn9 Of 315 households identified to produce a representative sample, 253 yielded completed interviews. The survey questionnaire, designed to be used in the CASPER, asked 50 questions of respondents and reflected a similar structure to other preparedness CASPERs. Weighted data allowed for population estimates to be calculated using the information collected from the completed interviews.Reference Kiernan, Barbiere and Habourn9
The de-identified data set was used for analysis. Descriptive statistics were calculated to describe the distribution of self-reported preparedness behaviors. The preparedness behaviors included in the analysis were related to emergency plans (having an emergency communications plan, having a designated meeting place in the neighborhood, having a designated meeting place outside of the neighborhood, aware of child’s school emergency plan among households with children, having practiced emergency plans with the household, having multiple routes away from home in case of evacuation, intent to evacuate if a mandatory evacuation was ordered), training (household member having taken cardiopulmonary resuscitation training within the past 5 years), and supplies (having an emergency supply kit at home, having emergency supplies in their vehicle, having a portable emergency kit, having emergency supplies for pets for households with pets, having a 3-day supply of drinking water, having a 3-day supply of nonperishable food, having a 7-day supply of medication for people taking prescription medication, having copies of important documents in a safe location). Pearson’s chi-squared test was used to evaluate statistically significant differences between the groups at the P = 0.05 level. Weighted estimates and 95% CIs were calculated. Logistic models were used to examine the relationship between demographic criteria and household perceived preparedness on several preparedness behaviors. Data were analyzed using Stata/IC 15 (College Station, TX). The proposal to further analyze the existing dataset was reviewed by the Institutional Review Board Office of the Johns Hopkins Bloomberg School of Public Health and was determined to not qualify as human subjects research.
RESULTS
Demographics of the CASPER respondents are reported in Table 1. Demographics by race and ethnicity (Hispanic/Latino) were similar to U.S. Census estimates for Fairfax County in 2016; however, the proportion of CASPER respondents who reported that the highest level of education completed by a member of their household was a master’s or professional degree was higher than reported in the U.S. Census.
TABLE 1 CASPER Respondent Demographics Compared to 2016 US Census Demographics for Fairfax Health District, Virginia

a 2016 American Community Survey estimates.
b Population 25 years and over (2016 American Community Survey estimates).
c 29.2% graduate or professional degree.
Household Perceived Preparedness
Overall, an estimated 7.4% of respondents (95% CI: 4.3–12.3) reported that their household was “completely prepared” to handle a large-scale disaster or emergency, 37.3% (95% CI: 31.4–43.7) were “moderately prepared,” 38.2% (95% CI: 31.6–45.2) were “somewhat prepared,” and 14.4% (95% CI: 10.2–20.0) were “unprepared.” Differences by demographic group were observed by whether there was a non-English speaking household member, race, and education (Table 2). A greater proportion of households with a non-English speaking member reported feeling “somewhat prepared” (39.5%, 95% CI: 22.6–59.3) or “unprepared” (20.7%, 95% CI: 9.2–40.3), compared with households without a non-English speaking member (38.4%, 95% CI: 30.9–46.6 and 13.6%, 95% CI: 9.4–19.2, respectively). A greater proportion of Asian-American households reported feeling “unprepared” (31.4%, 95% CI: 19.4–46.7), compared with black/African-American (11.0%, 95% CI: 3.2–31.6) or white (8.9%, 95% CI: 4.5–16.7). The proportion of households where high school was the highest level of school attained by a household member who reported feeling “unprepared” was twice that of households with a bachelor’s degree holder (25.7%, 95% CI: 8.5–56.4 vs 12.6%, 95% CI: 7.0–21.7).
TABLE 2 Characteristics by Perceived Preparedness

Abbreviations: AA, African American; PI, Pacific Islander.
a Respondents who answered 0 people in household were re-coded as 1 person in the household.
b n < 5 responses (unweighted).
c Indicates that the difference was significant at the P < 0.05 level.
Self-Reported Preparedness Behaviors
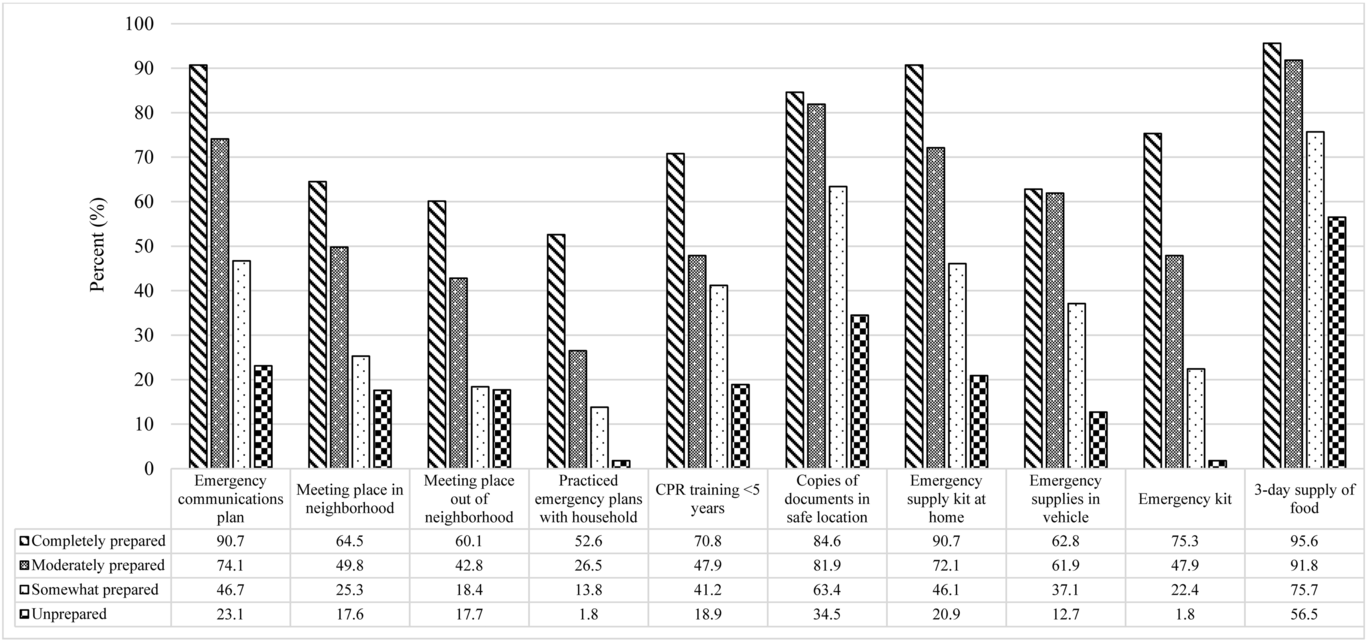
Across multiple preparedness behaviors, larger proportions of respondents who reported that they were “completely prepared” or “moderately prepared” said that they engaged with the behavior, than respondents who said they were “somewhat prepared” or “unprepared” (Figure 1). For example, 90.7% (95% CI: 65.5–98.1) of respondents who said they were “completely prepared” said they had an emergency communications plan, compared with 74.1% (95% CI: 62.3–83.2) of “moderately prepared,” 46.7% (95% CI: 36.3–57.4) of “somewhat prepared,” and 23.1% (95% CI: 12.5–38.5) of “unprepared” households. Differences were also observed in having emergency supplies; these varied by preparedness group as well as by demographic factors such as education level. While the “completely prepared” group reported the highest proportion of respondents engaged in various preparedness behaviors, there were respondents whose responses indicated they were not prepared, despite feeling that their household was very prepared for an emergency or disaster. Only half of households who reported feeling “completely prepared” reported having practiced emergency plans with all members of their household (52.6%, 95% CI: 29.7–74.4), and 60.1% (95% CI: 38.0–78.7) reported having a designated meeting place outside of their neighborhood in case they could not return home.

FIGURE 1. Percentage (Weighted) of CASPER Respondents Engaging in Preparedness Behavior by Level of Perceived Preparedness.
When examining demographic characteristics of respondents and their households, perceived preparedness as a dichotomous variable (unprepared/somewhat prepared vs moderately/completely prepared) was a significant predictor in 3 models where outcomes were having practiced emergency plans, having an emergency communication plan, and having multiple routes in case of evacuation. However, the model appeared to fit the data in only the model examining factors related to having multiple routes in case of an evacuation (goodness-of-fit test: P = 0.7860).
Communication Sources in an Emergency
When asked who they trusted for reliable information in an emergency, the greatest proportion of respondents in all 4 groups of perceived preparedness reported they would trust local emergency responders (Table 3). Comparing the 4 groups, the lowest proportion was observed in the “completely prepared” group (47.3%, 95% CI: 19.1–77.4), followed by “somewhat prepared” (56.9%, 95% CI: 43.9–68.9), “unprepared” (67.4%, 95% CI: 51.0–80.4), and “moderately prepared” (72.3%, 95% CI: 60.7–81.5). Television was reported to be the household’s main source of information regarding disasters or emergencies across the 4 perceived preparedness groups. A greater proportion of respondents in the “completely prepared” group reported that they would use radio (30.1%, 95% CI: 11.1–59.9), text messages (27.6%, 95% CI: 10.2–56.1), or a local emergency alerting system (27.6%, 95% CI: 10.8–54.4), compared with the other preparedness groups. More respondents who reported feeling “unprepared” said they would look to Internet websites for information regarding disasters or emergencies (35.4%, 95% CI: 20.3–54.0), compared with “somewhat prepared” households (26.5%, 95% CI: 17.1–38.6), “moderately prepared” households (26.8%, 95% CI: 17.8–38.2), and “completely prepared” households (29.4%, 95% CI; 8.4–65.4). Enrollment in Fairfax Alerts or a similar emergency alerting system was highest among “completely prepared” respondents (70.8%, 95% CI: 38.4–90.4). In comparison, 27.8% (95% CI: 14.6–46.5) of “unprepared” respondents reported that they were enrolled in Fairfax Alerts or an emergency alerting system.
TABLE 3 Emergency Communications by Perceived Preparedness

Evacuation Barriers
While a large percentage of all preparedness groups reported that they would evacuate if asked to do so (90.4–94.3%), differences were observed by preparedness group for reasons that might prevent them from evacuating (Table 4). A greater proportion of respondents who said they were “unprepared” reported potential barriers to evacuating including concerns about personal safety (29.2%, 95% CI: 15.2–48.8), having nowhere to go (27.7%, 95% CI: 14.1–47.2), that it was inconvenient/expensive (23.3%, 95% CI: 10.4–44.4), lack of trust in public officials (12.8%, 95% CI: 5.0–29.0), and health problems (10.9%, 95% CI: 3.3–30.5). For respondents who said their household was “completely prepared,” the greatest proportion said that lack of transportation would be a reason that they would be prevented from evacuating (23.2%, 95% CI: 7.6–52.4). For respondents who said they were “moderately prepared” or “somewhat prepared,” concern about traffic jams was the leading reason (moderately prepared: 37.5%, 95% CI: 26.1–50.6; somewhat prepared: 23.8%, 95% CI: 14.4–36.6). Small but statistically significant differences were observed in reported intention to evacuate by race and ethnicity, education, and having a non-English speaker in the home.
TABLE 4 Evacuation Barriers by Perceived Preparedness

DISCUSSION
Respondents who believed that their household was “moderately” or “completely prepared” for an emergency or disaster more frequently reported engaging in preparedness-related behaviors, such as having an emergency communications plan, having a 3-day supply of food, and having an emergency supply kit at home, compared with households who reported that they were “somewhat prepared” or “unprepared.” Given the cross-sectional nature of the data, it is not possible to identify whether perceiving that a household is prepared increases the likelihood that they engage with preparedness behaviors, or whether knowledge of and engagement with strategies to increase preparedness results in a perception of being more prepared. Furthermore, the position of the 2016 CASPER survey question on perceived preparedness followed questions related to preparedness behaviors, which may have led to priming of respondents. Despite these limitations, important information can be gained about opportunities to strengthen preparedness messaging to households who may feel more prepared for emergencies, as well as those who feel less prepared for an emergency or disaster.
For some preparedness behaviors, a considerable proportion of households who reported that they were completely prepared for an emergency were, in fact, not prepared. Nearly half of households who reported they were “completely prepared” had not practiced emergency plans with all members of their household. Practicing an emergency plan is an important part of preparedness to respond to an emergency. While it is listed as the fourth step in Ready.gov’s “Make A Plan” checklist, 10 specific information on what elements of the plan should be practiced, and how frequently, are not provided. More detailed recommendations on the value of practicing emergency plans with all members of the household, including children, older adults, and pets, as well as guidance on how and when to practice plans, could be an important area for improvement in preparedness planning guidance for the public.
While the majority of households reported they would evacuate if ordered to do so, perceived barriers to evacuation may impede their ability to evacuate. Messaging could be developed and shared with the community to address concerns about traffic jams preventing evacuation, such as the importance of having multiple routes from home, workplaces, and schools, as well as communication regarding supplies to shelter-in-place if evacuation is not possible. Almost 4 in 10 households who reported they were “completely prepared” did not have emergency supplies in their vehicle, which could be critical if an evacuation were ordered while family members were away from home at work or school. Tools such as the emergency kit checklist for parents, produced by Ready.gov and the Federal Emergency Management Agency (FEMA),11 provides guidance on which supplies should be included in an emergency kit in a vehicle, including supplies that would be less susceptible to spoilage in the extreme temperatures reached inside of a vehicle.
Sources of information that would be used in an emergency varied across perceived preparedness groups. Television was reported to be the main source of information in an emergency in all 4 groups, yet if widespread power outages occur, televisions may not have power, leaving them a less useful tool than a battery-powered radio, for example. Local emergency responders were most frequently reported to be trusted for reliable information in an emergency, however, it is important that relationships with community members are strong before an emergency. A qualitative study of environmental health emergency preparedness and response officials identified that direct outreach to residents was typically only performed when responding to an emergency, rather than to expand preparedness engagement.Reference Gamboa-Maldonado, Marshak and Sinclair12 Enrollment in emergency alerting systems declined as households reported lower levels of perceived preparedness. Households who feel “somewhat prepared” or “unprepared” for an emergency or disaster are an important group for outreach about the value of emergency alerting systems. Exploring opportunities to expand enrollment in Fairfax Alerts and similar emergency alerting systems through community partnerships, for example, may be an effective strategy to improve preparedness and response through an accurate, trustworthy information source.
The results of this assessment are specific to Fairfax Health District, Virginia; given the diverse representation of households, the results may not be generalizable to other communities. However, the results of this CASPER illustrate how valuable information can be collected through community assessments for preparedness for emergencies and disasters. By identifying households who feel prepared for emergencies, yet are not engaged with certain preparedness behaviors, education and outreach activities can be targeted. Future research could examine households who did not engage with preparedness behaviors, and who either felt completely prepared or unprepared for an emergency, to explore barriers and opportunities to engage with behaviors. For example, it may be possible to assess whether issues such as lack of knowledge, awareness, time, and/or resources are major impediments to preparedness. Questions could also be asked to assess whether respondents felt that these strategies would or would not improve their ability to respond in an emergency, as well as the perceived likelihood of an emergency that would affect their household.
CONCLUSION
A community assessment for household preparedness attitudes and behaviors provides important information about public preparedness planning and can be used to inform targeted education and outreach to groups who feel prepared to respond in an emergency yet are not fully engaged with steps to enhance their level of preparedness.
Conflicts of Interest
The analysis and authorship of this manuscript was completed within normal operating budgets. The authors have no conflicts of interest to report.