

Great concern has arisen that there is insufficient capacity in hospitals/health systems to absorb large numbers of casualties during a catastrophic event.1–Reference Kaji, Koenig and Bey4 Many alleviating measures require external support2, Reference Hick, Hanfling and Burstein5; however, hospitals are expected to manage without expectation of external aid for up to 96 hours.6
Surge capacity in the health care sector can be defined as the maximum potential augmentation of resources available to care for the influx of an unexpectedly large number of patients.Reference Kelen and McCarthy7 Surge capacity can be augmented by increasing resources, decreasing demand, or redistributing assets.Reference Hick, Hanfling and Burstein5, Reference Kelen, Kraus and McCarthy8 Means to achieve the latter 2 are the most efficient and cost-effective. From this perspective, the authors previously advanced the concept of reverse triage, wherein inpatients at low risk for untoward events would be discharged or transferred back to the community. This approach gives inpatients and disaster victims equal consideration for inpatient resources.Reference Kraus, Levy and Kelen9 A system of considering patient risk profiles for early discharge was recently published.Reference Kelen, Kraus and McCarthy8 We tested this concept and tried to determine the potential contribution to the augmentation of surge capacity during a catastrophic event in a large health system with 3 diverse hospitals.
METHODS
Setting
The institutions studied were a health system’s 3 hospitals, 3 to 27 mi apart, each serving a distinct area in Maryland. The hospitals were an inner-city university hospital, a mid-size teaching affiliate in a working class neighborhood, and a nonteaching community hospital located in a primarily affluent county (Table 1). Patients from these hospitals were prospectively sampled and surveyed as described below.
TABLE 1 Capacity of 3 Study Hospitals During Observation Period

Design
Using a blocked randomized design controlling for day of week, inpatient units at the 3 hospitals were prospectively canvassed during a 19-week period ending in February 2006. The underlying precept was that a major disaster occurred on the day of sampling at time 0 (T0). Patients present on sampled units at T0 were followed for 4 days.
Selection of Study Subjects
There were 32, 12, and 6 inpatient units identified as appropriate for study in the academic center, teaching affiliate, and community hospital, respectively. Pediatrics, newborn nursery, and ICUs were excluded because they were considered special populations.Reference Kelen, Kraus and McCarthy8 Units at the affiliate and community hospitals were sampled 2 and 4 times, respectively, as often as the academic center to ensure an adequate sample size.
At the time of unit sampling, all of the patients included in the morning census were identified for study. Demographic and clinical information were abstracted from the medical and billing records. Patients discharged on day T0 were excluded because their hospital stay was complete and final disposition was established.
The following data were obtained for each patient: basic demographic information, arrival date, enrollment date (ie, T0) and discharge date, inpatient unit type (eg, medical, surgical), source of admission (nonelective vs elective), procedures, and interventions. The institutional review board approved the study.
Safe Early Discharge
An expert panel previously determined that patients with less than a 12% likelihood of a consequential medical event related to early hospital discharge were appropriate to consider for release during a disaster.Reference Kelen, Kraus and McCarthy8 Consequential medical event was defined as “unexpected death, irreversible impairment, or reduction in function.”Reference Kelen, Kraus and McCarthy8 Furthermore, medical events are consequential only if there is an in-hospital intervention with the potential to reverse or prevent additional deterioration.Reference Kelen, Kraus and McCarthy8 Because it would be unethical for the sole purpose of advancing science to measure medically consequential events by withholding treatments, a proxy was developed. The best proxy for a consequential medical event was determined as initiation or continuation of a critical intervention (CI).Reference Kelen, Kraus and McCarthy8
CIs were previously defined and weighted on a scale of 1 to 10 based on the risk of a bad outcome.Reference Kelen and McCarthy7 For the purposes of analysis, CIs were placed in 3 categories: major importance (scale of 7–10), moderate importance (scale of 5–6), and lower importance (scale of ≤4). CIs were further classified as discrete (ie, no continuous aspect, such as defibrillation, incision, drainage), or continuous, (eg, intravenous medications, cardiac monitoring).
Analysis and Endpoints
Patient evaluation of 4 days (approximately 96 hours) was based on experiences with recent major, high-impact disasters, showing that communities should expect to sustain medical services for 24 to 96 hours,Reference Stratton and Tyler10 and The Joint Commission revised standards requiring hospitals to identify stand-alone capabilities for the same period.6
Patients were considered to have a CI if a continuous CI initiated before T0 remained in place or if any (continuous or discrete) CI occurred after T0. CIs were ranked hierarchically by importance for patients experiencing more than 1. Patients without a CI during the 4-day observation period were considered suitable for early discharge.
The total numbers of study beds for each hospital were ascertained (Table 1) to estimate the potential for creation of surge capacity in 2 categories. Daily gross surge capacity was determined by summing unoccupied staffed beds, opening unstaffed but licensed beds on the study services, discharging patients suitable for early release, and routinely discharging inpatients daily. To be conservative, we assumed availability of only half the offline licensed beds for the first 24 hours, but we assumed all licensed beds were available within 48 hours. To correspond patient-based sampling with bed equivalents, patient proportionate data were applied to the average floor census (Table 1). For example, if 33% of patients were classified as early discharges, 33% of average floor census was the estimated bed availability.
Net surge capacity was calculated by subtracting from gross surge capacity the estimated bed requirement from expected nonelective (emergency) admissions, unrelated to the disaster. Emergency admissions were acquired from the sampled services’ official census data during the study period. The estimated capacity consumed by nonelective admissions was further adjusted for actual discharge patterns similarly obtained (Table 1). Because routine emergency department (ED) visits and admissions are known to decrease during times of “disasters,”Reference Schull, Stukel and Vermeulen11 a conservative 75% of routine emergency admission volume was used for calculations. The effects of varying volumes of routine nonvictim emergency admissions were determined for 25% to 100% of experienced volume as well. The projected gross and net surge capacities potentially attained were calculated using staffed study beds as the denominator (Table 1), the standard figure used to measure capacity.12 It was assumed that all “elective admissions” could be postponed after 24 hours during a significant disaster. Surge capacity was determined for each of the 4 days. To account for the oversampling at the teaching affiliate and community hospitals, the results were adjusted based on the relative sampling frequency.
RESULTS
Although facility size varied, the proportion of beds suitable for study was similar for the academic, teaching affiliate, and community hospitals (68%, 73%, and 73%, respectively), as was the proportion of staffed beds and average floor census (Table 1).
There were 4781 patients identified during T0 sampling. Of these, 504 did not have complete data available. A further 786 patients were excluded because they were discharged on T0. Accordingly, the detailed study set comprised 3491 discrete patients whose characteristics varied significantly by hospital (Table 2). The median number of days in the hospital at T0 was 3 (interquartile range 1–7). Case mix of the sample was similar to the national hospital discharge data.13 Length of stay (LOS) ranged from 3.7 to 4.5 days (Table 1). Overall LOS nationally at the time was 4.8 days.12
TABLE 2 Description of Study Population by Institution

There were 7386 CIs performed on 1950 (56%) patients during the 4-day evaluation period (Table 3). Most (59%) CIs were initiated before and continued beyond T0. Of the remaining CIs, 21%, 10%, 8%, and 3% were initiated on days 1, 2, 3, and 4, respectively. There were 1541 (44%) patients who had no CIs during the evaluation period. Of these, 562 (37%) had a CI initiated before, but discontinued before, T0 enrollment. These patients thus met criteria for appropriate early discharge. Only 128 (8%) patients without a CI during the 4-day evaluation period ultimately had at least 1 CI performed later in their hospital course, with most (95) of these initiated at least 6 days beyond T0.
TABLE 3 Frequency of Critical Interventions

Most CIs were either of major (40%) or moderate (57%) importance (Table 4). Patients who were considered suitable for early discharge were 40%, 47%, and 59% of the sample for the academic, teaching affiliate, and community hospitals, respectively.
TABLE 4 Critical Interventions (CIs) Required During Study Period at 3 Hospitals*

The likelihood of not requiring a CI or being discharged during the evaluation period varied somewhat by patients’ primary condition: 61% psychiatric, 61% oncological, 71% surgical, 76% medical, and 93% obstetrical.
Projection of Potential Surge Capacity
Figure 1 shows the potential surge capacity creation for each day, detailing the contribution of each action. Given the mean floor census of 82%, each site had on average 18% readily available capacity at T0 from staffed unoccupied beds (Table 1). An additional 5% to 9% of capacity, depending on the site, could be made available if all unstaffed licensed beds could be resourced (Table 1). In the academic, affiliate, and community hospitals, 33% (95% CI 29%–36%), 39% (95% CI 33%–45%), and 48% (95% CI 41%–56%) of beds, respectively, could be made available by early discharge on T0 (Fig. 1). Routine (actual) discharges among patients who were not suitable for early discharge (ie, experienced a CI, but discharged) would account for a further 21% (95% CI 18%–24%), 30% (95% CI 25%–36%), 25% (95% CI 19%–32%) bed capacity, respectively. Gross surge capacity available from all actions peaked at 77% (95% CI 73%–80%), 95% (95% CI 92%–98%), and 103% (95% CI 88%–118%) of baseline staffed beds, respectively. However, net surge capacity (likely availability for disaster victims only) was 66% (95% CI 63%–70%), 71% (95% CI 66%–77%), and 81% (95% CI 75%–87%), respectively (Fig. 1). Each 25% reduction or increase in nonelective admissions results in a net change of 3% (95% CI 0%–6%), 8% (95% CI 4%–12%), and 7% (95% CI 3%–11%) in net surge capacity, respectively. Reverse triage comprised the majority (50%, 55%, 59%) of surge bed creation.
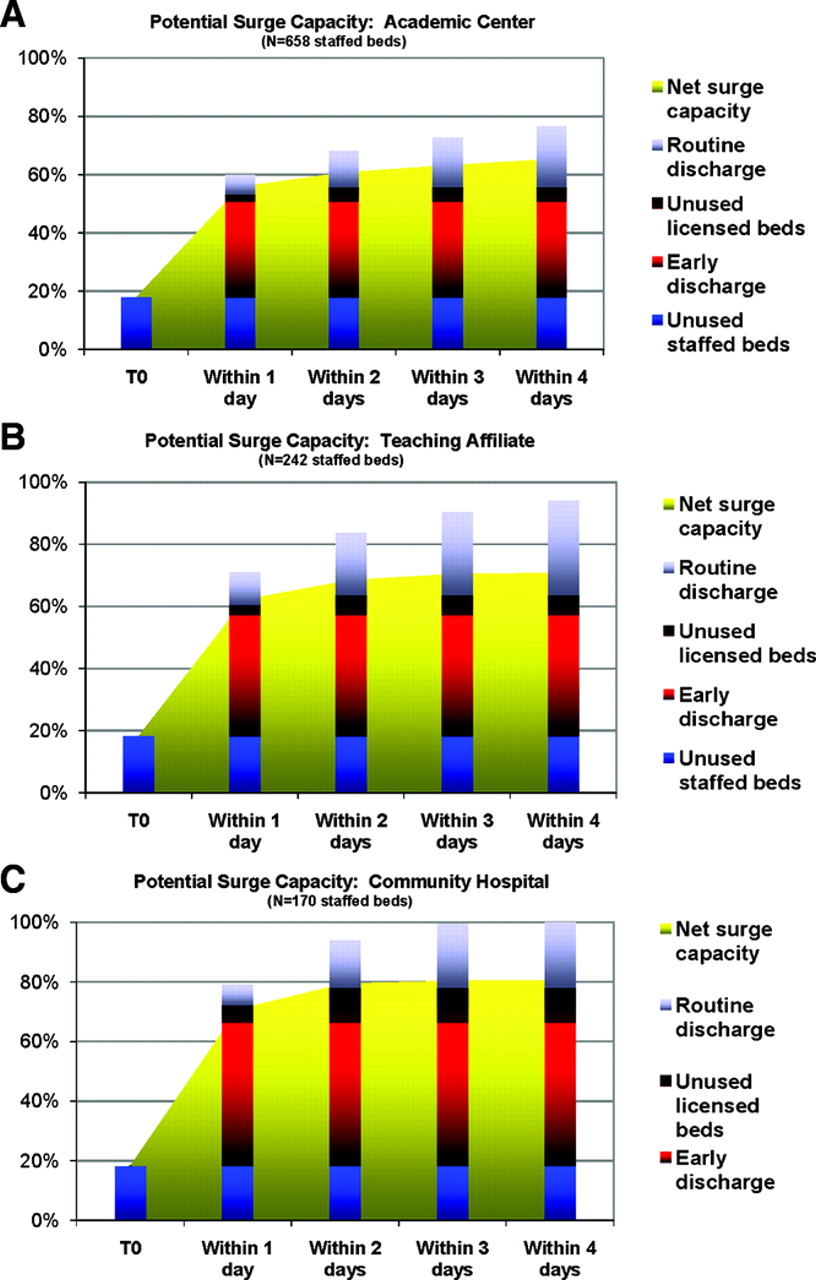
FIGURE 1 Potential surge capacity. Gross surge capacity and component contribution are shown in histogram. Net surge capacity, which accounts for estimated routine nonvictim emergency admissions, is shown as yellow background to the bars. T0 = initial time of catastrophic event
DISCUSSION
We believe this study challenges the inadequacy of inpatient surge capacity, at least for catastrophic events with short duration impact. Although varying somewhat among facilities, the potential effect size of realizable surge capacity was considerable, ranging from 77% to more than 100% for gross capacity, and 66% to 81% for net surge capacity. Whereas net surge capacity provides a sense of bed available strictly for disaster victims, gross capacity provides an estimate compatible with a utilitarian ethics framework.Reference Kelen and McCarthy7, Reference Kelen, Kraus and McCarthy8
The concept of reverse triage advances the utilitarian approach.Reference Kelen, Kraus and McCarthy8 Disaster victims, those presenting with unrelated emergencies, and inpatients can be considered equally for allocation of scarce resources. Homeland Security Presidential Directive-21 also calls for this approach.3 Others have advanced a similar notion for the distribution of mechanical ventilation and other scarce ICU resources during times of overwhelming need. Reference Hick and O’Laughlin14–Reference Devereaux, Christian and Sandrock16 Applying the concept of reverse triage had the greatest effect of creating new capacity in each facility. Opinion-based survey assessments found significant capacity augmentation from early discharge if community resources were available.Reference Davis, Poste and Hicks17, Reference Challen and Walter18 However, we believe our study represents the first empiric evidence for the potential of this strategy. An even larger percentage of patients could be sent home safely or avoid admission should the concept of “hospital at home” be available during a disaster.Reference Shepperd, Doll and Agnus19 Thus, reverse triage offers an important new approach in the creation of surge capacity, requiring no substantial resource increment.
Among those who appeared appropriate for early discharge, 8% in fact required a CI beyond 96 hours. Given that the vast majority were initiated 6 or more days out, one can argue that the majority of this group would still have been safe for 96 hours in the community. The aggregate risk of early discharge (at least to low-acuity settings) for this subcohort of patients until the medical community recovers, appears acceptable from the utilitarian perspective.Reference Kelen, Kraus and McCarthy8, Reference Kraus, Levy and Kelen9 Previous work indicated a risk tolerance for untoward events due to early discharge of up to 12% if necessary.Reference Kelen, Kraus and McCarthy8
Our data revealed some unexpected results. Filling open staffed beds brought considerable contribution to surge creation, whereas opening unstaffed licensed beds contributed less. Unstaffed licensed beds were included in the model because exercising crisis-appropriate (sufficiency) care is an increasingly acceptable stand-alone hospital response.20–Reference Kanter and Moran23 Routine daily discharges for patients not deemed initially safe for discharge also contribute substantially to potential surge.
A key to surge capacity is cancellation of elective admissions, which is readily achieved.Reference Stratton and Tyler10 Our model conservatively assumed elective admission cancellations only after the first 24 hours. Nonelective admissions are also expected to be lower than routine. High-acuity visits to EDs during the 2002–2003 severe acute respiratory syndrome (SARS) epidemic decreased by 37% in the greater Toronto, Canada, area, although the related decrease in emergency admissions is unclear.Reference Stratton and Tyler10 However, a similar study in Taiwan showed a virtual 1:1 relation in the decreased ED visits to decreased admissions during the SARS epidemic.Reference Tsai, Arnold, Chuang, Chi, Liu and Yang24 The 1994 Northridge, California, earthquake experience suggests that ED visits for traditional conditions (eg, respiratory, fever, gastrointestinal) decrease after a disaster.Reference Salinas, Salinas and Kurata25 Furthermore, many elective admissions are processed through EDs for expediency and insurance concerns,1 inflating emergency admissions during normal times.
Finally, we studied a system of 3 different facilities to gain an understanding of potential differences in the creation of surge capacity. The experience to date, including the World Trade Center catastrophe, is that institutions in closest proximity to the disaster are the ones to be overwhelmed.Reference Cushman, Pachter and Beaton26 Other centers may be called into service to accept specialty transfer patients. With such high levels of capacity potentially available, a tertiary care center could transfer patients to a lower acuity center as a means to augment its high capability capacity further. Although mass evacuations, organized and ad hoc, have occurred,Reference Cocanour, Allen and Mazabob27, Reference Schultz, Koenig and Lewis28 the logistics of mass transfers during widespread crisis have not been addressed well in most institutions.
In our model, the near full realization of potential surge capacity occurs within 24 to 48 hours. Being conservative, we assumed that routine elective admissions on the first day would still occur, even though many such patients could also be immediately discharged. We further assumed that only 50% of unstaffed licensed beds could be resourced within 24 hours, reasoning that it would require up to 2 days to staff appropriately or apply crisis-appropriate care. We also did not account for patients who could be transferred to low-acuity settings or hospital at home, and we did not consider resource intensive capacity modulations, including the use of unlicensed beds.2,Reference Kaji, Koenig and Bey4–Reference Kelen and McCarthy7 An even larger percentage of patients could be safely sent home or avoid admission, should the concept of hospital at home be available during a disaster.Reference Shepperd, Doll and Agnus19
Still, the data presented should be approached with some caution. The study involved only a single health care system. Nonetheless, each hospital has a unique organization and constituency and is thus representative of many US hospitals. Occupancy rates at all 3 hospitals are considered ceilings for efficiency—much higher than occupancy rates (69%–75%) experienced across the country in 2005.12 Accordingly, augmenting capacity in the study hospitals would generally be a greater challenge than the average US hospital experience.
No system to date has outright validated our approach using CIs as a proxy measure of potential untoward events. The concept was, however, developed and unanimously approved by a multidisciplinary panel,Reference Kelen, Kraus and McCarthy8 and the derived data are in the same order as other studies based on opinion.13, Reference Hick and O’Laughlin14 Finally, the present report does not provide a framework to predict which patients are unlikely to require a CI for several ensuing days, but it does show that if a system predicting risk can be harnessed, it would be a powerful tool. The authors are engaged in work that allows this type of assessment in rapid fashion similar to other risk-predictive instruments. Reference Fine, Auble and Yealy29–Reference Knaus, Wagner and Draper31 If such a system could be developed, then the national Hospital Available Beds for Emergencies and Disasters system, which monitors available beds in real time,32 could incorporate the concepts studied here to estimate potential medical surge at the national, regional, and local levels.
We did not consider ICUs, newborn nurseries, or pediatrics. Although the reverse triage concept is the same for these, previous work was insufficient to allow the methodology to be applied. Only the academic center has a significant proportion of pediatric patients, and almost all of these patients are in a distinct building within the medical complex. More important, this study does not and was not designed to address capacity concerns for ICU beds, ancillary studies, and operative and other specialty care.Reference Traub, Bradt and Joseph33, Reference Einav, Aharonson-Daniel, Weissman, Freund and Peleg34 Despite the apprehension,Reference Kaji, Koenig and Bey4 such concerns have not been shown as a true limitation in major catastrophic events such as the World Trade Center disaster and other major events.Reference Jordan, Hollowed, Turner, Wang and Jeng35, Reference Cairns, Stiffler, Price, Peck and Meyer36 Finally, as stated from the outset, the concept studied here may not lend itself well to a prolonged event of a biologic nature such as pandemic influenza. However, the concept may indeed apply to containable epidemics with wide-reaching effects as was experienced during the SARS epidemic in Toronto.
Conclusions
We believe this investigation represents the first empirical study to address medical surge capacity. Creation of medical surge capacity may be greater than previously believed. Reverse triage, if appropriately harnessed, can significantly augment capacity without corresponding increase in resources. Methods to implement reverse triage and identify patients suitable for safe early discharge are being developed.
Authors' Disclosures
The authors report no conflicts of interest.


