


The novel coronavirus disease 2019 (COVID-19), which was caused by the severe acute respiratory syndrome coronavirus 2 (SARS-CoV-2), became an international pandemic.Reference Dong, Du and Gardner1,Reference Huang, Wang and Li2 The epidemic, which started in Wuhan, China, passed from person to person through respiratory droplets and aerosolization, allowing the disease to spread rapidly throughout the world.Reference Go, Mozaffarian and Roger3,Reference Zhou, Yu and Du4 As of April 17, 2021, there were more than 139 million confirmed cases of COVID-19 and more than 2.9 million deaths worldwide.5
With such a large number of individuals affected by this disease, the supply and demand of emergency department (ED) beds and intensive care unit (ICU) beds has created an imbalance, which strains available health-care resources.Reference Remuzzi and Remuzzi6 To effectively maintain health-care services, identifying patients who will require critical care is important. Various risk models have been developed for this purpose. Among these, patients are classified in 5 risk levels based on 4 risk factors in the Brescia-COVID Respiratory Severity Scale (BCRSS). In this prediction model, patients are offered treatment recommendations according to their examination and imaging findings. This algorithm is a step-wise approach to managing patients with confirmed/presumed COVID-19 pneumonia.Reference Duca, Piva and Focà7 Quick COVID-19 Severity Index (qCSI), on the other hand, is evaluated into 4 risk classes by a 12-point system (0-3 low risk, 4-6 low-intermediate risk, 7-9 high-intermediate risk, and ≥10 high risk) based on 3 variables (nasal cannula flow rate, respiratory rate, and minimum documented pulse oximetry).Reference Haimovich, Ravindra and Stoytchev8
Sufficient validation studies of these risk prediction models, for clinical prognoses in different patient populations, have not yet been performed. The aim of this study was to compare the prognostic performance of the BCRSS and the qCSI scores of hospitalized patients diagnosed with COVID-19.
Methods
Study Design
This retrospective observational study was carried out on data from patients admitted into the ED of a state hospital between May 1, 2020, and October 31, 2020. The local institutional review board approved this analysis and issued a waiver of consent (Ethics Committee Ruling number: 08012021/2668).
Selection of Patients
All adult patients over the age of 18 who were admitted into the ED with COVID-19 symptoms between May 1, 2020, and October 31, 2020, who had oropharyngeal and nasopharyngeal swabs, were included in this study. However, excluded from this study were patients whose test results for reverse transcriptase polymerase chain reaction (RT-PCR) were negative as well as those whose data could not be obtained, which is required to determine the risk scores. Also, patients who were in a state of shock at the time of admission to the ED and who received inotrope positive pressure support were not included in the study.
Measurements
For each of the patients included in this study, data were recorded on a form that included age, gender, examination on admission to the ED, and imaging findings. The 4 risk factors were calculated and recorded for BCRSS on the form: (1) the patient had wheezing or was unable to speak in full sentences, at rest or with minimal effort; (2) respiratory rate > 22; (3) oxygen saturation (SpO2) < 90%; and (4) repeat chest X-ray (CXR) is significantly worsening (defined as bilateral or diffuse infiltrates). The 3 variables for qCSI, that is, nasal cannula flow rate, respiratory rate, and minimum documented pulse oximetry, are based on a 12-point scale which was then divided into 4 risk classes (0-3 low risk, 4-6 low-intermediate risk, 7-9 high-intermediate risk, and ≥10 high risk), which was calculated for each patient and recorded on the form.
Outcome Measures
The primary outcome was all-cause in-hospital death. The secondary outcome is to determine the relationship between each scoring systems and ICU requirement. Outcomes were retrospectively assessed by reviewing of the hospital medical database.
Statistical Analysis
Statistical analyses were performed using SPSS 21.0 for Windows and MedCalc. Descriptive criteria, that include mean and standard deviation as well as median and min-max values, are presented as a percentage distribution. The compliance of the data with normal distribution was checked with a Kolmogorov-Smirnov test. A receiver operating characteristic (ROC) curve analysis was used to determine the predictive values of risk scores for determining in-hospital mortality and ICU admission. The ROC curves of the risk scores were then compared. The following was calculated using the DeLong method with the Youden index and with a 95% confidence interval of the area under the curve (AUC) for calculating the optimal cutoff value: positive predictive value (PPV); negative predictive value (NPV), positive likelihood ratio (LR+); and negative likelihood ratio (LR-).Reference DeLong, DeLong and Clarke-Pearson9 For the significance level P < 0.05 was appropriated.
Results
The data of a total of 447 patients were examined; of that total, 341 patients who met the inclusion criteria were identified, and these patients were included in the study.
The main characteristic findings of these patients are summarized in Table 1. There were 165 men and 176 women patients; the mean age was 58.2 ± 17.2 and 61.3% had at least 1 comorbidity. The most common comorbidities seen were hypertension (34%), COPD (20.5%), and cardiovascular disease (17.3%). The in-hospital mortality rate was 11.4%, and the ICU admission rate was 26.7%.
Table 1. Baseline characteristics of patients (n=341)
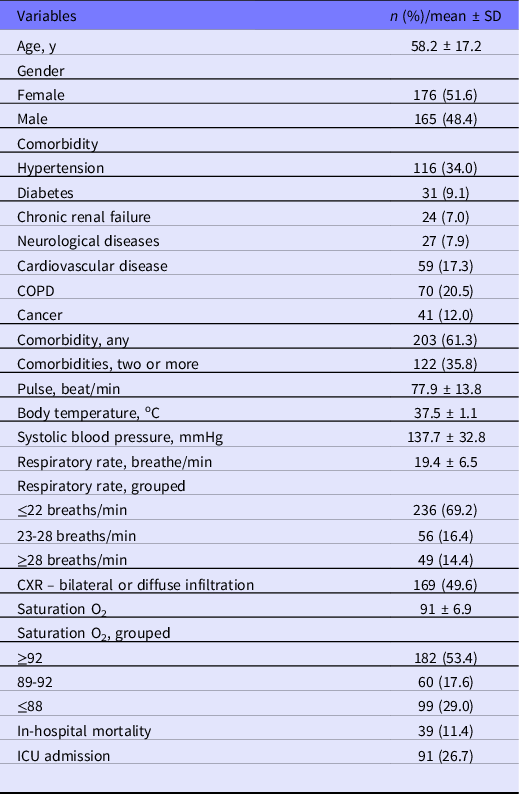
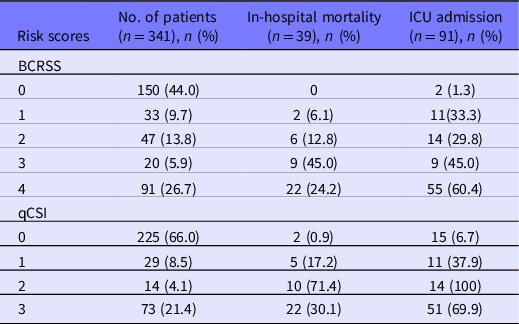
Table 2 shows the in-hospital mortality rate and the ICU admission rate in different BCRSS and qCSI risk classes. In both scoring systems, both the risk of in-hospital mortality and the risk of ICU admission increases as the risk class increases.
Table 2. Distribution of in-hospital mortality and ICU admission rates by risk groups
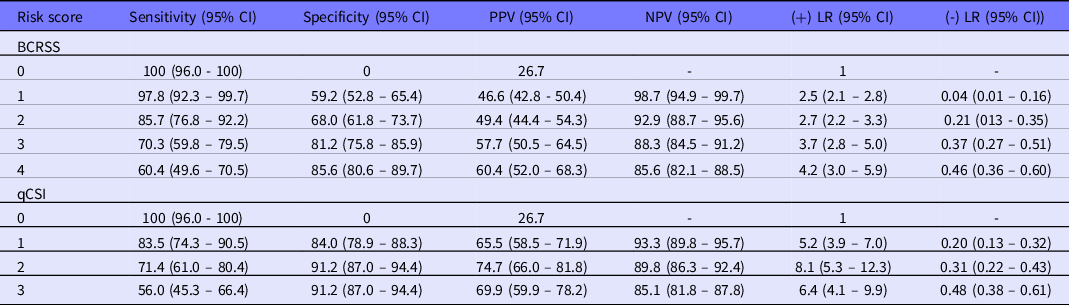
Shown in Tables 3 and 4 are the sensitivity, specificity, positive and negative predictive values, and odds ratios for the in-hospital mortality rate and ICU admission rate at different cutoff values for each prediction rule. With regard to in-hospital mortality, for the BCRSS and the qCSI scoring systems, the maximum value of the Youden Index was shown at the cutoff point ≥2 (Youden Index 0.548, sensitivity 94.9, specificity 59.9) and ≥1 (Youden Index 0.687, sensitivity 94.9, specificity 73.8). In terms of ICU admission, for the BCRSS and qCSI scoring systems, the maximum Youden index was shown at the cutoff point 1 (Youden Index 0.570, sensitivity 97.8, specificity 59.2) and ≥1 (Youden index 0.675, sensitivity 83.5, specificity 84.0).
Table 3. Sensitivity, specificity, PPV, NPV, LR+, and LR- of risk scores for predicting in-hospital mortality

Table 4. Sensitivity, specificity, PPV, NPV, LR+, and LR- of risk scores for predicting ICU admissions
The ROC curves for in-hospital mortality and ICU admission for each of the prognostic scoring system for COVID-19 are shown in Figures 1 and 2. The prognostic performance of the BCRSS and the qCSI scores were found as very good for in-hospital mortality (AUC 0.804 and 0.847, respectively) and as very good for ICU admission (AUC 0.842 and 0.851, respectively).

Figure 1. The ROC curves for in-hospital mortality for the BCRSS and qCSI scores.
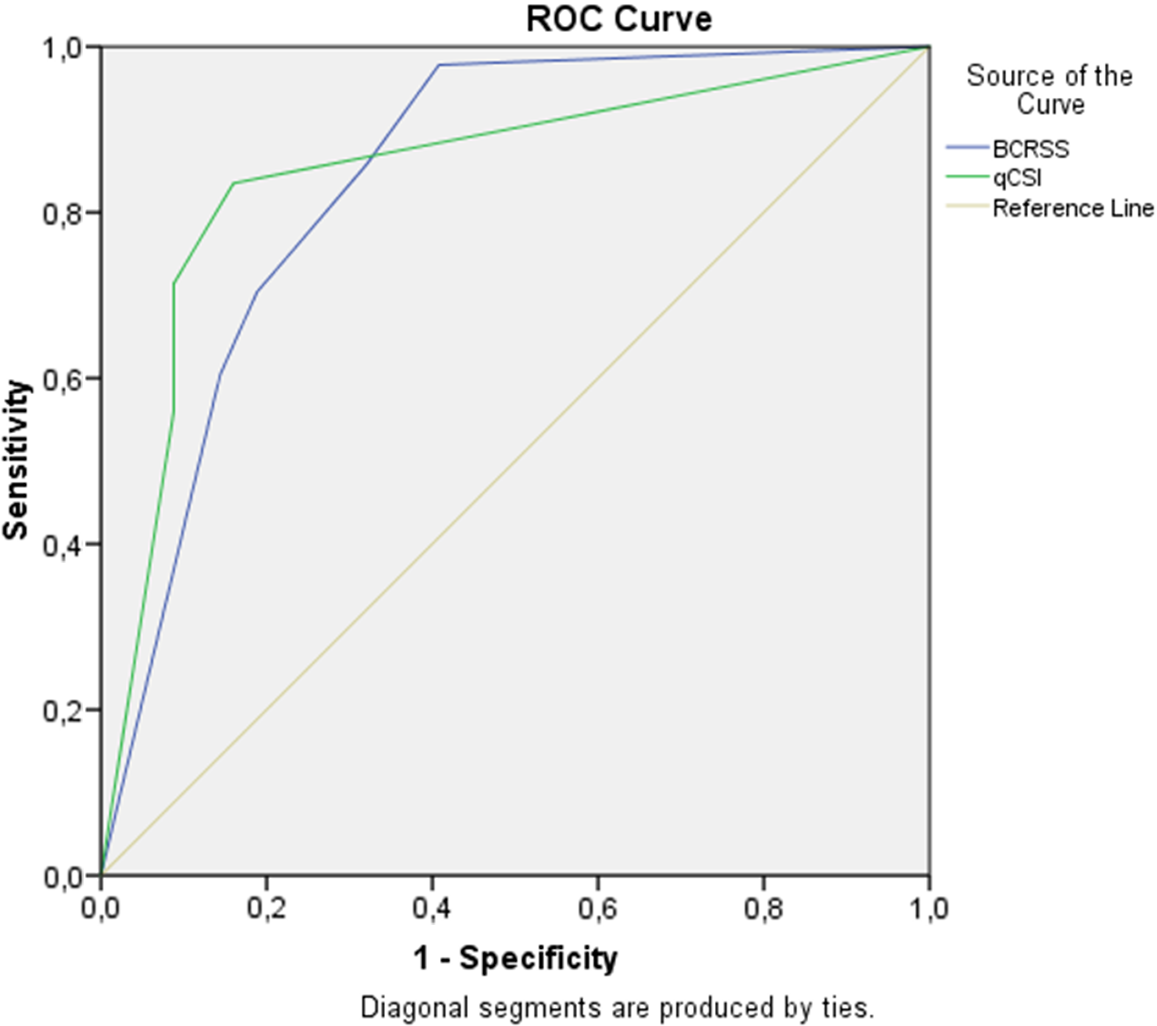
Figure 2. The ROC curves for ICU admission for the BCRSS and qCSI scores.
When the predictive powers of BCRSS and qCSI for in-hospital mortality were compared, no statistically significant difference was found between them (P = 0.029). Likewise, when the predictive powers of BCRSS and qCSI for ICU admission were compared, no statistically significant difference was found (P = 0.549) (Table 5).
Table 5. ROC analysis for in-hospital mortality and ICU admissions of the scores

Abbreviation: SE, standard error.
a DeLong’s test.
b AUC difference.
Discussion
In this study, we compared the prognostic performance of BCRSS and qCSI scores for in-hospital mortality and ICU admission of hospitalized patients diagnosed with COVID-19. In this patient group, the predictive power scores of BCRSS and qCSI were found as very good in terms of in-hospital mortality (AUC 0.804 and 0.847, respectively) and, likewise, in terms of ICU admission (AUC 0.842 and 0.851, respectively).
In our study, 61.3% of the patients had at least 1 comorbidity. In a study by Wang et al.,Reference Wang, Hu and Hu10 this rate was 72.2%, while for Grasselli et al., it was 68%Reference Grasselli, Zangrillo and Zanella11; however, there have been studies that do report a lower rate than ours.Reference Huang, Wang and Li2,Reference Guan, Ni and Hu12 Similar to previous research, our study showed the most common comorbidity in patients was hypertension,Reference Wang, Hu and Hu10,Reference Guan, Ni and Hu12 followed by COPD, and cardiovascular diseases. In our study, the in-hospital mortality rate was 11.4%, while the ICU admission rate was 26.7%. Different in-hospital mortality rates have been reported in the literature, ranging from 16% to 78%.Reference Zhou, Yu and Du4,Reference Wang, Hu and Hu10–Reference Arentz, Yim and Klaff13
The availability of ICU beds and the provision of intensive care vary between countries.Reference Rhodes, Ferdinande and Flaatten14 Information on the main characteristics and outcomes of critically ill patients, during a pandemic period in order to sustain health-care services is very important. For this purpose, a series of diagnostic and prognostic prediction models have been proposed for COVID-19.Reference Wynants, Van Calster and Bonten15 We examined the qCSI and the BCRSS models.
In our study, the AUC outcomes of the qCSI score for in-hospital mortality and ICU admission were 0.804 and 0.847, respectively. In the study by Rodriguez-Nava et al., the rates given were 0.781 and 0.761, respectively.Reference Rodriguez-Nava, Yanez-Bello and Trelles-Garcia16 The primary outcome of the study by Haimovich et al. for the qCSI score was determined as AUC 0.89: oxygenation flow rate ≥10 L/min, high-flow oxygenation, noninvasive ventilation, invasive ventilation, or death.Reference Haimovich, Ravindra and Stoytchev8
The AUC outcomes of the BCRSS score for in-hospital mortality and ICU admission were 0.842 and 0.851, respectively. These rates were given as 0.663 and 0.735 in the study by Rodriguez-Nava et al., respectively.Reference Rodriguez-Nava, Yanez-Bello and Trelles-Garcia16
The predictive performance of the scores from our study were found to be higher than those of other studies in the literature. We postulate that this difference in performance might be related to differences in clinical and demographic characteristics among populations. In addition, these scores are relatively new to the literature, and there have not yet been a sufficient amount of validation studies performed. For this reason, there are not enough studies available to compare with our study. In the light of this information, our study should be considered a validation study for both the BCRSS and the qCSI scores.
There are some limitations in our study. First, our study was conducted on a relatively small population from a single center and needs to be confirmed with a larger, multicenter cohort. In addition, due to the retrospective nature of our study, data were obtained from an electronic registration system, which might create limitations due to providing incomplete or outdated information.
In conclusion, both BCRSS and qCSI scoring systems were found to be successful in predicting in-hospital mortality and ICU admission in our patient population. Despite this, more studies are required to establish effectiveness for a wider range of settings.


