


Hospitals are vital assets for society, playing a crucial role in delivering high quality health care and securing reliable emergency medical services. In case of disasters, the number of patients to be rapidly treated increases significantly and the disruption of health-care services would result in more severe consequences for the population. Reference Arboleda, Abraham and Luitz1
In recent years, the concept of system resilience has been widely adopted to enhance the coping capacity against traditional and emerging threats to society. Reference Guinet and Faccincani2-Reference Cimellaro, Malavisi and Mahin8 A broad definition of resilience integrates all different capacities, notably “the intrinsic ability of a system to adjust its functioning before, during, or following changes and disturbances, so that it can sustain required operations under both expected and unexpected conditions”. Reference Hollnagel, Pariès and Wreathall9
The concept of resilience is also recalled in several recent studies on continuity of medical services under pressures or shocks of any type, even though many of them just touch a few aspects of the problem. Reference Shabanikiya, Jafari and Gorgi10-Reference Carthey, de Leval and Reason19 A wider and comprehensive view on building resilience capacities in the health-care sector emerged during the 2005 World Conference on Disaster Reduction, 20 when the model of “safe and resilient hospitals” was promoted. Over the years since, there has been work conducted in the field of health-care resilience directed toward the development of a consistent body of knowledge. Reference Mostafa, Sheall and Morris21-Reference Myrtle, Masri and Nigbor23 However, the research mainly focused on structural or functional hospital performance, Reference Mehani, Benouar and Bechtoula24-Reference Achour, Miyajima and Pascale26 on organizational aspects, such as staff attendance in disasters, Reference Senpinar-Brunner, Eckert and Wyss27 on risks assessment, Reference Loosemore, Carthey and Chandra28 disaster management, Reference Vanvactor29 or capacity improvement, Reference Manley, Homer and Hoard30 and only technical reports tried to offer a common framework for evaluating hospital resilience, starting from the “safe and resilient hospitals” model. 20
Indeed, improving hospital emergency management procedures to respond and adapt to emergency conditions and rapidly escalate operations in the emergency department (ED) is not enough. Reference Runkle, Brock-Martin and Karmaus31,Reference Faccincani, Pascucci and Lennquist32 When a hospital organization has to cope with a crisis, elective and urgent care activities are normally halted, because most of the available resources are redirected to the suddenly emergent needs. Reference Weinstein, Ragazzoni and Burkle33-Reference Coimbra, Edwards and Kurihara35 The process of recovering to normal routine operations and the re-planning of halted activities takes time, which results in a worsening of the quality of care delivered to a wide spectrum of hospitalized and outpatients, even in critical conditions. Reference Weinstein, Ragazzoni and Burkle33-36
According to some authors, instilling hospital resilience with a business continuity management (BCM) perspective 37,Reference Devlen38 is expected to improve hospital performance and quality of the health-care system at large, as highlighted in seminal studies. Reference Zhong, Clark and Hou39-Reference Labaka, Hernantes and Sarriegi43 However, a comprehensive view of BCM practical integration is still lacking, because building hospital resilience means finding more effective ways of orchestrating the available resources to concurrently secure the best possible response to the surge of medical emergency service demand and minimizing the disruption of critical and elective care delivery.
The aim of this study is to advance the knowledge and practice on hospital resilience, by identifying potential resource trade-offs in emergency situations and assessing different resource allocation strategies, oriented to preserve the continuity of ordinary and urgent medical services while securing responsiveness to the demand surge of emergency medical service. To this end, a simulation approach was adopted to study hospital’s core health-care delivery processes under routine and emergency conditions. The main objective was to compare different resource allocation strategies to respond to a mass casualty incident (MCI), taking into consideration emergency, critical, and elective care delivery processes. A specific set of performance metrics was developed to take into consideration multiple objectives and priorities. The study was conducted taking Ospedale San Raffaele (OSR), a large Italian hospital located in the Milan metropolitan area, as the empirical case.
Background
In the health-care domain, an MCI is defined as “a sudden and unexpected event that generates a number of patients that exceeds the response capacity of the local health system”. 44 The definition explicitly refers to both the number of patients involved, and the amount of available resources, and ultimately, “it is not related to any specific number of critically ill or injured individuals, or to any specific level of resources, but to the balance between resources and need”. Reference Lennquist45
In the present study, the effectiveness of different resource allocation strategies in response to an MCI are investigated in the context of PEMAF (Piano di Emergenza per il Massiccio Afflusso di Feriti, according to the current Italian nomenclature) implementation in OSR hospital as a study case. The PEMAF is a setting of organizational and procedural provisions that allows a hospital to cope with an MCI, maintaining a standard of treatment of patients comparable to the one granted to the single patient. 44
OSR is a private for-profit hospital included in the Lombardy Region Health System. Because of the Region health policy, 46 OSR can accept private patients (paying the health care themselves or being covered by insurance companies) but also patients covered by the national health insurance. It is the biggest Italian health complex: 1200-bed general hospital (including almost all the specialties), medical research center, and university. The ED counts for around 200 visits per day (73,000 yearly). The admission rate from the ED to the inpatient wards is around 15% (11,000 per year). The rate of bed occupation is close to 90% for the surgical wards, 75% for the medical ones. OSR was selected for this study because it was previously involved in research on the topics of hospital preparedness and management of MCI, Reference Guinet and Faccincani47,Reference Faccincani, Della Corte and Sesana48 in particular related to the European Union (EU) funded project THREATS (Terrorist attacks on Hospitals: Risk and Emergency Assessment, Tools and Systems. HOME/2013/CIPS/AG/4000005056) 49 and has developed a robust experience in this field.
In normal operating conditions, trauma team’s resources are devoted to the ordinary activities of the ED, which determine a condition of trade-off of the ED resources because they are devoted to different patients according to priority logic. This setting is suddenly changed with the recognition of an MCI, through the activation of PEMAF, to maximize the ED delivery capacity and properly treat the most critical patients. This requires the interruption of all the ordinary activities of the hospital: medical staff, spaces, and devices normally allocated to the usual demand of patients are immediately shifted to the demand of the “disaster patients.” 44 Therefore, a second trade-off emerges, between the ordinary activities of the entire hospital and those specifically required for managing the MCI, which is designed to ensure the maximum possible responsiveness to emergency, without paying enough attention to the disruption induced on a wide spectrum of other hospital services. Consequently, the recovery to normal hospital service performance for taking care of the majority of patients—eg, time waiting for services and the completion time of diagnostic protocols—may require weeks.
Hospital’s Response Strategy to an MCI: Current Practice and Possible Alternatives
The PEMAF is activated in 2 steps following a different procedure under daytime and night/holiday scenarios. It requires that a predefined portion of hospital staff, beyond the ED staff is rapidly and relocated to the ED during normal operating hours. If the number of incoming patients significantly exceeds the available resources, specific hospital medical staff receives the signal to move to the ED and elective services and procedures are interrupted.
The activation procedure of the PEMAF is radically different during night or holiday times. The specialized trauma resources on call (general surgeons, anesthesiologists, and operating room [OR] nurses) create 4 different trauma teams in less than 30 min. If the number of incoming patients increases, a second level of activation is triggered, which involves “all the available” staff, preselected to form a list of on-call personnel. In addition to the activation of additional resources, the PEMAF establishes procedural modifications at both the ED level and in other hospital wards (Figure 1).
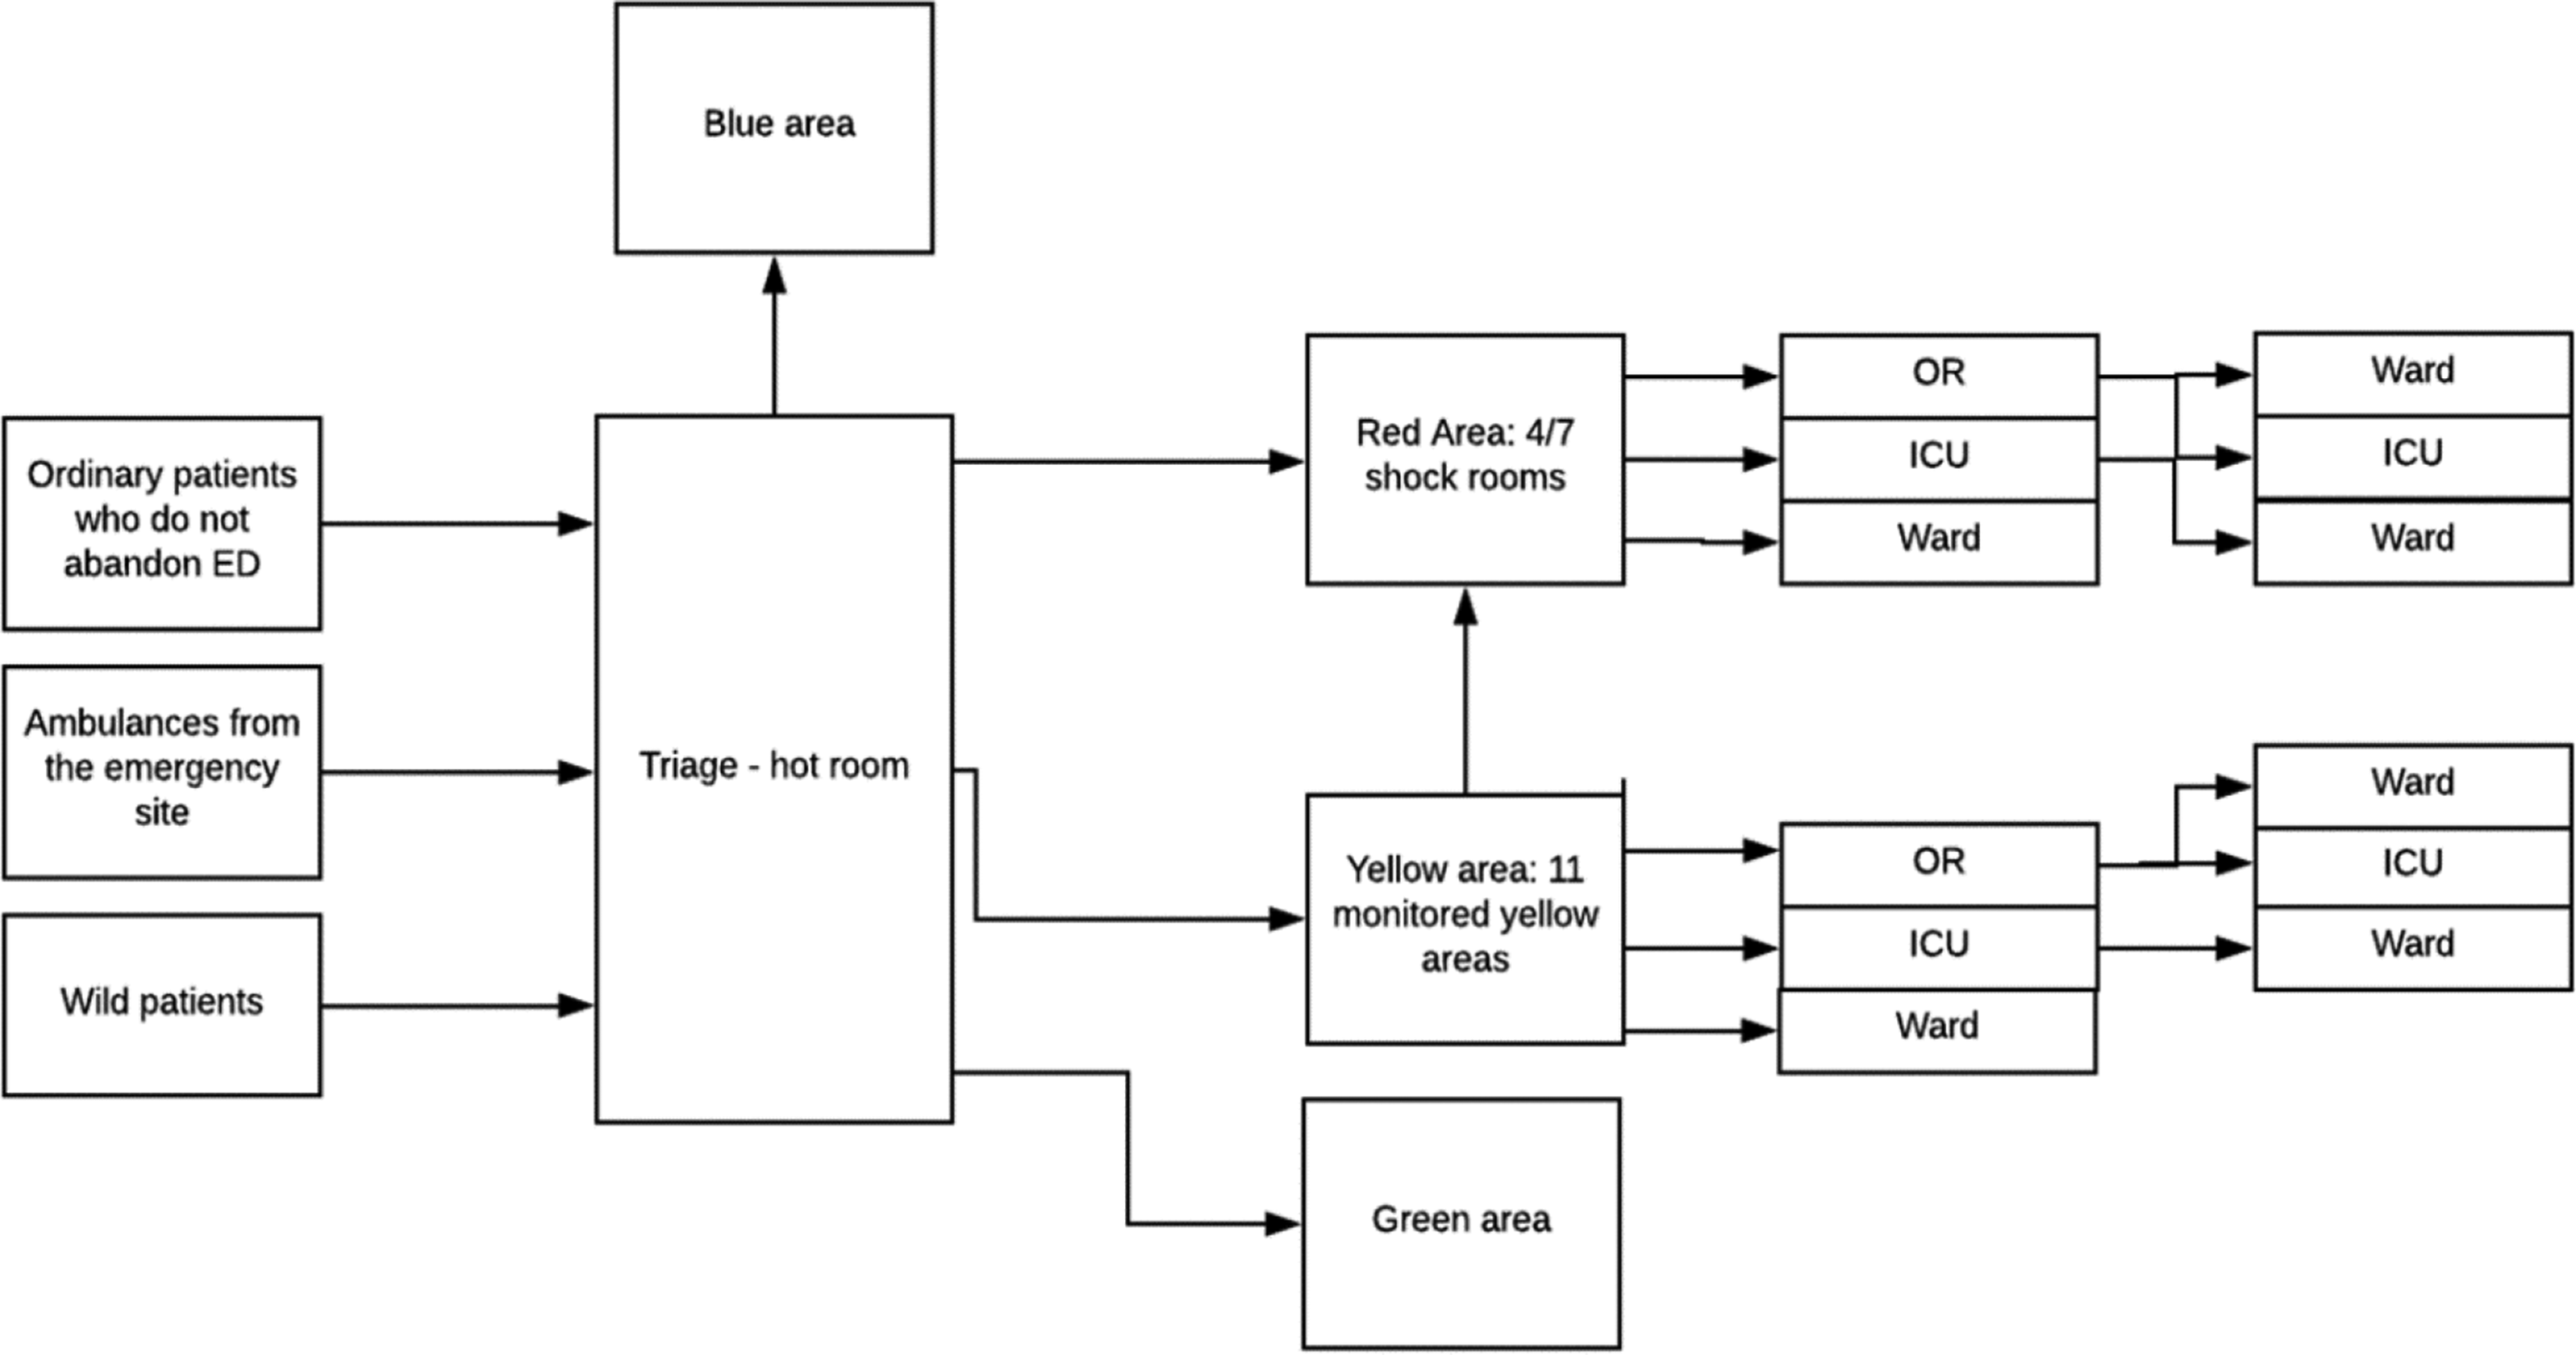
Figure 1. Reconfiguration of processes at OSR Hospital during an MCI.
The PEMAF clearly states that its activation requires the interruption of elective patient admissions in wards and nonemergent surgical procedures. This means that all the scheduled surgeries are postponed to a date to be rescheduled, as well as hospitalizations. This does not apply during the night or holiday MCI when the above-mentioned activities are absent.
Alternative Resource Allocation Strategies for a Daytime Scenario
Regarding the daytime scenario, the investigation of the coordination between emergency and elective medical service delivery is of particular interest. The study considered the possibility to develop alternatives to the strategy stated in the PEMAF (also referred as the “As-is” strategy), ie, activating and deactivating the reconfiguration of resources in 1 single step. The logic guiding such an approach is that of guaranteeing the maximum service delivery capacity to the ED for a matter of prudence. It is in fact considered unacceptable to put the conditions of urgent patients at risk to guarantee ordinary nonemergencies procedures. On the other hand, the disservice induced to ordinary patients is the drawback of this strategy. When considering ordinary patients, in particular those scheduled for a surgery, the heterogeneity of the procedures and of treatments cannot be neglected. There are cases in which a delay represents a very significant issue, beyond the revenue loss for the hospital. Figure 2 shows the current strategy suggested by the PEMAF.
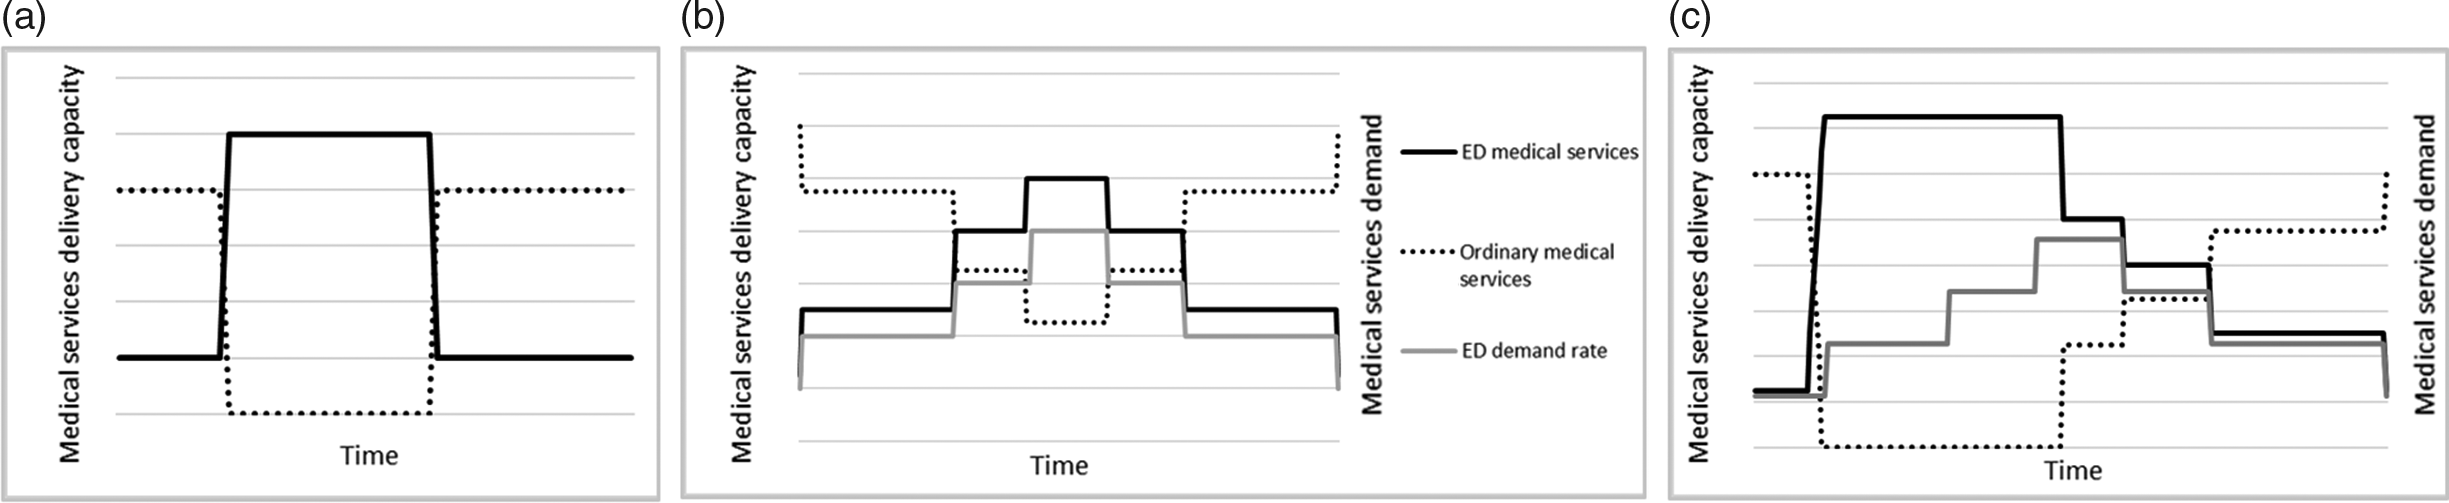
Figure 2. Time profile of resource reallocation in case of MCI: PEMAF strategy (baseline) (a), “Steps On-off” strategy (b), “Steps Off” strategy.
Two alternative resource allocation strategies were explored and compared against the current one: they are named “Steps On-Off” and “Steps Off.” The logic applied by researchers in designing these alternatives is grounded on the resilience principle of dynamic adaptation to changing demand or operating conditions. In particular, the aim was to determine whether a more gradual release of additional resources to the ED and restoration of normal operating conditions may limit the disruption of ordinary activities without worsening the capacity of the ED to promptly and fully respond to the MCI. A belt-shaped arrival rate of MCI patients is the underlying assumption (Figure 2).
According to the “Steps On-Off” strategy, ordinary activities (in particular ORs activity and admissions to wards) are gradually interrupted, in more than 1 step. Consequently, resources, in particular medical staff, are switched from ordinary to MCI activities in a gradual manner. In the recovery phase, as long as the amount of patients arriving in the ED decreases over time, ordinary activities are resumed gradually as well.
According to the “Steps Off” strategy, ordinary activities (in particular ORs activity and admissions to wards) are suddenly interrupted, similarly to the current PEMAF strategy. In the recovery phase, ordinary activities are resumed gradually, similarly to the “Steps On-Off” strategy. The underlining logic is that the maximum amount of available resources is allocated to the ED as soon as possible to respond to the sudden inflow of patients.
Alternative Resource Allocation Strategies for the Night/Holiday Scenario
The night/holiday scenario is the most critical one because of the limited available resources to sustain the hospital trauma capacity, either already on shift or that can be mobilized in a few minutes; the OSR’s PEMAF is mainly built considering this worst-case scenario.
In the present study, a detailed analysis was carried out on the maximum capacity for high-priority disaster patients (red and yellow codes) the ED is able to accept without reducing the level of care to nondisaster patients, with the available resources once the plan is activated. The aim is identifying the most critical resources and the best option for increasing the ED capacity. Reference Hick, Einav and Hanfling50 More specifically, taking the current PEMAF as a reference, alternative combinations of resources were analyzed and compared by the researchers. In particular, an increase of 1 or 2 units of the following critical resources was considered: shock rooms, anesthesiologists, general surgeons, entire trauma team, nurse and porter.
Study Methodology
Modeling Approach and Method
Model boundaries were set around the core processes related to the treatment of critical patients (red code), because they absorb the highest amount of resources. Starting from activities, procedures, and resources involved in the ED, the focus was expanded modularly to those hospital areas that interact with the ED and generate synergies or trade-offs. The ED, the ORs, as well as the critical wards were all set within the scope of the analysis. Table 1 accounts for the main process parameters and the resources allocated to the ED and ORs, respectively, under normal operating conditions.
Table 1. Main operational parameters and resources allocated to the ED and ORs
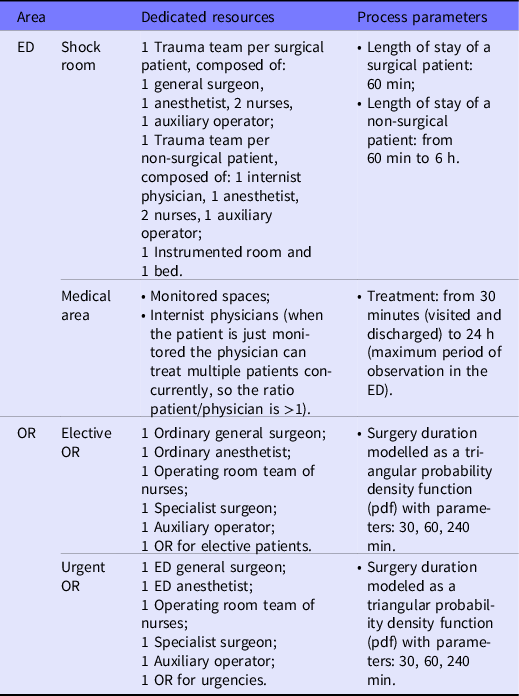
The operating block, includes 28 ORs, where general and specialized surgeries are performed. Elective surgical interventions begin at 8:00 am and ends at 8:00 pm, without any interruption. Among the 28 ORs, there is also 1 OR specifically dedicated to emergencies (24/7 logic). Each OR was modeled including the induction room (presurgery) and the recovery room (postsurgery), because it was considered as the appropriate level of detail for the aim of the study.
Other medical wards were modeled as a unique “black box,” where hospitalized patients, outpatients in day hospital, or those who entered the hospital through the ED spend a certain period of time and then are discharged. Incoming patients are: patients from ORs, patients from the intensive care unit (ICU), red code patients from the shock room, yellow and green code patients from the MCI, and ordinary patients. The overall balance between the hourly inflow and outflow determines the level of saturation of wards beds that are subdivided into nonsurgical and surgical.
Information regarding OSR activities was collected through a series of in-field visits and meetings with the medical officer responsible for the PEMAF. A flowchart representing the main processes of each unit was the main output in this phase. Other sources of information were exploited as well, such as the database of patients treated in ED in the past 2 y (2017-2018) as generated by the ED information system. The availability of resources under different scenarios were estimated by taking into consideration the predefined shifts of the personnel and the information contained in the hospital PEMAF.
The discrete event simulation (DES) Reference Zhang51 technique was selected to model the ED and the ORs, to secure the full time tracking of each single patient. Other wards were modeled by means of system dynamics (SD) Reference Samuel, Gonapa and Chaudhar52 to represent the required balance between admitted patients and resources (beds and personnel). The 2 models were implemented into a unique integrated simulation model within AnyLogic® suite. The data presented in this study are completely anonymous. OSR Ethical Committee authorized the publication of the study’s data on October 6, 2020.
Performance Measurement of Different Resource Allocation Strategies
When it comes to quantitative studies on emergency medical service management, quality of care and time-related performance metrics are typically used. Chow et al. (2012) proposes 2 different indicators for measuring quality of care in the ED: adverse non-admit events and adverse hospital events; the first one is the number of patients who will suffer an adverse impact due to the inability to access hospital treatments in time, while the second refers to the number of patients who will suffer an adverse event while inside the hospital. Several studies refer to the “backlog” of patients, such as in Hirsh (2004) Reference Hirsch53 , Manley and Hardy (2005) Reference Manley, Homer and Hoard30 , Yu Wang et al. (2012) Reference Wang, Luangkesorn and Shuman54 . Measuring the proportion of patients who voluntarily leave the ED because of the delay in receiving a medical evaluation (the so-called “walkouts”) is proposed by the General Accounting Office (GAO), in a report published in 2003. Time-based performance metrics reported in the literature are mainly of 2 types: the number of patients treated per time unit (eg, Alsubaie et al., 2015 Reference Alsubaie, Alutaibi and Marti55 ; Lubyansky, 2005 Reference Lubyansky56 ), and the patient’s waiting time. Bayram and Zuabi (2012) Reference Bayram and Zuabi57 proposed the injury to hospital interval (IHI) indicator, which is the time interval from the occurrence of the injury event to the completion of care to critical patients.
Patient waiting time is largely used in resilience studies to measure ED ability to provide emergency care to all the injured during an MCI (eg, Cimellaro et al., 2016 Reference Cimellaro and Piqué58 ; Cimellaro et al., 2010)Reference Cimellaro, Reinhorn and Bruneau59. Coherently, in the present study the patient waiting time parameter was selected as the key performance indicator. To account for different patients’ critical conditions, importance weights of waiting times in different phases of the care path were assigned by means of experts’ judgement elicitation using the AHP method, Reference Saaty60 a robust and widely used multi-criteria assessment method based on pairwise comparisons. In this way, priorities for waiting time minimization were set, as reported in Table 2.
Table 2. Relative importance of waiting times for different patient categories during an MCI
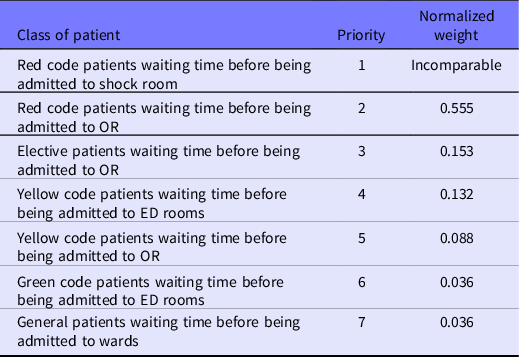
The importance of red code patients’ waiting time before being admitted to shock room was considered incomparable to any other waiting condition. As will be illustrated in the next paragraph, those patients who are not admitted in shock room in a sufficiently short time have been considered as “patient-at-risk” and counted through a specific performance parameter (PAR). Normalized weights of the remaining 6 categories were used to create the “Weighted Waiting Time Index” (WTI) indicator. WTI is computed as the weighted average of the waiting time of the last patient in queue for each patient class, that is:
 $$WTI = {(\sum\limits_{i = 1}^n {({w_i}*W{T_i})} )_t}\forall t$$
where: i = patient class, ie, green, yellow, and red code.
t = minute of the simulation run;
WT i = waiting time of the last patient in queue of class i-th;
w i = relative importance (priority) of patient i-th (see Table 4).
Consequently, the WTI is expected to give a representation of the overall hospital performance dynamics along the simulation timespan: the lower the WTI, the better the ED performance. Grounding on WTI, 2 resilience indicators were developed:
-
HRk = Hospital resilience under different resource allocation strategies (k) or the baseline
 $$H{R_k} = {\rm{ }}\int_{First\,MCI\,patient}^{Return\,to\,normal\,operations} {WTI\left( t \right)dt} $$
which provides a quantification of the hospital’s overall performance: the lower the value of HRk, the better the performance, provided the lower the peak of waiting time or the shorter the time to normal operations, or both.
-
HRIk = Hospital Resilience Improvement under different resource allocation strategies (k) against the baseline
 $$HR{I_k} = {{H{R_{Baseline}}} \over {H{R_k}}}$$
The higher HRIk the better the considered response strategy in comparison to the baseline (ie, the current PEMAF resource allocation strategy in the present study).
Moreover, the number of red code PAR was assumed as an additional indicator to assess the performance of different alternative strategies. This parameter refers to the situations in which critical patients have to wait before accessing the shock room; it represents a very significant risk for a red patient leading to a catastrophic adverse event. In the simulation, these types of events are represented by red code patients (agents) leaving the queue before entering the shock room (through a cut-off exit time) after the time threshold of 15 min set by the medical officer responsible for the PEMAF. PAR is a variable counting the number of cut-off events that occur in the simulation run. This index was evaluated against the expected number of PAR under normal operating conditions, assessed by a specific simulation campaign.
Considering the peculiar hospital’s operational setting under the night scenario, performance was evaluated by means of 3 indexes:
-
Red code PAR;
-
Patients assigned to an incomplete team, so resulting in a lower level of care (LLoC); it refers to the possibility of reducing the standard quality of care, in terms of staff assigned to a single patient, to face a sudden increase of incoming patients at the ED, which is above the available resources;
-
Maximum waiting time of red code patients to be admitted in the shock room (MaxWT).
Characteristics of the Simulated MCI
The MCI assumed for all the simulation campaigns was conceived as a sudden onset external to OSR MCI, characterized by peak demand soon after the alarm but limited in time.
To consider a severe MCI, a sequence of patients was generated stochastically departing from the dynamics of a real event, a rail derailment incident that directly involved OSR on January 25, 2008. Reference Faccincani, Stucchi and Carlucci61 On that date, a 5-car train, with approximately 300 passengers aboard, derailed in the eastern suburbs of Milan resulting in a total of 133 patients managed by the EMS. In accordance with START triage (the triage routinely used by EMS in Lombardy in the case of an MCI), 3 patients (2%) were dead at the time of access to scene by medics (black code), 5 (4%) were red (highest priority for evacuation), 9 (7%) yellow (intermediate priority for evacuation), and 116 (87%) were green (low priority). Of 133 patients, 78 (59%) were hospitalized. OSR represented the trauma center nearest to the scene of the incident and received the most severe patients.
It was further assumed that no green code patients, more than the ordinary ones, arrive to the hospital from the scene of the event (either through EMS or self-presented). This hypothesis corresponds to an MCI that is properly managed by EMS as incident Type 2 according to Lennquist’s definition. Reference Lennquist45
The generated sequence was recorded and replicated deterministically in every simulation, so as to simulate always the same event, which comprised 18 red code patients and 27 yellow code patients entering the ED in approximately 6 h. Triggering times of the event were set when simulating the daytime (Tuesday, September 17 at 11:00 am) and at night (Wednesday, September 18, at 02:00 am) scenarios.
Calibration and Validation
Two different methods were applied to validate the simulation model against the available data and the experience of the medical officer responsible for the PEMAF.
For what concerns the green and yellow code ordinary patients’ waiting times in the ED, a comparison of simulated data with real historical data under normal operating conditions was performed, using data recorded in the ED database in the period June 2017 to June 2018 (total number of records: 70,012). In Table 3, the simulated demand profile is reported and compared with the real profile extracted from the OSR ED database. According to historical data, the simulated demand falls in the 0.75 percentile of registered peak demand and according to the OSR PEMAF medical officer’s experience; it represents almost the upper bound of the total number of patients acceptable in the ED per week based on its current normal capacity. Table 3 also reports the comparison between simulated and real waiting time distributions of green and yellow code patients. Again, the OSR PEMAF medical officer considered the simulated data satisfactory and adequate to capture and assess the real behavior of the ED.
Table 3. Simulated vs real case demand parameters for the OSR ED: average number of patients by type, average waiting times of green and yellow code patients
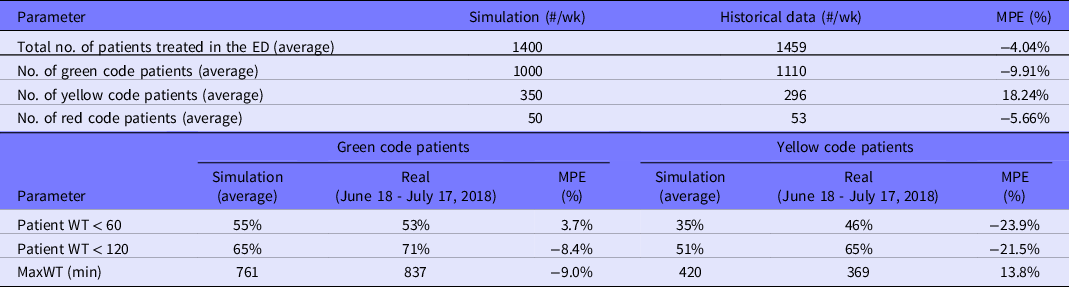
Abbreviation: MPE, Mean Percentage Error; WT, waiting time.
A focus group of experienced doctors and nurses from different OSR departments (ED, OR, wards) was involved in the validation of the simulation data generated by the remaining part of the hospital model, ie, OR procedures and hospitalization in wards, under the guidance of the OSR medical officer responsible for the PEMAF. Finally, the same focus group decided on the most effective way of implementing the alternative resource allocation strategies in the context of the simulated MCI, under the daytime scenario, provided that the available resources are those reported in the PEMAF for all the cases.
Results
Baseline Scenario
Under stable normal operating conditions, OSR performance results into an average WTI of 32.11 min (95% confidence interval = ± 4.7 min). Only 1 PAR was recorded in the baseline night scenario in 9 simulations; therefore, baseline PAR is 0.11 on average.
Daytime Scenario
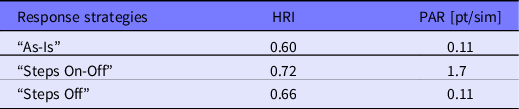
Table 4 summarizes the results of the first simulation campaign. For each 1 of the 3 response strategies, the HRIk and PAR indexes were computed. HRIk equal or close to 1 means that hospital’s performance loss is limited during an MCI and that the corresponding strategy proves to be effective. At the same time, PAR should remain as low as possible and close to the baseline.
Table 4. Simulation results of the daytime scenario: Values of the 3 different resource allocation strategies are reported in lines
The graph reported in Figure 3 compares the WTI trends of the 3 alternative strategies. Figure 4 depicts the time variability of the average WTI standard deviation of the “As-is” and the “Steps Off” strategies, respectively.
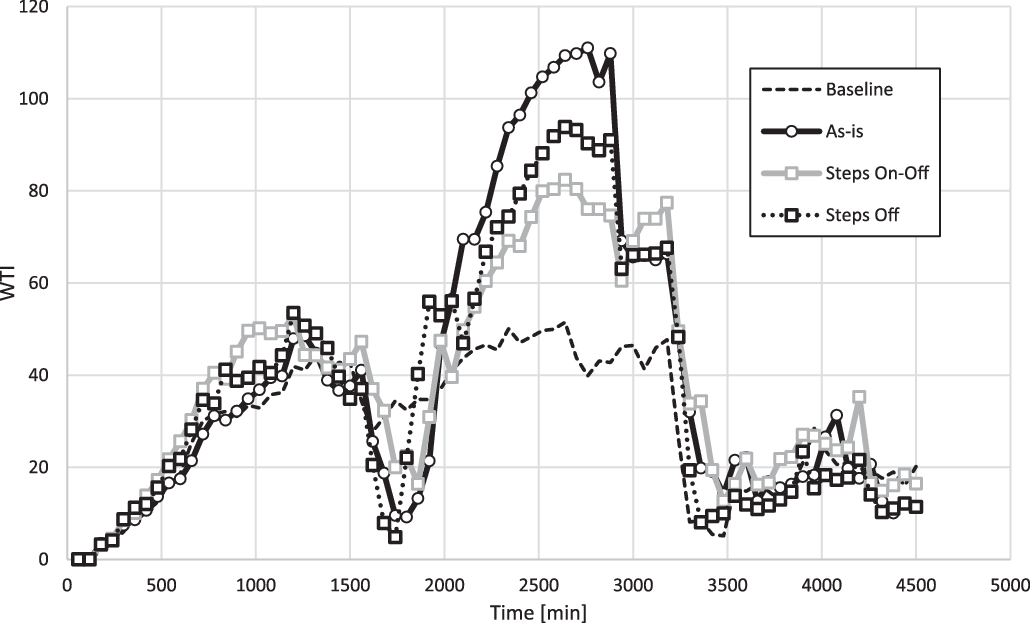
Figure 3. Simulation results of the daytime scenario. Average hourly WTI of different resource allocation strategies vs. the baseline.
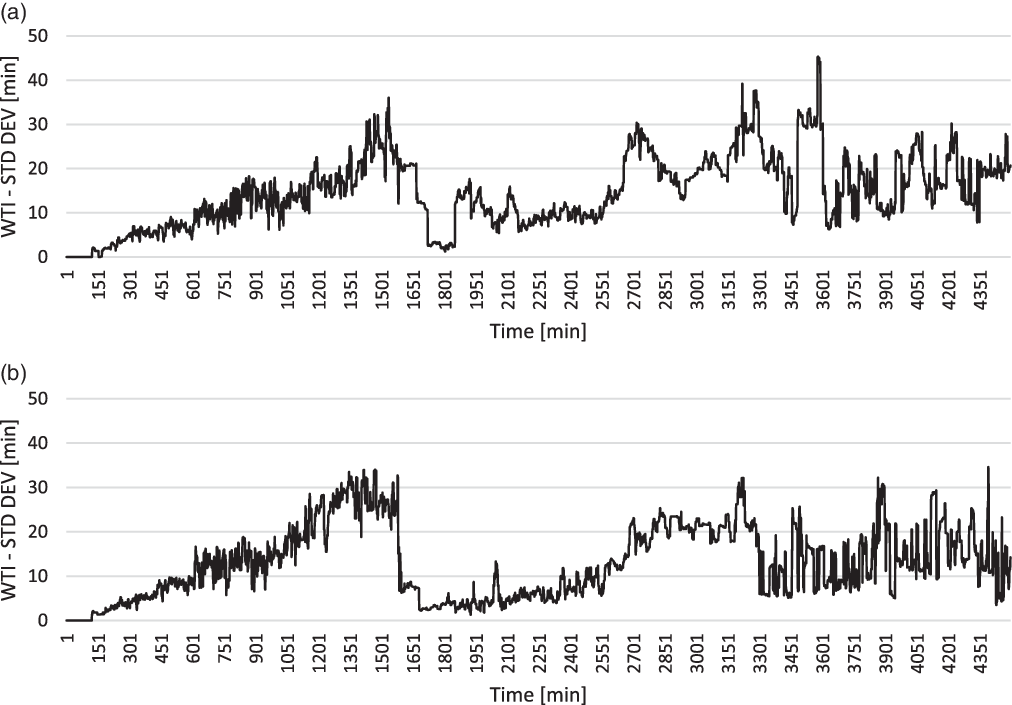
Figure 4. Simulation results of the daytime scenario. Average WTI standard deviation of: “As-is” strategy (a), “Steps Off” strategy (b).
Night Scenario
Overall, 9 different resource configurations were generated, and 10 simulations were run for each. An additional time-based analysis was performed to compare the PEMAF configuration against the best alternative resource configuration, ie, adding 1 anesthesiologist and 1 general surgeon (avg. PAR = 3.90 patients; avg. MaxWT = 28.10 min; avg. LLOC = 3.00 patients). The aim was to better evaluate the capability of the ED to dynamically respond to the MCI over time. The temporal development of the MCI was analyzed looking at the occurrence of situations in which red code patients are exposed to risk (number of red code PAR) or treated at a level of care lower than the standard (number of LLoC patients), as reported in Figure 5.
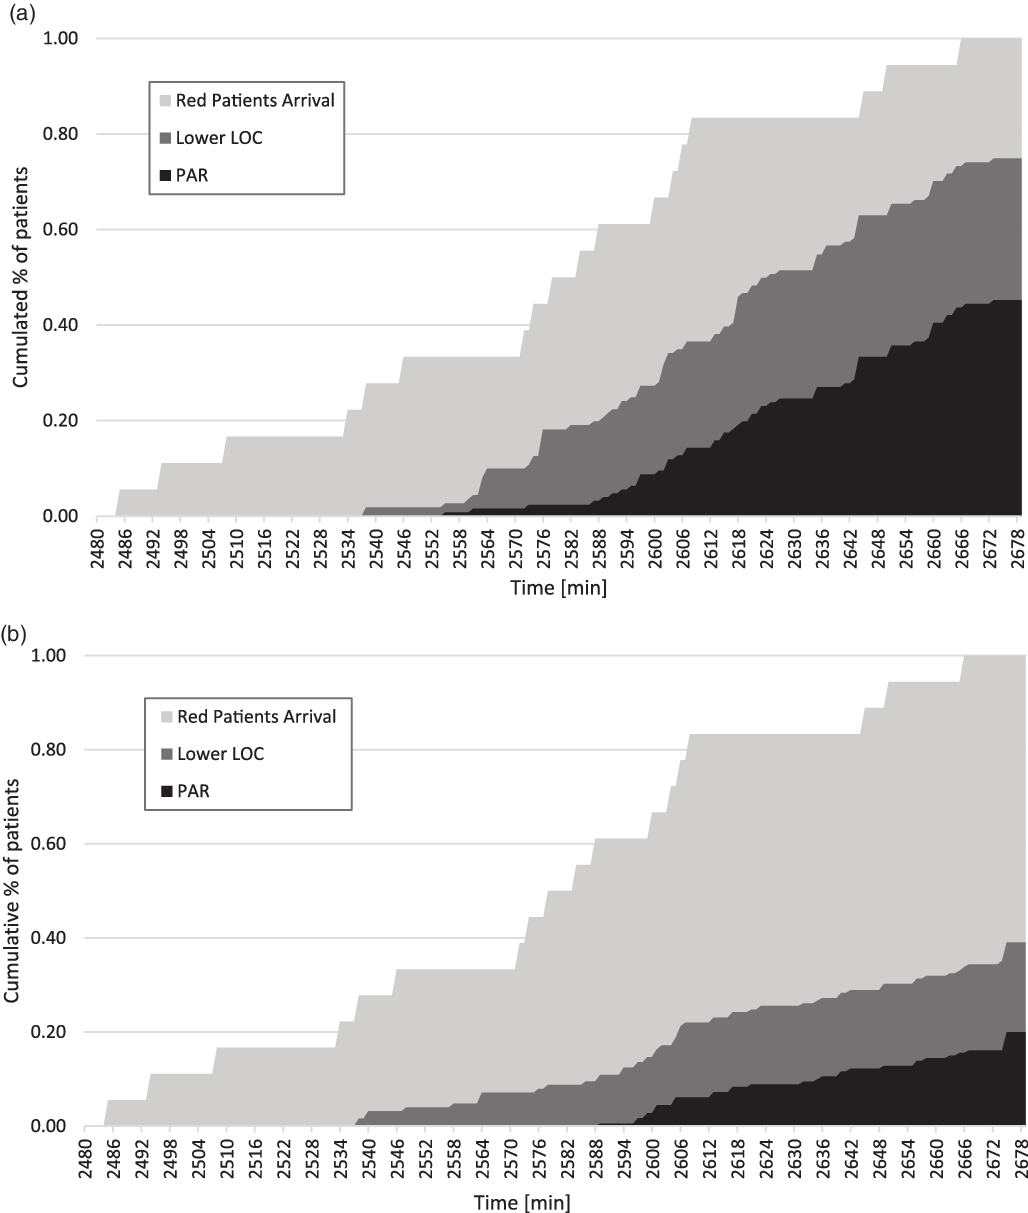
Figure 5. Simulation results of the night scenario. Temporal development of performance indexes: “As-is” strategy (a), “Improved strategy” (additional resources: 1 anesthesiologist, 1 general surgeon) (b).
Analysis of Results
Daytime and night/holiday scenarios are radically different in terms of resource configuration and possible hospital’s resource mobilization in case of an MCI is declared, which cannot be generalized across scenarios; they have been investigated accordingly and now will be discussed separately.
As for the daytime scenario, when it comes with the waiting time performance (WTI), the proposed alternative resource allocation strategies (“Steps On-Off” and “Steps Off”) perform better than the current PEMAF. Indeed, the HRI value of “As-is” scenario is the lowest, whereas “Steps On-Off” returns the highest HRI value. However, its PAR (1.7 on average) is unacceptable because it is much higher than the threshold (0.11 on average). It can be argued that the “Steps Off” strategy is the best compromise, granting a relatively better HRI (0.66 > 0.60 on average) and the same PAR value (0.11 on average) of the “As-is” strategy. In other words, a gradual release of resources to the ED from ordinary activities, at the early stages of an MCI, is not able to grant an adequate priority and quick treatment to red code patients (higher PAR), even though it returns the lowest WTI. On the contrary, the “Steps Off” strategy shows some marginal improvement when shifting resources gradually back from the urgent to the ordinary activities. Particularly relevant is the possibility to reallocate some ORs to the most urgent and already scheduled elective surgical interventions. The possibility of limiting the disruption of pre-existing waiting lists for elective surgeries and of limiting time delays before hospitalization of noncritical patients, without worsening the capability of the system to absorb the demand pick induced by the emergency is coherent with the general criteria of PEMAF and the common health-care management policies. Reference Vanvactor29,Reference Runkle, Brock-Martin and Karmaus31,Reference Kurihara, Bisagni and Faccincani34
As for the night/holiday scenario, our simulation campaign returned a clear indication on the most critical resources and improving the operational capacity of the ED to properly treat red code patients. Adding 1 anesthesiologist and 1 general surgeon to the current configuration of a night shift (“As-is” strategy) is sufficient to significantly reduce the number of PAR, from 8.20 to 3.90, as well as the number of patients treated at a LLoC than the standard, from 5.40 to 3.00. Adding 1 entire trauma team would grant similar results (PAR = 3.50; LLoC = 3.20) but at a much higher cost.
A more aggregate assessment of the absorption capacity of the ED, and of the shock rooms in particular, can be achieved by looking at the time delay between the first arrival of a red code patient linked to the MCI and the first PAR within the ED, which represents a degraded care delivery condition. Under the “As-is” strategy, the ED is able to absorb the demand pick with limited decrease in performance (few LLOC patients) for approximately 1 h (first 4-5 red code patients), whereas under the “Improved strategy,” the time delay expands up to 1.5 h (first 6-7 red code patients). According to OSR experts, the second one is perfectly compatible with the time needed to activate the PEMAF and then mobilize additional staff during a night shift.
Discussion
The ongoing COVID-19 pandemic pressure on hospitals is showing how responding to a medical emergency inevitably results into a worsening of the quality of care delivered to a wide spectrum of hospitalized and outpatients. Reference Weinstein, Ragazzoni and Burkle33-Reference Coimbra, Edwards and Kurihara35 This phenomenon is well echoed in the literature addressing hospitals’ response to an MCI. Reference Myrtle, Masri and Nigbor23,36
However, the growing discourse around hospital resilience, 20-Reference Myrtle, Masri and Nigbor23 has so far focused on the preparedness and response capacities to cope with the sudden surge of the number of incoming critical patients in the ED. In the present study, a novel view was taken, trying to address at the same time the persisting needs of the other hospitalized patients, thus extending the investigation of a resilient response to a wider spectrum of hospital’s health-care delivery processes.
To this end, while extant literature limited the investigation of hospital resilience to structural or functional performances, Reference Mehani, Benouar and Bechtoula24-Reference Achour, Miyajima and Pascale26 to organizational aspects, such as staff attendance in disasters Reference Senpinar-Brunner, Eckert and Wyss27 or disaster management procedures, Reference Vanvactor29 in this study, specific attention was devoted to assessing the effectiveness of adaptive resource allocation strategies. The results obtained contribute to moving forward the development of hospital resilience against an MCI through a better mobilization of resources able to preserve as much as possible less critical and elective activities.
Along this line, the proved effectiveness of a dynamic resource allocation approach, able to better fit the intrinsic dynamism of an incident, may help in closing the existing knowledge and practical gaps when it comes to leveraging on BCM principles and practices Reference Zhong, Clark and Hou39-Reference Labaka, Hernantes and Sarriegi43 for enhancing hospital resilience in response to a crisis. Indeed, thanks to a more effective use of resources, wider spectrum of care processes can be supported even during the crisis, and shorter but realistic recovery time objectives can be set as well. Beyond the practical value of the returned results, the present study also offers a possible methodological approach, based on DES and SD, for selecting and validating resource allocation strategies in advance, ie, in the preparedness phase.
However, the dynamics of the hospital’s performance during an MCI shows a common pattern; 2 waves of performance loss are observable, under any resource allocation strategy, that degrades the quality of care compared with normal operating conditions. The first wave translates the increasing saturation of resources at the ED that is later mitigated by the allocation of additional resources. Whereas, the second wave of performance loss is mainly due to the interruption of elective activities in the ORs and other wards and is always worse than the first. This dynamic clearly shows that there is a time delay before the hospital system enters a status of performance instability generated by the MCI demand. Interestingly, the time frame of this dynamic is invariant to different internal resources reconfigurations transients; thus, it is of more structural nature, depending on the health-care process configuration and on the overall amount of available resources at hospital level. It can be concluded that further improvements could be only achieved by orchestrating resources between different hospitals in the area where the MCI occurred. Reference Lim, Li and Fang62 Further investigations are advisable to verify to what extent the adaptive resource allocation logics tested in the present study are still valid for orchestrating resources within a network of hospitals.
Conclusions
In the present study a simulation-based approach was adopted to select, validate, and improve hospital’s resource allocation strategies to MCIs. The study aimed at identifying strategies able to minimize the disruption of hospital elective activities while safeguarding the priority access to care for critical patients.
The study originally contributes to the advancement of research on resilience and BCM in health care. It proposes a set of metrics to account for different objectives and priorities in the management of an MCI, along with a multi-method simulation approach enabling a suitable modeling of all the relevant hospital departments and functions.
The study provides relevant insights for practitioners as well. Simulation campaigns confirmed the general suitability of the current hospital approach toward the reconfiguration of resources to cope with an MCI (the PEMAF plan), which is primarily intended to guarantee the maximum care delivery capacity of the ED in the early stages of the event. On the other hand, it was demonstrated that a gradual reallocation of resources to ordinary activities in OR and wards minimizes the disservice to elective surgical patients without any significant impact on red code patients. This alternative strategy proved to enable better hospital resilience both in terms of WTI and PAR. In the night scenario case, when resource constraints are tougher, an efficient resource allocation and configuration strategy was identified that grants the minimum time delay needed for the mobilization (call on duty) of additional professional resources.
The present study has some limitations. First, it involved only 1 hospital; for the sake of generalization of results, it is desirable to test the proposed strategies over a wider set of hospital’s characteristics and MCI response plans. Second, the validation process of simulation data was conducted involving some experienced doctors and nurses from different OSR departments and largely relied on the experience of the medical officer responsible for the PEMAF; different and more robust validation protocols could be proposed in the future.
Future research should be directed toward network level analysis and simulation, along with the testing of alternative response strategies against MCI of different natures, with different time patterns and demand profiles.


